|
KIGALI INSTITUTE OF EDUCATION
OCTOBER 2010
Analysis of factors affecting inflation rate in Rwanda
(1990-2009)
BY: Richard UFITINEMA
REG. NUMBER: 3014/06
A research project submitted to the faculty of social
sciences and business studies, Kigali Institute of education
In partial fulfillment of the requirements for the degree of
bachelor of social sciences (hons), Economics with Education and QTS
(Secondary).
Word count: 11,080
Supervisor: Mr. Alain Claude KARASIRA
ABSTRACT
This study was carried out in the context of global financial
crisis characterized by a worst inflationary shock in Rwanda during recent
years, it uses chronological data (1990-2009) to analyze the extent to which
changes in Money Supply (M2); in Output (Real GDP); in Exchange rate and
interest rate (Lending rate) influence the inflation. The data consist of the
aggregated data set of 20 years compiled by NBR and NISR. Using a non- linear
and multivariate model, this study estimates the dynamic influence of changes
in M2, in real GDP, in exchange rate and interest rate on Inflation. It is
found that an increase in M2 has a positive and significant influence on
Inflation. Contrary to Real GDP have a negative and significant influence on
Inflation. The study reveals that Money Supply (M2), in Output (Real GDP), in
Exchange rate and interest rate (Lending rate) count for 97.2% variations in
the general prices level (Inflation). Some recommendations are suggested as
emanating from the findings of the study like to pursue a control of monetary
and fiscal policy by government as well as substantial growth in agriculture
sector and other economic activities that contributed in increase of output are
also suggested to moderate the rate of inflation in Rwanda.
DECLARATION
I hereby declare that this submission is my own work and to
the best of my knowledge it contains no materials previously published or
written by another person, nor material which to a substantial extent has been
accepted for award of any other degree or diploma at KIE or any other
educational institution, except where due acknowledgement is made in the
project. Any contribution made to the research by others, with whom I have
worked at KIE or elsewhere is explicitly acknowledged in the Report.
I also declare that the intellectual content of this report is
the product of my own work, except to the extent that assistance from others in
the project's design and conceptions or in style, presentation and linguistic
expression is acknowledged.
(Signed) ....................................... Date
.....................................
APPROVAL
This is to certify that UFITINEMA Richard has carried out
research entitled «Analysis of factors affecting inflation rate in
Rwanda (1990-2009)» under my supervision and guidance.
Date: ......................................
Signed ...................................
Mr. Alain Claude KARASIRA
DEDICATION
To the Almighty ALLAH,
For your Mercy, Grace and Love,
To my mother, brothers and sisters and my late father who never
lived to see this dissertation,
For your immeasurable love, tolerance, guidance and care, I
respect.
To all who are the dear to me,
I dedicate this memoir.
ACKNOWLEDGEMENT
The success of a dissertation is a big endeavor that one never
claims to own alone and when it comes to expressing gratitude, it is always
hard to find who to thank and who to leave. This is because various people
played different roles under different circumstances in their particular
capacities through out the period of writing my dissertation. However let me
attempt to this great task:
I owe special thanks to my Mum who managed to forego all and
made their son an opportunity cost, without forgetting my brothers and my
sisters who were always there for me during my academic struggle. May God bless
them abundantly.
I extend my sincere gratitude to my supervisor Mr. Alain
Claude KARASIRA, I am grateful for their advice, instructions and time
sacrificed towards the success of this work.
I am greatly indebted to my friends for both moral and
academic support.
Lastly I wish to thank the entire staff of the Kigali
Institute of Education; mostly the Faculty of Social Sciences and Business
studies, Department of Economics and Business studies may the almighty God
award you abundantly.
TABLE OF CONTENTS
ABSTRACT
II
DECLARATION
III
APPROVAL
IV
DEDICATION
V
TABLE OF CONTENTS
VII
LIST OF ABBREVIATIONS
IX
LIST OF TABLES & GRAPHS
X
CHAPTER ONE: INTRODUCTION
1
1.1 Background
1
1.2 The research Problem
2
1.3 Research objectives
3
1.4 Research Hypotheses
4
1.5 Significance of Study
4
1.6 Scope of the study
4
1.7 Organization of the study
5
CHAPTER TWO: LITERATURE REVIEW
6
2.1 DEFINITION OF KEY CONCEPTS
6
2.1.1 Inflation
6
A. Different types of inflation
6
B. Causes of inflation
8
C. Measuring Inflation
9
2.1.2 Consumer Price Index
10
2.1.3 Gross Domestic Product
12
2.1.4 Interest rate
12
2.1.5 Money Supply
13
2.1.5 Exchange rate
13
2.2 THEORETICAL FRAMEWORK
14
2.3 EMPIRICAL FRAMEWORK
17
CHAPTER THREE: RESEARCH METHODOLOGY
20
3.1 DATA COLLECTION
20
3.1.1 Techniques
20
3.1.2 Types and sources of data
20
3.2 DATA ANALYSIS
21
3.2.1 Methods
21
CHAPTER FOUR: DATA PRESENTATION ANALYSIS AND
INTERPRETATION
24
4.1 DATA PRESENTATIN
24
4.1.1 EVOLUTION OF CPI, M2, Real GDP, ER and
LR (1990-2009)
24
4.2 DATA ANALYSIS AND INTERPRETATION
25
4.2.1 Correlation between variables
25
A. Correlation between Consumer Price Index and Money Supply (M2)
25
B. Correlation between Consumer Price Index and Real Gross
Domestic Product
26
C. Correlation between Consumer Price Index and Exchange rate
27
D. Correlation between Consumer Price Index and Lending rate
28
4.2.2 Regression equation of the model
29
1. Summary of output from SPSS
regression analysis of multivariate
29
2. Specification of general model
30
3. Predictive accuracy of the general
model
30
CHAPTER FIVE: CONCLUSION AND RECOMMENDATIONS
31
BIBLIOGRAPHY
33
APPENDIXES
36
Appendix 1: Regression analysis of consumer price index
and money supply
37
Appendix 2: Regression analysis of consumer price index
and Gross domestic product
38
Appendix 3: Regression analysis of consumer price index
and Exchange Rate
39
Appendix 4: Regression analysis of consumer price index
and Lending Rate
40
Appendix 5: SPSS Result of Regression Analysis
41
Appendix 6: T-Table
42
LIST OF ABBREVIATIONS
CPI : Consumer Price Index
ECB : European Central Bank
ECOSTATS: Economic Statistics
EICV : « Enquêtes Intégrale sur les
Conditions de Vie des Ménages au Rwanda »
FRB : Federal Reserve Board
GDP : Gross Domestic Product
IBR : International Business Research
ILO : International Labor Office
IMF : International Monetary Fund
LOG : Logarithm
NBR : National Bank of Rwanda
NISR : National Institute of Statistics of Rwanda
SPSS : Statistical Package for the Social Sciences
LIST OF TABLES & GRAPHS
TABLES
Table 1 : Inflation by region (Annual % change)
Table 2 : Evolution of CPI, M2, Real GDP, Exchange rate and
Lending rate (1990-2009)
GRAPHS
Graph 1 : Trends in Consumer Price Index and Money Supply,
1990-2009
Graph 2 : Trends in Consumer Price Index and Gross Domestic
Product, 1990-2009
Graph 3 : Trends in Consumer Price Index and Exchange rate,
1990-2009
Graph 4 : Trends in Consumer Price Index and Lending rate,
1990-2009
CHAPTER ONE: INTRODUCTION
1.1 Background
Inflation constitutes one of the major economic problems in
emerging market economies that requires monetary authorities to elaborate tools
and policies to prevent high volatility in prices and long periods of
inflation.
Based on the statistics released by International Monetary
Fund (IMF), in industrialized countries, inflation has generally been
controlled. Inflation, measured by the change in the Consumer Prices Index
(CPI), declined steadily, reaching 1.5% in 1998, the lowest rate recorded since
1990, after 2.1% in 1997, 2.7% in 1996 and 2.6% in 1995 (IMF, 1999:180).
Regarding developing countries, the same statistics mentioned
above shows that inflation has fallen sharply since 1995, recording rates of
22.1% and 14.6% respectively in 1995 and 1996 against 47.5% in 1993 and 51.8%
in 1994. During 1997, inflation has fallen sharply again to 9.2% and then
increased to 10.3% in 1998. In Asia the rate of inflation fell to 4.8% in 1997
against 8.2% in 1996 while in Africa, he settled in less than half of the new
1996 (11.1% in 1997 against 25.9% in 1996) due to reforms and macroeconomic
stabilization policies implemented in the country market. In 1998, inflation
was reduced to 8.7% in Africa, while in Asia it rose again to 8.0% on the trace
of the crisis that rocked the continent.
In sub-Saharan Africa, the inflation rate was 13.7% and 10.3%
respectively in 1997 and 1998 against 32.3% in 1996.
After the years of double-digit inflation in 1990-95 and
predominantly high inflation in 1996-2000, global rates fell to less than 5% in
2000-05. The most marked decreases were recorded in the transition countries,
and the most stable, continuously low and decreasing inflation was recorded in
the developed countries (ILO 2005:32).
The financial crisis which occurred in the United States in
the second half of 2006 and became acute in 2008 continues to affect seriously
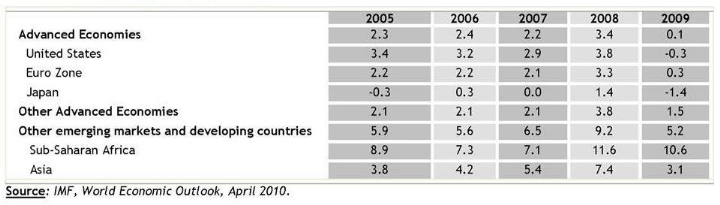
the world economic outlook. In USA, inflation was 3.8% on average at the
end of the year 2008 against 2.9% recorded in 2007 then declined by 0.3% in
2009. In the Euro Zone, harmonized inflation was 3.3% while it was 2.1% in
2007. The last estimates of the International Monetary Fund (IMF) highlight a
world economic growth rate of 3.2% at the end of 2008 against 5.2% recorded in
2007 and stood at 0.3% in 2009. (NBR, 2009:15)
The following table shows annual percentage change of
inflation by region of the recent years from 2005 to 2009
Table 1: Inflation by region (annual %
change)
1.2 The research Problem
Thanks to the direct control of credit and prices, inflation
was kept at a low level during the 1980s, an average rate of 4.7%. In the
context of the 1990-1994 war, inflation was bound to increase and it indeed
reached 64% in 1994. During the 1996-2000 period, the progressive restoration
of institutions and security in the entire country, the control of public
expenditure and monetary policy allowed the country to contain inflation at an
average level of 5.4%. During the 2001-2005 periods, inflation was kept at an
average rate of 6.7%. (Musoni 2009:5)
Rwanda's economy in 2008 developed in an unfavorable
international economic environment characterized by a worst inflationary shock
and the current global financial crisis. The world economy experienced
important inflationary shocks during the first half of 2008 due essentially to
the increase in world oil and food prices. On annual average, inflation in
advanced economies was 3.4% in 2008 against 2.2% in 2007.
Despite the unfavorable international environment, Rwandan
economy continued to perform well with the real GDP growth rate of 11.2% in
2008 following 7.9% recorded in 2007. This growth was mainly due to a strong
recovery in the agriculture sector which registered a growth rate of 15%
compared to 0.7% in 2007 and a noticeable improvement both in industry and
service sectors which increased by 10.7% and 7.9% respectively. The secondary
sector growth was driven mainly by good performance in the construction and
public works sub-sector (26%) and production of electricity (16.9%) despite a
decline in manufacturing of 4.1%. (NBR 2008:3)
According to the NBR (2009:4), the overall inflation
accelerated from 6.6% in December 2007 to 22.3% in December 2008, despite the
improvement in agriculture production and the low growth of broad money. In
terms of annual average, the inflation in 2008 reached 15.4%, against 9.1% in
2007 due to decline in import prices, good performance of agricultural
production, annual average inflation dropped to 10.3% from 15.4% in 2009.
The inflationary pressures resulted particularly from the
international fuel and food prices. Compared to the year 2007, terms of trade
deteriorated by 16.5% in 2008, their index falling from 150.5 in 2007 to 125.7
in 2008. Contrary to the year 2007 when the export average value had increased
more than the import average value (18.2% compared to 2.2%), trends were
reversed in 2008.
The questions that come to mind after considering these issues
concerns factors that explain inflation in Rwanda. Relatedly, is there an
economically interpretable relationship among Consumer prices Index, output,
interest rate, money supply and the exchange rate? And lastly, how can we use
these variables to forecast future inflation rate in Rwanda?
1.3 Research objectives
In view of the above research problem, the broad objective of
this study analyzes statistically factors affecting inflation rate in Rwanda.
This involved specifying and estimating an inflation regression model with the
consumer prices index as the dependent and, gross domestic product, interest
rate, money supply and exchange rate as the explanatory variables.
The specific objectives of the study therefore were:
i. To determine the effect of Money supply on the inflation
rate in Rwanda;
ii. To determine the effect of the gross domestic product
(output) on the inflation rate in Rwanda;
iii. To determine the effect of exchange rate on the inflation
rate in Rwanda;
iv. To determine the effect the interest rate on the inflation
rate in Rwanda.
1.4 Research Hypotheses
In consistent with specific objectives above, this study tests
the following null hypotheses:
i. H0 : Money supply has no effect on inflation rate in
Rwanda.
H1 : Money supply has a significant positive effect on
inflation rate in Rwanda.
ii. H0 : Output has no effect on inflation rate in Rwanda.
H1 : Output has a significant positive effect on inflation
rate in Rwanda.
iii. H0 : Exchange rate has no effect on inflation rate in
Rwanda.
H1 : Exchange rate has a significant positive effect on
inflation rate in Rwanda.
iv. H0 : Interest rate has no effect on inflation rate in
Rwanda.
H1 : Interest rate has a significant positive effect on
inflation rate in Rwanda.
The student's t-test was used
to test the above hypotheses at the 5% significance level.
1.5 Significance of Study
In an inductive perspective, this study increases our
understanding about the effect of studied variables on inflation rate in Rwanda
hence, it can be used by decision markers to control or carry out the problem
of inflation based on correlation coefficient of each variable to the
inflation. In a deductive perspective, this study helps the researcher to
increase deep knowledge about the frequent fluctuations of the prices on the
market; it will also help my community to ascertain further studies about the
inflation based on our achievement.
1.6 Scope of the study
Our research as any other scientific work is limited in time,
space and in the domain. In time, we focused our analysis on the period from
1990 to 2009 because the period allowed us to search recent data related to our
subject.
Regarding the delimitation of space, our study focuses on
Rwandan territory. In the field, our study focuses on aggregate macroeconomic
variables between inflation and its possible effects on the economy.
1.7 Organization of the study
This study have five chapters which will be organized as
follows: Chapter one is an introduction giving the background of the study,
research problem, research objectives, research hypotheses, significance of the
study, hypothesis, and scope of the study. Chapter two is the literature
review. Chapter three presents a discussion of the methodology adopted for the
empirical analysis, followed by the results and discussion of the empirical
analysis in chapter four. The last chapter considers the conclusion and
recommendations.
CHAPTER TWO: LITERATURE REVIEW
2.1 DEFINITION OF KEY CONCEPTS
The concept is a prerequisite for any research. To avoid using
vague terms and to fight against any kind of ambiguity, it is important to
begin by defining the details of the key concepts of the study. The concepts
defined in this study are: Inflation, Consumer Price Index, Gross Domestic
Product, Interest Rate, Money Supply, Exchange rate.
2.1.1 Inflation
In economics, inflation is a rise in the general
level of prices of goods
and services in an economy over a period of time. Moreover different economists
have defined inflation as follows: According to the Kumar (1993:258)
«inflation refers to the persistent, steady and continuous rise in the
general prices of all outputs as well as inputs».
G. Crowther defines inflation as «a stage in which value
of money is falling i.e. prices are rising.» Thus, inflation does not
refer to the rise of price of one or two commodities, but the general rise in
prices of all goods.
Prof. Coulburn has defined inflation as «too much money
chasing too few goods» (Kumar and Mittal 2002:168).
According to Peterson (1977: 294) popularly inflation refers
to the «sustained rise in the general price level and is
generally measured by changes in the consumer price index».
A. Different types of inflation
According to the Kurman (1993: 260) Inflation has been divided
into many kinds on the basis of different criteria like (1) Speed of inflation,
(2) cause of inflation, (3) Control etc.
a. Creeping, Walking, Running and Galloping
inflation: on the basis of rapidity of the rise in the prices
inflation has divided into 4 types: creeping, walking, running and galloping
inflation. However the different between these types of inflation is rather
matter of degree only. Different names are given to different speed of
price-rise.
When the price rises very slowly by about 3%, we call it
creeping inflation, it is very mild and does not cause any harm to the economy.
During walking inflation the rise in prices becomes more marked and it gives
the danger signal of the occurrence of running inflation. When the prices
increase by more than (say 10%) per annum, there is running inflation, which
causes great harm to the economy. Running inflation gives rise to the galloping
inflation, which is also known as jumping or hyper-inflation. During this
situation, there is acute shortage of goods and extra ordinary expansion of
currency and credit and it is very alarming and has disastrous consequences.
b. Demand-pull and Cost-push inflation: On
the basis of cause of inflation, it has been
divided into two types: Demand-pull inflation and Cost-push inflation.
Demand-pull inflation is one kind of inflation which is caused by the excess
demand for goods and services. This inflation takes place when the general
prices rise as a result of growing demand for goods and services in relation to
their supply.
On the other hand cost-push inflation refers to the situation
of steady rise in prices which are mainly caused by the continuous rise in the
cost of production of goods and services. It is the most important and popular
type of inflation in developing countries. The cost of production of the
producers rises continuously. Higher cost leads to higher prices always.
If the prices rise only due to higher wages then we call it
«wage-induced» inflation. In other words the wage induced inflation
occurs when the money wage rises faster than the labour productivity. Sometimes
cost-push inflation becomes «profit-push» inflation, when the
monopoly producers charge higher prices and enjoy higher profit margins.
c. Open inflation and suppressed inflation:
open inflation refers to the unrestricted price-rise. When prices rise
continuously and substantially, without any regulation, the phenomenon is
called `open' inflation. During this inflation, the increase in demand directly
leads to the ever increasing prices.
However, open inflation does not occur nowadays. No government
allows such situation to take place. There are always some regulatory methods
adopted by the governments to control the rise in price.
On the other hand, Suppressed inflation is regulatory
inflation, known as latent inflation. The control measures sometimes may
succeed for a short period. But in the long run the suppressed inflation may
become uncontrollable and become open or hyper.
d. Imported inflation: Inflation due to
increases in the prices of imports, increases in the prices of imported final
products directly affect any expenditure-based measure of inflation. Increases
in the prices of imported fuels, materials, and components increase domestic
costs of production, and lead to increases in the prices of domestically
produced goods. Imported inflation may be set off by foreign price increases,
or by depreciation of a country's exchange rate.
B. Causes of inflation
There are many different reasons that can account for the
inflation in goods and services, depending on a number of factors:
Ø Cost Push Inflation
Cost-push inflation occurs when businesses respond to rising
production costs, by raising prices in order to maintain their profit margins.
There are many reasons why costs might rise:
a) Rising imported raw materials costs
b) Rising labour costs: caused by wage
increases which exceed any improvement in productivity.
c) Higher indirect taxes imposed by the
government: for example a rise in the rate of excise duty on alcohol
and cigarettes, an increase in fuel duties or perhaps a rise in the standard
rate of Value Added Tax or an extension to the range of products to which VAT
is applied.
Ø Demand Pull Inflation
Demand-pull inflation is likely when there is full employment
of resources. In these circumstances an increase in aggregate demand will lead
to an increase in prices. Aggregate demand might rise for a number of
reasons:
a) A depreciation of the exchange rate, which
has the effect of increasing the price of imports and reduces the foreign
price. If consumers buy fewer imports, while foreigners buy more exports,
Aggregate Demand will rise. If the economy is already at full employment,
prices are pulled upwards.
b) A reduction in direct or indirect
taxation. If direct taxes are reduced consumers have more real
disposable income causing demand to rise. A reduction in indirect taxes
will mean that a given amount of income will now buy a greater real volume of
goods and services.
c) The rapid growth of the money supply when
the monetary authorities permit an excessive growth of the supply of money in
circulation beyond that needed to finance the volume of transactions produced
in the economy.
d) Rising consumer confidence and an increase in the
rate of growth of house prices: both of which would lead to an
increase in total household demand for goods and services
e) Faster economic growth in other countries:
providing a boost to exports overseas.
Ø The wage price spiral -
«expectations-induced inflation»
Rising expectations of inflation can often be self-fulfilling.
If people expect prices to continue rising, they are unlikely to accept pay
rises less than their expected inflation rate because they want to protect the
real purchasing power of their incomes.
C. Measuring Inflation
According to Report of European Central Bank (Jan 2009:25)
Most countries have a simple common-sense approach to measuring inflation,
using the so called «Consumer Price Index» (CPI).
For this purpose, the purchasing patterns of consumers are
analyzed to determine the goods and services which consumers typically buy and
which can therefore be considered as some how representative of the average
consumer in an economy. As such they do not only include those items which
consumers buy on a day-to-day basis (for example bread and fruit), but also
purchases of durable goods (for example cars, Computer, washing machines, and
so on.) and frequent transactions (for example rents). Putting together this
«shopping list» of items and weighting them according to their
importance in consumer budgets leads to the creation of what is referred to as
a «market basket».
Each month, a host of «price surveyors» checks on
the prices of these items in various outlets. Subsequently, the costs of this
basket are then compared over time, determining a series for the price index.
The annual rate of inflation can then be calculated by expressing the change in
the costs of the market basket today as a percentage of the costs of the
identical basket the previous year.
However, the developments of the price level as identified by
such a basket only reflect the situation of an average» or representative
consumer. If a person's buying habits differ substantially from the average
consumption pattern and thus from the market basket on which the index is
based, that person may experience a change in the cost of living that is
different to the one shown in the index. There will therefore always be some
people who experience a higher «inflation rate» for their
«individual basket» and some who face a lower «individual rate
of inflation». In other words, the inflation measured by the index is only
an approximate measure of the average situation in the economy; it is not
identical to the overall price changes faced by each individual consumer.
2.1.2 Consumer Price Index
International Labour Office (ILO) defined consumer prices
index (CPI) as index numbers that measure changes in the prices of goods and
services purchased or otherwise acquired by households, which households use
directly, or indirectly, to satisfy their own needs and wants.
According to the National Institute of Statistic of Rwanda,
The CPI is a measure of the average change over time in the prices of consumer
items goods and services that people buy for day-to-day living. The CPI is a
complex construct that combines economic theory with sampling and other
statistical techniques and uses data collected each month to produce a timely
measure of average price change for the consumption sector of the Rwandan
economy (NISR: March 2010)
The CPI can be intended to measure either the rate of price
inflation as perceived by households, or changes in their cost of living (that
is, change in the amounts that the households need to spend in order to
maintain their standard of living).
In practice, most CPI are calculated as weighted averages of
the percentage price changes for specified set, or «basket», of
consumer products, the weights reflecting their relative importance in
household consumption in some period. Much depend on how appropriate and timely
the weights are. (ILO 2004:4).
However there is some criticism in calculation of this CPI
whereby the prices collected were not a fair sample of the prices that actually
existed for goods of equal quality. According to the Morgan (1947:29) CPI
neglect to consider the following:
1. Underreporting of prices by stores and large rise in prices
of important goods not included in the index.
2. Disappearance of low grades of goods and deterioration in
the quality of goods priced.
3. Large retail-price increase in smaller cities not covered
by the index
Structure and composition of consumer price index in
Rwanda
According to the National Institute of Statistics of Rwanda
(CPI October 2009), The CPI is a Modified Laspeyres index that covers
household consumption as it is used by national accounts. The reference
population for the CPI consists of all households living in urban areas in
Rwanda.
The household basket includes 1,136 products observed in many
places spread all over the administrative centers of all provinces in Rwanda.
All kinds of places of observation are selected: shops, markets, services, etc.
More than 29,200 prices are collected every month by enumerators of the
National Institute of Statistics of Rwanda and of the National Bank of
Rwanda.
The weights used for the new index (CPI of the Base year of
February 2009) are the result of the Household Living Conditions Survey (EICV
II) conducted in 2005-2006 with a sample of 6,900 households.
The basket used in measuring CPI by NISR is composed by the
following division of commodities:
1. Food and non-alcoholic beverages (Bread and Cereals, Meat,
Fish, Vegetables, Non-alcoholic beverages) 2.Alcoholic beverages and tobacco
3.Clothing and footwear 4.Housing, water, electricity, gas and other fuels
5.Furnishing, household equipment and routine household maintenance 6.Health
7.Transport 8.Communication 9.Recreation and culture 10.Education
11.Restaurants and hotels 12.Miscellaneous goods and services.
2.1.3 Gross Domestic
Product
Gross domestic product (GDP) is the sum of the market values
of all final goods and services produced in a country (that is, domestically)
during a specific period using that country's resources, regardless of the
ownership of the resources (Richard 2004:11).
In other words, GDP refers to the market value of the flow of
final goods and services within the domestic territory of the country during
the period of one year, inclusive of the consumption of fixed capital. Using
the product approach, it is estimated as the sum total value
added by all the producing units within the domestic territory of the country.
In terms of income approach, it is estimated as the sum total
of compensation of employees, operating surplus, mixed incomes of the self
employed, net indirect taxes and consumption of fixed capital. And, in terms of
expenditure approach, it is the sum total of private
consumption, government consumption, gross domestic capital formation and net
exports. (Jain and Khanna 2007: 95).
Gross domestic product comprises Gross domestic product at
factor cost and at market price. In the words of Hanson, «The Gross
domestic product at factor cost is the sum of net value added by all the
producers in the domestic territory of the country and the consumption of fixed
capital in an accounting year». In contrary, according to the Dernburg
«Gross domestic product at market price is defined as the market value of
the output of final goods and services produces in the domestic territory of a
county during an accounting year».
2.1.4 Interest rate
According to the encyclopedia dictionary, an
interest rate is the price
a borrower pays for the use of
money they borrow from another
borrowee, for instance a small company might borrow capital from a bank to buy
new assets for their business, and the return a lender receives for deferring
the use of funds, by lending it to the borrower. Interest rates are fundamental
to a
Capitalist society.
Interest rates are normally expressed as a percentage rate over the period of
one
Gregorian year.
The interest rate changes when money is loaned the lender
delays spending the money on consumption goods. Since according to time
preference theory people prefer goods now to goods later, in a free market
there will be a positive interest rate.
The interest rate comprises the nominal and the real interest
rate, the nominal interest rate refers to the amount, in money terms, of
interest payable as opposed to the real interest rate which measures the
purchasing power of interest receipts, is calculated by adjusting the nominal
rate charged to take
inflation into account.
2.1.5 Money Supply
Money supply or money stock is the total amount of
money available in an
economy at a particular
point in time. There are several ways to define "money", but standard measures
usually include currency in circulation and demand deposits.
Moreover, Economists define money as anything that is
generally accepted in payment for goods and services or in repayment of debts.
Currency, consisting with notes and coins is one of type of money. Define money
as currency is to narrow because checks are also accepted as payment for
purchases, checking account deposits are considered as money. Other deposits
such as savings deposits can in effect function as money if they can be quick
and easily converted into currency or checking account deposits.
There are different measures of money:
1. The narrowest measure of money (M1) in Rwanda includes the
currency in circulation out the banking sector (CC) and checking account
deposit (CD) in other words, narrow money measures cover highly liquid forms of
money (Money as means of exchange).
2. The broad monetary aggregate (M2) in Rwanda adds to M1
savings deposits in Rwf and in foreign currency. It includes the less liquid
forms (Money as a store of value).
2.1.5 Exchange rate
The exchange rate is the price at which one the national money
can be exchanged for another (When transactions are permitted). For example, a
common exchange rate is the Rwandan franc/US dollar exchange rate. If the
RWF/USD exchange is 5.80, this means that 580 Rwandan franc will buy one US
dollar.
The changes in the value of the exchange rate over time are
referred to as appreciations or depreciations. A currency appreciates when its
value rises, relative to another currency, and depreciates when its value
falls, relative to another currency.
2.2 THEORETICAL
FRAMEWORK
A great deal of economic literature concerns the determinants
and causes of inflation, in which inflation's role in the economy has been at
the center of economic studies and has been debated for a long time.
There are three main schools of thought which attempt to
explain the main determinants of inflation. First, The classical which revolved
around the quantity theory of money,
Blinder (2002), a representative of the second school of
thought, the Keynesian economists, states that the main determinants of
inflation are aggregate demand in the economy rather than the money supply.
Thirdly, the monetary approach led by Milton Friedman,
Friedman and Schwartz (1970), who wrote an influential book on the monetary
history of the United States, argue that "inflation is always and everywhere a
monetary phenomenon". Whereas Neo-Keynesians and other critics of monetarism
argue that the demand for money is directly linked to supply and that the
demand for money cannot be predicted. Stiglitz and Greenwald (2003) have
proposed that the relationship between inflation and money supply growth cannot
be separated for ordinary inflation, in contrast to hyperinflation, which is
mostly considered an effect of monetary policy.
A. Classical theory of inflation
The classical economists' view of inflation revolved around
the quantity theory of money, and this theory was in turn derived form the
Fisher Equation of Exchange.
According to Fisher's Formula, we how MV = PQ. Here M
represents that the average number of currency in circulation during a certain
period; V represents the velocity of money circulation; P represents the price
index of goods and services and Q represents transaction volume of goods and
services. Fisher recognized that V and Q are invariable because V is decided by
social system and custom and Q is stable under the condition of sufficient
employment. Therefore, to some extent, the formula means the Quantity Theory of
Money (IBR, 2009:42).
Therefore the come to the conclusion that:
 M M  P P 
In other words, increases in the money supply would lead to
inflation. The message was simple: Control the money supply to control
inflation.
B. Keynesian view of inflation
Keynes didn't agree with the classical economists. In fact the
easiest way to look at Keynesian theory is to see the argument he gave for
Classical theory being wrong. The key to the classical view of inflation was
the Quantity Theory of Money. This theory revolved around the Fisher Equation
of Exchange as we have seen above.
Keynes once again rejected this theory. He argued that
increases in money supply would not inevitably lead to increases in inflation.
Increasing M may instead lead to a decrease in V. in other words the average
speed of circulation of money would fall because there was more of it about.
Alternatively, the increase in M may lead to an increased in T
(Number of transactions), because Keynes disputes the assumption that the
economy will find its own equilibrium. It may be in a position where there is
insufficient demand for full employment and in that case increasing the money
supply will fund extra demand and move the economy closer to full employment.
Keynesians tend to argue that inflation is more likely to be cost-push
inflation or from excess levels of demand. This is usually termed demand-pull
inflation (Robert J. Gordon 1988: )
According to the Keynesians, the natural level of gross
domestic product is a level of GDP where the economy is at its optimal level of
production. If GDP increases beyond its natural level, inflation will
accelerate as suppliers increase their prices. If GDP decreases below its
natural level, inflation will decelerate as suppliers attempt to fill excess
capacity by lowering prices.
Keynes argued that money has no significant relationship with
inflation, but inflation is an outcome of the goods market. He proposed the
"inflationary gap" model to explain the change in price level, (Keynes 1936).
But Pigou (1949) rejected the inflationary gap theory. He placed attributed
inflation to the increase in money income. According to Pigou, inflation exists
when money income increases more than the income earning capacity.
The most popular neo-classical economic critique of Keynesian
economic theory is by Lucas (1976), who argues that rational expectations will
defeat any monetary or fiscal policy. The new Keynesian argument is that this
critique only applies if the economy has a unique equilibrium at full
employment, and that rational expectations models do not produce any simple
result. They claim that because of price stickiness, there are a variety of
possible equilibriums in the short run.
C. Monetarists' theory of inflation
Much of the Monetarists' theory is a development of earlier
Classical
theoretical work. Their main contribution is in updating many of these ideas to
fit them into a more modern context.
Classical economists suggested that V would be
relatively stable and T would (as we have seen above) always tend to
full employment. Friedman developed this and tested it further, coming to the
conclusion that V and T were both independently determined in
the long-run. The conclusion from this was that:
 M M  P P 
If the money supply grew faster than the underlying growth
rate of output there would be inflation. Inflation would be bad for the economy
because of the uncertainty it created. This uncertainty could limit spending
and also limit the level of investment.
Apart from the above schools of thought
which was undertaken to explain the main determinants of inflation, other
theories have been illustrated
Balance of payments and forcing a depreciation of the exchange
rate, The interactions between fiscal policy and inflation are particularly
highlighted in Razin and Sadka (1978:239) and Bruno and Fisher (1990: 353).
This category indicates the change in money supply and real exchange rate as
sources of the inflation
Henry Hazlitt (1978:111) believes that one of the reasons why
inflation is persistently advocated by Keynesians and others is that it is
thought to increase the profitability of business. This is, in fact, an
essential part of the argument of those who believe that inflation tends to
bring full employment. By improving the outlook for profits, it leads
enterprises to start new businesses or to expand old businesses, and therefore
to take on more workers.
2.3 EMPIRICAL FRAMEWORK
Currently, the quantity theory of money is widely accepted as
an accurate model of inflation in the long run. Consequently, there is now
broad agreement among economists that in the long run, the inflation rate is
essentially dependent on the growth rate of money supply. However, in the short
and medium term inflation may be affected by supply and demand pressures in the
economy, and influenced by the relative elasticity of wages, prices and
interest rates (Federal Reserve Board, July 2004)
Sargent and Wallace believe that budget deficit could increase
inflation because of their preponderance in the growth of money supply, point
out that this deficit will become ever larger, because of cumulative of effect
of interest payments (David 1992: 204). This idea is supported by Liviatan and
Piterman (1986: 324) «The most commonly cause of inflation is the
government budgets deficit» according to this explanation, the government
prints money to finance the deficit, and as long as the demand for money is
less that unit elastic, a larger real deficit will result a higher inflation
rate.
The more sophisticated view was expounded by Irving Fisher
(1926:785-792): When the dollar is losing value, or in other words when the
price level is rising, a businessman finds his receipts rising as fast, on the
average, as this general rise of prices, but not his expenses, because his
expenses consist, to a large extent, of things which are contractually fixed. .
. . Employment is then stimulated for a time at least.
Coe and McDermott (1977) in a study of 13 Asian economies,
highlights the fact that: just as in industrialized countries, inflation in
developing countries indicates an overheated economy and is influenced by a
variable of activity. The output gap and a measure of activity level in the
world are the sources that are suggested by this category.
According to Henry Hazlitt (1978:92) for many years it has
been popularly assumed that inflation increases employment. This belief has
rested on both naive and sophisticated grounds. The naive belief goes like
this: When more money is printed, people have more "purchasing power"; they buy
more goods, and employers take on more workers to make more goods.
Another reason of the persistent causes of inflation revealed
by Henry Hazlitt (1978:118) is the perennial demand for cheap money. The
chronic complaint of businessmen, and still more of politicians, is that
interest rates are too high. The popular complaint is directed especially
against the rate for home mortgages.
Chopra (1985:693) expresses the idea that inflation must have
a strong autoregressive component from adjustments in relation to expected
inflation. This category indicates a source of inflation, its own past
achievements.
Empirical results regarding the inflationary effect of
official exchange rate depreciation in cross-country and individual country
studies are also conflicting. For example, Canetti and Greene (1992:37),
studying a number of African countries, report a failure in their attempt to
identify which between exchange rate depreciation and monetary growth is a more
important cause of inflation.
Chhibber and Shaffik (1992:107) do not find a direct
relationship between official exchange rate changes and inflation in Ghana.
According to them, official devaluations had a positive effect on the budget
and were therefore anti inflationary. Their study found that the parallel
market exchange rate had a stronger influence on inflation compared with the
official exchange rate. However, Sowa and Kwakye (1993:50) claim that Chhibber
and Shafik (1992) emphasize monetary factors at the expense of supply factors
in Ghana and conclude that the supply constraint (output) was the main force
behind inflation.
Hyuha (1992:73) found that the devaluations of the official
exchange rate had a push on domestic prices in Uganda. The parallel rate was
also a significant determinant of inflation. Kasekende and Ssemogerere (1994:
62) reached a similar conclusion for the period 1987-1992, using monthly
data.
Ball and Mankiw (1995: 161) examines another source of
inflation, focusing on the supply of goods and services and the «cost
shock» that is to say, the movement of prices specific price level. To
capture the cost shocks, this category indicates changes in the prices index
for petroleum and petroleum product not as source of inflation.
Tsalinski and Kyle (2000: 39) analyzed the determinants of
Bulgarian inflation in the period from 1991 to 2000 using monthly data.
Bulgarian inflation has been shown to have experienced two radically different
regimes over the past decade. The dividing point between the two regimes is the
spring of 1997 when the hyperinflationary trend of the prior period was ended
by the institution of a currency board. They found that inflation during the
previous period had been determined in large part by monetary growth and to
some extent by past inflation. Inflation after the currency board was
established was no longer dependent upon monetary growth.
Ghavam Masoodi and Tashkini (2005:42), to investigate the long
term relationship between the inflation rate and its effective factors in Iran,
they used the ARDL method. The results obtained via this research showed that
GDP, the imported goods price index, liquidity and the exchange rate are the
most significant factors contributing to inflation in Iran.
According to Ferdinand GAKUBA (2009: 30) Inflation is thought
to be an outcome of various economic factors. In Rwanda context he choice the
factors from supply side that come from cost-push or mark up relationships
characterized by unit labor cost , import prices and oil prices index in the
long-run; the demand side factors that may cause the demand pull inflation;
monetary factors; and foreign factors. In order to capture the various
determinants of inflation he has combine the methodology developed in Brouwer
and Neil R. Ericsson (1998) and Juselius (1992) for Australia inflation.
CHAPTER THREE: RESEARCH
METHODOLOGY
The research intends to follow quantitative patterns. For it
to be systematic and intensive process of carrying out data collection, it will
involve some sort of procedures in collecting and analyzing data.
The methodology will follow procedures of quantitative
research because it is based on measurements of quantitative indicators. It is
applicable to the phenomena that can be expressed in terms of quantity that is
easily empirically measured.
3.1 DATA
COLLECTION
3.1.1 Techniques
A technique is defined as all resources and processes that
enable researchers to gather data and information on the research topic (WELMAN
J. C and KRUGER S.J., 2001:34)
Thus, we preferred the documentary techniques which is a
systematic search of all that is written related with the research area such as
books, pamphlets, monographs, unpublished documents, reports, budgets, public
records etc. the documentary technical allows us to choice among the books
available what are useful for our research and help to use the best
resources.
3.1.2 Types and sources of
data
The success of any econometric analysis ultimately depends on
the availability of the appropriate data. It is therefore essential that we
spend some time discussing the nature, sources, and limitations of the data
that one may encounter in empirical analysis.
Time Series Data will be used in our research. A time series
is a set of observations on the values that a variable takes at different
times. Such data may be collected at regular time intervals, such as daily
(example stock prices, weather reports), weekly (money supply figures), monthly
[the unemployment rate, the Consumer Price Index (CPI)], quarterly (GDP),
annually (government budgets), every 5 years (the census of manufactures), or
decennially (the census of population).
Time series data are used heavily in econometric studies but
they present special problems for econometricians; most empirical work based on
time series data assumes that the underlying time series is stationary.
Although it is too early to introduce the precise technical meaning of
stationarity at this juncture, loosely speaking a time series is stationary if
its mean and variance do not vary systematically over time GUJARATI
(2006:26).
Different visits to libraries, internet exploration, and use
of documents provided by National Bank of Rwanda, National Institute of
Statistic of Rwanda, Ministry of finance has been considered useful.
3.2 DATA ANALYSIS
3.2.1 Methods
Method is defined as an ordered set of rules and principles of
intellectual operations to do the analysis to achieve a result (WELMAN J. C and
KRUGER S.J., 2001:36).
At the completion of our work, we have chosen the analytical
method, this method allows to systematically analyzing all information and data
collected. It allowed us to systematically analyze the inflation's relationship
with others macroeconomic variables, to interpret and draw the conclusion.
a. Preparing data for analysis
Data will be entered in the tables where they will be clearly
viewed and checked for errors. After these, they will be entered in the
computer (SPSS software) for analysis.
b. Exploring and presenting data
Once data will have been entered and checked for errors,
analysis will take place .The exploratory data analysis approach for this study
will emphasize the use of diagrams to explore and understand the sense of the
data. During this process, research questions and objectives will be kept in
mind. It will help to formalize the practice of looking for other relationships
in data which have not been thought of initially .So, at this stage, they will
be a request to structure and label clearly each diagram and table to avoid
possible misinterpretation.
c. Analyzing quantitative data
This will involve choosing the appropriate statistics to
describe the data and the choice of the adequate statistics to examine
relationships among data.
At this step, the researcher will be concerned with answering
the question»how do some variables relate to others?» During the
statistical analysis, this question will be answered by testing the likelihood
of the relationship between specific variables. Here, relationships between
Gross domestic product, Money Supply (M2), Interest rate, Exchange
rate and Inflation will be discussed. Testing whether the variables are
significantly associated, the help of a simple regression model does it.
d. The general model of inflation
CPI=f (M2, GDP, LR, ER, ...)
Where
CPI : Consumer Price Index
M2 : Money Supply
GDP : Gross Domestic Product
LR : Lending rate
ER : Exchange rate
Specification of the model
CPI = á M2â
GDPã LRë ERä
ì
The model will be linealized by using logarithmic function.
Hence
Log CPI= log á+ â logM2+ã
log GDP +ë log LR +ä log ER +log ì
Whereby â, ã, ë and ä
are parameters of the model and log ì is the error
terms
e. Describing data using statistics/data
measurements
According to GUJARATI (2006:126) there are two mutually
complementary approaches of hypothesis testing which is concerned with
developing rules or procedures for deciding whether to reject or not reject the
null hypothesis, namely confidence interval and test of significance. Both
these approaches predicate that the variable (statistic or estimator) under
consideration has some probability distribution and that hypothesis testing
involves making statements or assertions about the value(s) of the parameter(s)
of such distribution.
At this step the, T-test (the Student test)
will be used to test the significance of the variables and
F-test (Fischer' test) will be used to test the significance
of the model.
The t-test is probably the most commonly used
Statistical
Data Analysis procedure for hypothesis testing. Actually, there are several
kinds of t-tests, but the most common is the "two-sample t-test" also known as
the "Student's t-test" or the "independent samples t-test".
The statistics t-test allows us to answer this question by
using the t-test statistic to determine a p-value that
indicates how likely we could have gotten these results by chance. By
convention, if there is a less than 5% chance of getting the observed
differences by chance, we reject the null hypothesis and say we found a
statistically significant difference between the two groups.
The p-value is a numerical measure of the statistical
significance of a hypothesis test. It tells us how likely it is that we could
have gotten our sample data even if the null hypothesis is true. By convention,
if the p-value is less than 0.05 (p < 0.05), we conclude that the null
hypothesis can be rejected. In other words, when p < 0.05 we say that the
results are statistically significant.
CHAPTER FOUR: DATA PRESENTATION,
ANALYSIS AND INTERPRETATION
The purpose of this chapter is to present and analyse the
results of the studies conducted on the field. We will first give data
presentation. Then, we will direct the study towards interpretation of result
of SPSS regression analysis.
4.1 DATA PRESENTATION
4.1.1 Table2: EVOLUTION OF CPI,
M2, Real GDP, ER and LR (1990-2009)
|
SN
|
Years
|
Consumer Price Index (CPI)
|
Money Supply (M2)
(In millions Rwf)
|
Real GDP (Base Year: 2000)
(In millions of Rwf)
|
Exchange rate (ER) In US Dollars
|
Lending rate (LR) in %
|
|
01
|
1990
|
19.00
|
31,893.70
|
213,533.0
|
83.70
|
9.96
|
|
02
|
1991
|
22.70
|
33,730.30
|
239,310.0
|
125.16
|
13.65
|
|
03
|
1992
|
24.90
|
37,900.50
|
276,488.0
|
133.94
|
15.00
|
|
04
|
1993
|
28.00
|
37,966.30
|
284,368.0
|
144.24
|
13.61
|
|
05
|
1994
|
55.70
|
32,221.70
|
165,800.0
|
140.70
|
12.88
|
|
06
|
1995
|
55.70
|
62,645.00
|
339,143.0
|
262.18
|
16.07
|
|
07
|
1996
|
59.80
|
69,856.90
|
424,130.0
|
306.82
|
16.17
|
|
08
|
1997
|
67.00
|
90,163.60
|
558,281.0
|
301.53
|
16.22
|
|
09
|
1998
|
71.20
|
91,984.50
|
621,388.0
|
312.31
|
17.13
|
|
10
|
1999
|
69.40
|
98,056.30
|
606,991.0
|
333.94
|
16.84
|
|
11
|
2000
|
72.20
|
111,254.70
|
676,099.0
|
389.70
|
16.99
|
|
12
|
2001
|
74.60
|
121,418.20
|
741,872.0
|
442.99
|
17.29
|
|
13
|
2002
|
76.10
|
144,567.90
|
781,468.0
|
475.37
|
16.37
|
|
14
|
2003
|
81.70
|
167,523.50
|
955,164.0
|
537.66
|
17.05
|
|
15
|
2004
|
91.70
|
187,225.00
|
1,138,470.0
|
557.45
|
16.48
|
|
16
|
2005
|
100.00
|
218,372.30
|
1,332,910.0
|
557.82
|
16.07
|
|
17
|
2006
|
108.90
|
285,646.30
|
1,563,830.0
|
551.71
|
16.07
|
|
18
|
2007
|
118.80
|
375,273.50
|
1,866,120.0
|
546.96
|
16.19
|
|
19
|
2008
|
137.10
|
395,808.80
|
2,063,505.5
|
546.85
|
16.51
|
|
20
|
2009
|
146.60
|
404,365.40
|
2,187,000.0
|
568.00
|
16.49
|
Source: ECONSTATS, NBR, NISR (Annual reports:
2009; 2006; 2003; 2000; 1997; 1995)
4.2 DATA ANALYSIS AND
INTERPRETATION
4.2.1 Correlation between
variables
The correlation coefficient is a number between -1 and +1 that
measures both the strength and direction of the linear relationship between two
variables.
The magnitude of the number represents the strength of the
correlation. A correlation coefficient of zero represents no linear
relationship (the scatter plot does not resemble a straight line at all), while
a correlation coefficient of -1 or +1 means that the relationship is perfectly
linear (all of the dots fall exactly on a straight line).
The sign (+/-) of the correlation coefficient indicates the
direction of the correlation. A positive (+) correlation coefficient means that
as values on one variable increase, values on the other variable tend to also
increase; a negative (-) correlation coefficient means that as values on one
variable increase, values on the other tend to decrease, that is, they tend to
go in opposite directions.
A Scatter plot here was used to determine if there is
correlation between two variables. Moreover they are things to consider when
using scatter plots like that a direct or strong correlation does not
necessarily imply a cause-and-effect relationship. If a scatter plot shows
signs of correlation, investigate further for confirmation.
A. Correlation between Consumer
Price Index and Money Supply (M2)
1. Summary of output from SPSS regression analysis
between CPI and M2
|
Variables
|
Coefficients
|
t
|
P-Value
|
|
Constant
|
-3.119
|
-4.261
|
0.000
|
|
Money Supply (M2)
|
0.629
|
9.930
|
0.000
|
|
R = 0.92 Confidence intervals = 95%
F= 98.605 R Squared =0.846 Model significance = 0.000
|
2. Graph1: Trends in CPI and
M2, 1990-2009
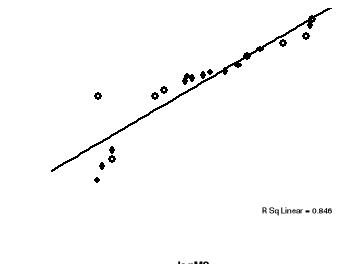
This scatter plot describes a positive trend; there is a weak
positive correlation between CPI and M2. In other words, the value of CPI
increases slightly as the value of M2 increases.
Thus, our regression analysis shows that the volume of money
supply is positively related to the consumer price index; coefficient has a
positive sign and also is statistically significant at 0.001 Since observed
t-value (9.930) lies in the critical region we reject the null hypothesis.
Therefore, we confirm the alternative hypothesis says that Money supply has a
significant positive effect on inflation rate in Rwanda.
It also shows results from an increase of one unit of Money
supply would result to an increase in Consumer price index by 62.9 %.
B. Correlation between Consumer
Price Index and Real Gross Domestic Product
1. Summary of output from SPSS regression analysis
between CPI and GDP
|
Variables
|
Coefficients
|
t
|
P-Value
|
|
Constant
|
-4.678
|
-4.334
|
0.000
|
|
Gross Domestic Product
|
0.661
|
8.203
|
0.000
|
|
R = 0.888 Confidence intervals = 95%
F= 67.335 R Squared = 0.789 Model significance = 0.000
|
2. Graph2: Trends in CPI and GDP,
1990-2009
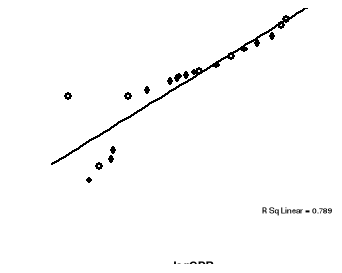
This shows that there is a correlation between GDP and CPI.
This is known as a weak positive correlation as the line goes up meaning that
if the GDP increases, CPI also increases which differs from the output of
regression analysis of the general model as well as the monetarist theory
whereby an increase in GDP should affect a decrease in CPI.
Consider the observed t-value of Real GDP (8.206) shows that
it lies in the critical region or region of rejection of null hypothesis.
Therefore we accept the alternative hypothesis says that Output has a
significant effect on inflation rate in Rwanda. Since an increase of one unit
in output (Real GDP) affect a decrease of 66.1% in Consumer price index
C. Correlation between Consumer Price
Index and Exchange rate
1. Summary of output from SPSS regression analysis
between CPI and ER
|
Variables
|
Coefficients
|
t
|
P-Value
|
|
Constant
|
-1.003
|
-2.229
|
0.039
|
|
Exchange rate
|
0.893
|
11.541
|
0.000
|
|
R = 0.939 Confidence intervals = 95% F=
133.205 R Squared = 0.881 Model significance = 0.000
|
2. Graph3: Trends in CPI and Exchange
rate, 1990-2009
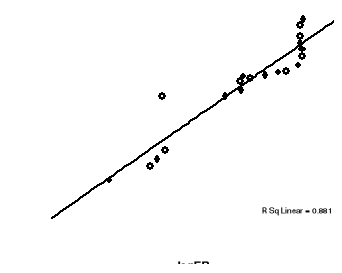
This scatter plot describes weak positive trend between
Exchange rate and CPI, The value of CPI increases slightly as the value of
exchange rate increases. P-value (0.000) is statistical significant, the
t-values of exchange rate (11.541) lies in the critical region. Therefore, we
reject the null hypothesis and confirm the alternative hypothesis says that
exchange rate has a positive effect on inflation rate in Rwanda. In addition
one unitary change in exchange rate affects an increase in consumer price index
by 32.55%
D. Correlation between Consumer Price
Index and Lending rate
1. Summary of output from SPSS regression analysis
between CPI and LR
|
Variables
|
Coefficients
|
t
|
P-Value
|
|
Constant
|
-4.763
|
-2.444
|
0.25
|
|
Lending rate
|
3.255
|
4.586
|
0.000
|
|
R = 0.734 Confidence intervals = 95% F=
21.034 R Squared = 0.539 Model significance = 0.000
|
2. Graph 4: Trends in CPI and Lending
rate, 1990-2009
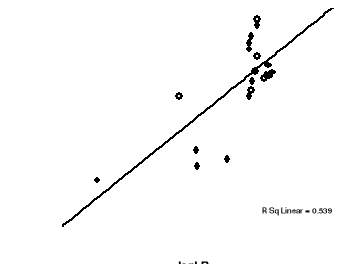
In this graph the plots are not on a completely straight line
but some are near each other and a line tends upward therefore there is a
positive correlation though but not strong. The value of CPI seems to be
related to the value of lending rate, but the relationship is not easily
determined.
Considering the result of the regression analysis, t-values of
lending rate (4.586) lies in the rejection area of null hypothesis and is also
statistical significance as shown by P-value (0.000). As conclusion we accept
the alternative hypothesis says that Lending rate has effect on inflation rate
in Rwanda. Since the change in one unit of lending rate affect an increase by
325.5% in consumer price index.
4.2.2 Regression equation of the model
1. Summary of output from SPSS regression
analysis of multivariate
|
Variables
|
Coefficients
|
t
|
P-Value
|
|
Constant
|
0.430
|
0.267
|
0.793
|
|
Money Supply (M2)
|
1.706
|
3.981
|
0.001
|
|
Real GDP (GDP)
|
-1.476
|
-3.603
|
0.003
|
|
Exchange Rate (ER)
|
0.297
|
1.092
|
0.292
|
|
Lending Rate (LR)
|
0.733
|
1.192
|
0.252
|
|
R = 0.972 Confidence intervals = 95% F=
64.470
R Squared = 0.945 Model significance = 0.000
|
Examining the output from this regression analysis; we look to
the p-value of the F-test to see if the overall model is significant. With a
p-value of zero to three decimal places, the model is statistically
significant. The R-squared is 0.945, meaning that approximately 94.5% of the
variability of CPI is accounted for by the variables in the model. In this
case, the adjusted R-squared indicates that about 94.5% of the variability of
CPI is accounted for by the model; even after taking into account the number of
predictor variables in the model. As explained below, the coefficients for each
of the variables indicates the amount of change one could expect in CPI given a
one-unit change in the value of that variable, given that all other variables
in the model are held constant.
In order to arrive at a more efficient model, variables with
low t-values or incorrect signs in the over-parameterized regression were
excluded.
2.
Specification of general model
CPI = 0.43 M21.706
GDP-1.476 ì
Log CPI= 2.7 +1.706 log M2 +1.476 log GDP+
ì
3. Predictive accuracy of the general model

One way to measure the overall predictive accuracy of a
multiple regression model is the R-square value. The interpretation of R-square
is: "The amount of variance in the dependent variable that can be explained by
the model." For our model the R-square value is 0.945, this means the model
explains 94.5% of the variance and so the model will produce perfect predictive
accuracy. The point is, the closer to 1.0 the R-square value is, the better the
model. The closer the R-square value is to 0, the worse the model.
CHAPTER FIVE: CONCLUSION AND
RECOMMENDATIONS
5.1 CONCLUSION
Historically, a great deal of economic literature was
concerned with the question of what causes inflation and what effect it has,
forecasting inflation is key for a central bank to adjust its monetary policy
to control inflation. Regardless of its monetary policy framework broad money
growth target, exchange rate target, or inflation target, stabilizing inflation
is a primary objective of monetary policy.
The main goal of this work was to determine the factors
influencing inflation rate in Rwanda. To have this goal reached analytical
method was used, this method allows to systematically analyzing all information
and data collected. As far as data analysis is concerned, specific software
designed for data analysis have been used based on the times series data
collected from different government institutions.
From the findings, Money supply and Real GDP (Output) were
found to be important in determining the level of inflation. The effects of the
two variables conformed to our priori assumptions. Other alternative two
hypotheses were also rejected exchange rate and Lending rate that have not
significant effects on inflation rate in Rwanda. There was no evidence
suggesting the influences of exchange rate and lending rate on inflation, as
both t-tests are not statistical significance. This was tested based on SPSS
software attributes in accordance with the theory given in chapters 2 and 3.
These results collaborate studies on inflation in other African economies like
Chhibber and Shafik (1992: 107 - 133) obtain similar results for Ghana and
Samuel A and Ussif (2001:14) for Tanzania.
5.2 RECOMMENDATIONS
Based on the research findings, skills of the researcher and
other constraints accounted, we can conclude this study by giving the following
recommendations for further research.
The outcome of this study does not establish the superiority
of one hypothesis over the other; rather it provides a much boarder perspective
of the complexities of the inflationary process in Rwanda. It also points
towards some of drawbacks of the domestic economic policies as well as the
effects of the external factors influencing the economy which were beyond the
control of the government.
The monetarist assert that inflation everywhere is a monetary
phenomenon and can be controlled by controlling the money supply, thus to
control inflation the government will have to pursue a contractionary monetary
and fiscal policy.
The results indicated that output has a significant effect on
inflation rate in Rwanda. Hence emphasizing in substantial growth in
agriculture sector as well as other economic activities that contribute in
increase of Gross domestic product can help to moderate the rate of
inflation.
Further studies in the areas of domestic supply of agriculture
commodities, imports and exports of agricultural output were suggested in
Rwanda to determine the actual inflationary movements and pertinent policy
implications.
BIBLIOGRAPHY
BOOKS
Damodar N. GUJARATI (2004) «Basic
Econometrics, 4th Edition, McGraw-Hill/ Irwin. Hardcover.
David GOWLAND (1982) «Controlling the money
supply» British Library, Great Britain.
Friedman, M. and Schwartz, A. J. (1970) Monetary
Statistics in the U.S. Estimates, Sources, Method. New York: National
Bureau of Economic Research (NBER).
Henry HAZLITT «The inflation crisis and how to
resolve it,» Arlington house, New Rochelle, New York.
Irving FISHER, "A Statistical Relation between
Unemployment and Price Changes," International Labor Review, June
1926, pp. 785-92.
KUMAR (First Edition 1993), «An exposition to
economics» Mittal Publication, New Delhi, INDIA.
KUMAR and MITTAL (First Edition 2002), «Monetary
Economics» Anmol publications P.V.T. LTD, New Delhi.
Liviatan N. and Piterman S. (1986), «Accelerating
Inflation and Balance of Payments Crises, 1973--1984,» in The
Israeli Economy, ed. By Yoram Ben-Porath (Cambridge: Harvard University Press),
pp. 320-46.
Musoni J. RUTAYISIRE (2009) «Economic
Liberalization, Monetary Policy and Money Demand in Rwanda:
1980-2005»
Richard YAMARONE (2004) «The trader's guide to
key economic indicators» Library of congress,
Robert J. GORDON (1988), «Macroeconomics: Theory
and Policy», 2nd ed., Chap. 22.4, 'Modern theories of inflation'.
McGraw-Hill.
Stiglitz, J. and Greenwald, B. (2003) Towards A New
Paradigm in Monetary Economics: Cambridge University Press.
Tsalinski, T. and Kyle, S. (2000) «Determinants
of Inflation in the Bulgarian Economy». Cambridge: Harvard
Institute for International Development.
Welman J. C and Kruger S.J.(2001) : «Research
methodology course for the business and administrative sceines» ,
2nd edition , Paris, Durod , page 34-36.
JOURNALS
Agenor, P. and P. MONTIEL. 1996. «Development
Macroeconomics. Princeton»: Princeton University Press.
Ball, L. and Mankiw G. (1995), «Relative Price
Changes as Aggregate Supply Shocks» Quarterly Journal of
Economics, pp: 161-194, February 1995.
Bruno M. and Fischer S. (1990), «Seignorage,
Operating Rules and the High Inflation Trap» Quarterly Journal of
Economies, y. 105 (May), pp: 353-74.
Canetti E. and J. Greene. 1992. «Monetary growth
and exchange rate depreciation as causes of inflation in African countries: An
empirical analysis». Journal of African Finance and Development,
Spring: 36-61.
Chhibber, A. and N. Shafik (1992), «Devaluation
and Inflation with Parallel Markets: An Application to Ghana», Journal of
African finance and Economic Development, Spring, Vol. 1, No. 1, pp.
107 - 133.
Chopra A. (1985), «The Speed of Adjustment of the
Inflation Rate in Developing Countries: A Study of Inertia.» IMF
Staff Papers, Vol. 32, No. 4 (December), pp: 693-733.
Coe, David T. and McDermott J. (1997), «Does the
Gap Model Work in Asia?» IMF Staff Papers, Vol. 44 No.
1, March 1997.
Ghavam MASOODI, Z. and Tashkini, A., (2005). «The
Empirical Analysis of Inflation in Iran» Quarterly Business
Research Letter.No.(36). 75-105.
Hyuha, M. 1992. «Reflections on forex bureau/
parallel and official foreign exchange rates and inflation in
Uganda». Paper presented at the 2nd Conference of the Eastern and
Southern African Economic Association, Dar es Salaam, December.
Jain and Khanna (2007) «Economic concepts and
Methods» V.K (India) Enterprises.
Kasekende, L. and G. SSEMOGERERE. 1994. «Exchange
rate unification and economic development: The case of Uganda,
1987-92». World Development, 22 (8): 1183-98
Keynes, John M., (1936) «The General Theory of
Employment, Interest, and Money.» Macmillan, London.
Lucas, R. (1976) «Macroeconomic policy
Evaluation»: A Critique, in the Phillips Curve and Labor markets.
Paper presented at the Carnegie-Rochester Conference Series on Public Policy,
Amsterdam: North Holland.
Razin A. and Sadka E. (1987), «Economic Policy in
Theory and Practice.» New York: St. Martin's Press.
Rebelo, S. and C.A. Vegh. 1995. «Real effects of
exchange-rate-based stabilisation: An analysis of competing
theories». Discussion Paper No. 1220, London: Centre for Economic
Policy Research.
Samuel A. LARYEA and Ussif Rashid SUMAILA (2001)
«Determinants of inflation in Tanzania» CMI Working
Papers.
Sowa, N.K. and J.K. KWAKYE. 1993. «Inflationary
Trends and Control in Ghana». Research Paper No. 22. African
Economic Research Consortium, Nairobi.
REPORTS
Annual Reports of National Bank of Rwanda
Annual Reports of National Institute of Statistics of
Rwanda
Development, spring, Vol. 1, No. 1, pp. 107 - 133
European Central Bank, Price stability: why is it important for you? Euro
System, Frankfurt am Main, April 2009 .
Federal Reserve Board's semiannual Monetary Policy Report to
the Congress Round table; introductory statement by Jean-Claude Trichet on July
1, 2004
International Monetary Fund, World Economic Outlook, 1999
NISR Report, March 2010 UPDATING AND REVISING THE CONSUMER
PRICE INDEX
International Business Research, an Empirical Study of Chinese
Inflation Time Lag, Vol 2 no 1, January 2009.
ELECTRONIC REFERENCES
http://en.wikipedia.org/wiki/Inflation
visited on July 10th, 2010
http://www.bnr.rw/publications.aspx visited on August
5th, 2010
http://www.econstats.com/weo/CRWA.htm
visited on August 10th, 2010
http://www.statisticallysignificantconsulting.com
visited on August 10th, 2010
http://www.econlib.org/library/Enc/KeynesianEconomics.html
visited on August 5th, 2010
http://statistics.gov.rw/index.php?option=com_content&task=view&id=261&Itemid=308
visited on July 5th, 2010
APPENDIXES
Appendix 1: Regression analysis of consumer price index and
money supply

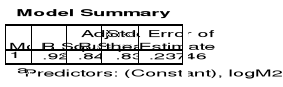

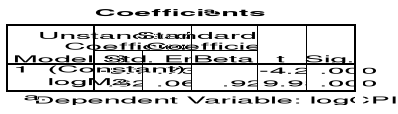
Appendix 2: Regression analysis of consumer price index and
Gross domestic product
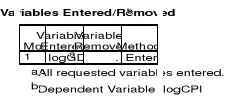
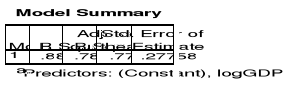
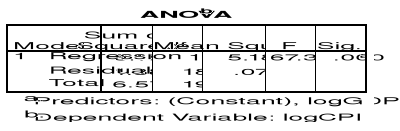
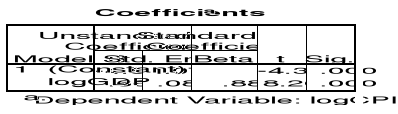
Appendix 3: Regression analysis of consumer price index and
Exchange Rate
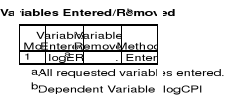

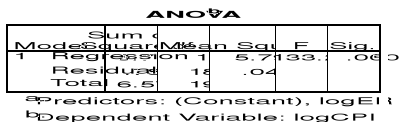

Appendix 4: Regression analysis of consumer price index and
Lending Rate
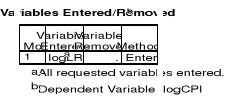
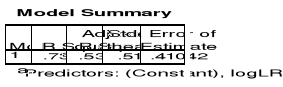
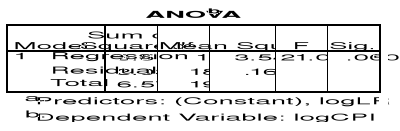
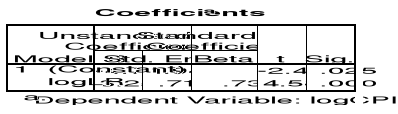
Appendix 5: SPSS Result of Regression Analysis
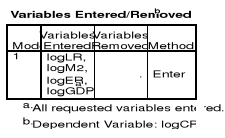
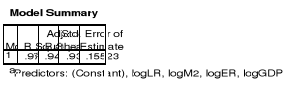
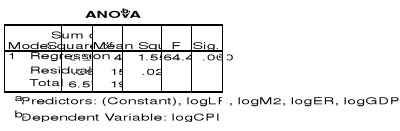
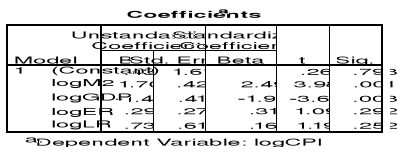
Appendix 6: T-Table
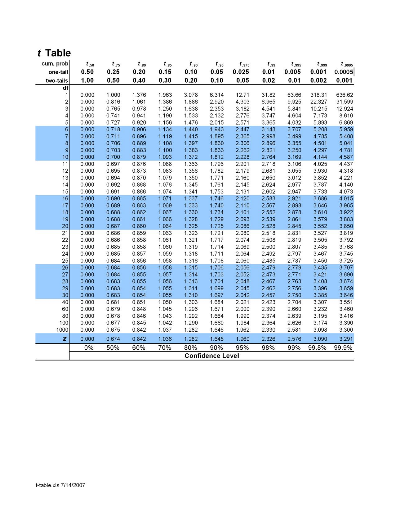
| 

