2.1.6 Economic situation
Rwanda's economy is agrarian. Agriculture
employs almost 80 percent of the population, accounting for
more than 40 percent of gross domestic product (GDP)
and more than 70 percent of exports. Subsistence food production is the
dominant activity in the agriculture sector. Production of coffee and
tea for export is still modest.
The service sector contributes approximately 39 percent of GDP
and employs roughly 6.5 percent of the working population. The percentage
of Rwandans living in poverty has decreased from 60.4 percent in
2000-2001 to 56.9 percent in 2005-2006.
(National Institute of Statistics Rwanda, `Preliminary
Poverty Update Report, Integrated Living Conditions Survey
2005/06' December 2006.)
Rwanda's economic growth was rapid in the years following the
genocide, largely due to determined economic policy, the `catch-up' effect (due
to starting from a very low baseline in 1994) and relatively high aid flows.
Economic growth has been more modest in recent years. For 2007,
the GoR forecast for GDP growth is 6.0 percent
Rwanda embarked on a continuous, aggressive, ambitious agenda
of political, financial and economic reforms to establish an attractive
environment for both domestic and foreign investments. Rwanda has continuously
improved its policy and institutional reforms towards poverty reduction.
It is evident that Rwanda is an example of success stories in
post-conflict reconstruction (Bigsten and Isaksson, 2008). Rwanda has made
progress in fighting corruption and promoting gender equality, as well as
creating a soft business environment. It is one of the most improved countries
in the world in the annual Doing Business Index, thus attracting both private
and foreign direct investments.
Rwanda's economy has demonstrated a strong recovery from the
global recession. Real GDP growth edged up to 7.5% in 2010 from 4.1% in 2009
due to expansion in government spending, robust growth in services
(primarily telecom and financial services) and recovery in tourism. The
large fiscal stimulus and expansionary monetary policy implemented in 2010
bolstered the recovery. Key growth drivers in the short and medium term
include expansion in services sector, increased productivity in the agriculture
sector, and increased public and private investment (AfDB, Research Department
using data from WEF, 2010).
The services sector accounts for the largest share of GDP at
47% and its share has continued to grow during the period 1995-2010 while
shares for industry and agriculture have been declining. Growth in services
has been fuelled by expansion in trade, transport, telecommunications, finance
and insurance (Human Development Report, 1999).
GoR's responses include a Crop
Intensification Program (CIP) implemented since 2008 and focusing on several
priorities including land use consolidation; Fertilizer and seed
distribution; and post-harvest activities and marketing and a Strategic
Plan for the Transformation of Agriculture, Phase II (2009-12).
As a result, food production has increased and this has
shielded Rwanda from the on-going food crisis in the Horn of Africa.
According to Macroeconomic framework and strategy for the
period 1999-2002, the main elements of the medium-term macroeconomic
program are:
(i) To achieve annual average real GDP growth rate of
5-6 percent a year;
(ii) To keep inflation at below 5 percent a year;
(iii) To maintain the external current account deficit
(excluding official transfers) at about 17 percent of GDP and the level of
gross official reserves at a level of at least four months of imports,
whereas the high growth rate in real GDP in 1995-98 was achieved by bringing
existing capacity back into use, hence forth, sustained growth at the targeted
rate would require a significant increase in investment, from
15½ percent of GDP in 1998-99 to 19½ percent in 2001-2002
(African Economic Outlook,2010).
With government investment projected at about 9 percent
of GDP, an increase in private investment from 8½ percent of GDP in
1998-99 to more than 10 percent in 2001-2002 would be needed, as well as
similar increase in private savings. Increases in investment and savings levels
will depend on continued progress in restoring confidence in the economy,
which, in turn, depends on the progress in national reconciliation, domestic
and regional security, and structural reforms. Significant foreign aid,
including assistance to reduce the external debt burden, will remain essential
to enable Rwanda to achieve high and sustainable growth.
2.1.6.1 Consumer Price Index
International Labour Office (ILO) defined consumer prices
index (CPI) as index numbers that measure changes in the prices of goods and
services purchased or otherwise acquired by households, which households use
directly, or indirectly, to satisfy their own needs and wants.
According to the National Institute of Statistic of Rwanda,
The CPI is a measure of the average change over time in the prices of consumer
items goods and services that people buy for day-to-day living. The CPI is a
complex construct that combines economic theory with sampling and other
statistical techniques and uses data collected each month to produce a timely
measure of average price change for the consumption sector of the Rwandan
economy (NISR: March 2010)
The CPI can be intended to measure either the rate of price
inflation as perceived by households, or changes in their cost of living (that
is, change in the amounts that the households need to spend in order to
maintain their standard of living).
In practice, most CPI are calculated as weighted averages of
the percentage price changes for specified set, or «basket», of
consumer products, the weights reflecting their relative importance in
household consumption in some period. Much depend on how appropriate and timely
the weights are. (ILO 2004:4).
However there is some criticism in calculation of this CPI
whereby the prices collected were not a fair sample of the prices that actually
existed for goods of equal quality.
According to the Morgan (1947:29) CPI neglect to consider the
following:
1. Underreporting of prices by stores and large rise in prices
of important goods not included in the index.
2. Disappearance of low grades of goods and deterioration in
the quality of goods priced.
3. Large retail-price increase in smaller cities not covered
by the index
According to the National Institute of Statistics of Rwanda
(CPI October 2009), The CPI is a Modified Laspeyres index that covers household
consumption as it is used by national accounts. The reference population for
the CPI consists of all households living in urban areas in Rwanda.
The household basket includes 1,136 products observed in many
places spread all over the administrative centers of all provinces in Rwanda.
All kinds of places of observation are selected: shops, markets, services, etc.
More than 29,200 prices are collected every month by enumerators of the
National Institute of Statistics of Rwanda and of the National Bank of
Rwanda.
The weights used for the new index (CPI of the Base year of
February 2009) are the result of the Household Living Conditions Survey (EICV
II) conducted in 2005-2006 with a sample of 6,900 households.
The basket used in measuring CPI by NISR is composed by the
following division of commodities:
1. Food and non-alcoholic beverages (Bread and Cereals, Meat,
Fish, Vegetables, Non-alcoholic beverages)
2. Alcoholic beverages and tobacco
3. Clothing and footwear
4. Housing, water, electricity, gas and other fuels
5. Furnishing, household equipment and routine household
maintenance
6. Health
7. Transport
8. Communication
9. Recreation and culture
10. Education
11. Restaurants and hotels
12. Miscellaneous goods and services.
Rwanda has implemented an expansionary monetary policy
stance aimed at reversing the domestic liquidity crisis that
started in 2008 and to accelerate the rebound in
growth. However, structural rigidities and low financial
sector depth impeded the fiscal stimulus effects. Successful
implementation of CIP contributed to a reduction in inflation
from 2011 10.3% in 2009 to 2.3% in 2010 However, since Rwanda remains a
net food importer and given the large import share of energy products (19.5% in
2010), inflation is projected to edge upwards to 3.9% in 2011 due to the rising
global food and fuel prices.
CPI from 2003 up to 2010 can be schematized by the following
figure:
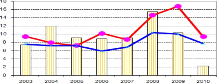
Figure 2: Consumer Price
Index
Source: AfDB Statistics Department, African Economic Outlook
April 2010
| 

