4.2 Impact of
monetary policy on Consumer Price Index (CPI)
In this study, we have used variables like Money supply,
Nominal interest rate and the nominal exchange rate in order to measure the
impact of monetary policy on Consumer Price Index (CPI). The monetary policy
affects an economy by causing inflation which discourages production in the
country. But before that, it is better to analyze the evolution of those
variables in Rwanda such as: Consumer Price Index, Money supply, Nominal
interest rate and the nominal exchange rate.
4.2.1 Evolution of CPI, money supply,
Nominal interest rate and nominal exchange rate in Rwanda
This part of the study analyzes trends of different variables
that are used in the following part of the study:
Table 1: Consumer price
index (CPI) in Rwanda
|
|
|
1985
|
11.00181
|
|
1986
|
10.87891
|
|
1987
|
11.32854
|
|
1988
|
11.66598
|
|
1989
|
11.78383
|
|
1990
|
12.27708
|
|
1991
|
14.68795
|
|
1992
|
16.09218
|
|
1993
|
18.08027
|
|
1994
|
35.96796
|
|
1995
|
38.63368
|
|
1996
|
43.27568
|
|
1997
|
45.96313
|
|
1998
|
44.85729
|
|
1999
|
46.60651
|
|
2000
|
48.1645
|
|
2001
|
49.12422
|
|
2002
|
52.78382
|
|
2003
|
59.25022
|
|
2004
|
64.59108
|
|
2005
|
70.3286
|
|
2006
|
76.71494
|
|
2007
|
88.56351
|
|
2008
|
97.74297
|
|
2009
|
100
|
|
2010
|
105.6707
|
Figure 4: Consumer Price
Index (CPI) in Rwanda
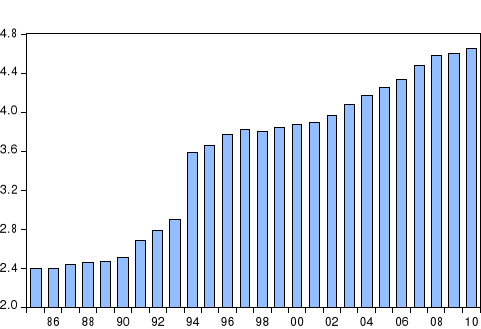
Source: Eviews7
As it can be seen, from 1985 to 2010, the CPI of Rwanda was
generally increasing. This increase in is due to different causes which may be
internal and external. The continual increase in prices discourages production
of a given country. Normally, other things being equal, increases in domestic
price discourage production while decreases in price encourage production.
Table 2: Money Supply in
Rwanda
|
M2
|
|
1985
|
2.33E+10
|
|
1986
|
2.65E+10
|
|
1987
|
2.92E+10
|
|
1988
|
3.14E+10
|
|
1989
|
3.01E+10
|
|
1990
|
3.17E+10
|
|
1991
|
3.35E+10
|
|
1992
|
3.77E+10
|
|
1993
|
3.86E+10
|
|
1994
|
3.72E+10
|
|
1995
|
6.3E+10
|
|
1996
|
6.85E+10
|
|
1997
|
8.84E+10
|
|
1998
|
9.15E+10
|
|
1999
|
9.87E+10
|
|
2000
|
1.14E+11
|
|
2001
|
1.27E+11
|
|
2002
|
1.43E+11
|
|
2003
|
1.65E+11
|
|
2004
|
2.15E+11
|
|
2005
|
2.53E+11
|
|
2006
|
320972.6
|
|
2007
|
425211.5
|
|
2008
|
466146.4
|
|
2009
|
491194.6
|
|
2010
|
617709.7
|
Figure 5: Money Supply in
Rwanda
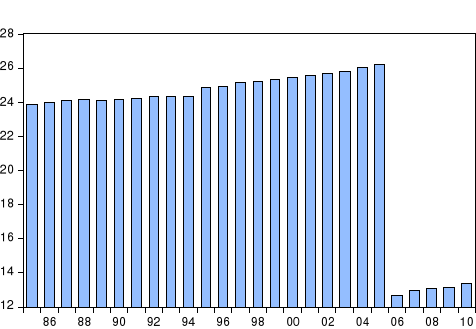
Source: Eviews7
As it can be seen from the figure above, from 1985 up to 2005,
the money supply was increasing but not significantly, but it decreased
considerably in 2006, however, from that year, the money supply started
increasing again. Normally, as it is known that, much money in circulation is
most of the time associated with inflation but also; little money in
circulation can be associated with problem. The central bank of Rwanda must
have strong reasons of reducing money in such a way, may be because of
inflation which was increasing significantly as seen in figure above.
Table 3: Nominal Interest
Rate in Rwanda
|
NIR
|
|
1985
|
13.875
|
|
1986
|
14
|
|
1987
|
13
|
|
1988
|
12
|
|
1989
|
12
|
|
1990
|
13.16667
|
|
1991
|
19
|
|
1992
|
16.66667
|
|
1993
|
15
|
|
1994
|
16.77
|
|
1995
|
16.77
|
|
1996
|
18.54
|
|
1997
|
16.22
|
|
1998
|
17.13
|
|
1999
|
16.84
|
|
2000
|
16.99
|
|
2001
|
17.29
|
|
2002
|
16.37
|
|
2003
|
17.05
|
|
2004
|
16.48
|
|
2005
|
16.08
|
|
2006
|
16.07
|
|
2007
|
16.11
|
|
2008
|
16.51
|
|
2009
|
16.09
|
|
2010
|
16.67
|
Figure 6: Nominal Interest
Rate in Rwanda
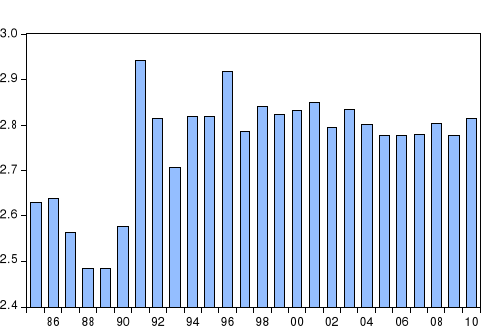
Source: Eviews7
From 1986 to 1989, the Nominal interest rate was decreasing.
From 1989 up to 1991, it was increasing but it decreased gradually until 1993.
From 1995, the nominal interest rate was also increasing until
1996 and after that year, the interest rate in Rwanda almost stabilized in many
years.
Normally, the high nominal interest rate is a sign of refusal
by commercial banks to offer credits to borrower, most of the time, that
results from the discount rate charged by the central bank to commercial banks.
That desire is always associated by a desire of the central bank to reduce
money in circulation and stabilize economy in order to avoid inflation. The
low nominal interest rate is a sign that commercial banks are giving loans to
those who need them and event is associated by the central bank which reduces
the discount rate charged to commercial banks in order to increase money in
circulation with a desire of stimulating production.
Table 4: Nominal Exchange
Rate in Rwanda
|
EXCH
|
|
1985
|
101.2447
|
|
1986
|
87.59092
|
|
1987
|
79.46065
|
|
1988
|
76.44774
|
|
1989
|
80.14898
|
|
1990
|
83.7041
|
|
1991
|
125.1642
|
|
1992
|
133.9386
|
|
1993
|
144.237
|
|
1994
|
140.7038
|
|
1995
|
262.1823
|
|
1996
|
306.82
|
|
1997
|
301.5298
|
|
1998
|
312.3141
|
|
1999
|
333.9419
|
|
2000
|
389.6962
|
|
2001
|
442.9919
|
|
2002
|
475.3652
|
|
2003
|
537.655
|
|
2004
|
577.449
|
|
2005
|
557.8226
|
|
2006
|
551.7103
|
|
2007
|
546.955
|
|
2008
|
546.8487
|
|
2009
|
568.2813
|
|
2010
|
583.1309
|
Figure 7: Nominal
Exchange Rate in Rwanda
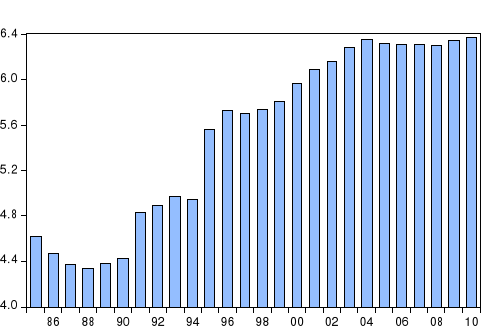
Source: Eviews7
From 1985, the Rwandan currency was being appreciated, but
from 1988, it started depreciating in general and it became almost stable from
2005 up to 2007. From 2008, the Rwandan currency was generally
depreciating.
| 

