|
INTERACTION OF QUINOLINES AND ARTEMISININ
BASED
ANTIMALARIAL DRUGS WITH FERRIPROTOPORPHYRIN
IX
Mavakala kiazolua Bienvenu
Abstract
Malaria is a major health problem in many countries and
according to an estimate of the WHO, more than 500 million infections occur per
year. Actually, all over the world, malaria is killing one people after 30
seconds. Because of multidrug resistance of Plasmodium falciparum to current
quinoline based drugs, antimalarial drugs are investigated to understand their
mode of action and to provide a ratioanal basis to design new drugs.
Artemisinin, a sesquiterpene obtained from Chinese herbal drug «qinghaosu
«has received considerable as a promising and potent antimalarial in terms
of efficacy and cost.
It has been established that hemin is primarily involved in
the antimalarial activity of antimalarias. Thus, the interaction of these drugs
with hemin may represent a crucial screening test to define their efficacy. In
this study, the interaction of hemin with chloroquine, quinine and quinidine in
50% water-propylene glycol at pH 9, 8.1, 7.4, and 6.8 using using a
spectrophotometric method. In addition, the results indicated that hemin
complexed more strongly with quinidine than with chloroquine and quinine and
the binding constants were pH-dependent. Moreover, it was proved that the
water-propylene glycol mixture is well suitable to the study of the systems
containing hemin and quinoline-based drugs.
Artemisinin and derivates were investigated by UV-Visible
at pH 9 and 7.4 and by HPLC/DAD/MS analysis for their reactivity with hemin. It
has been showed that artesunate and dihydroartemisinin interacted more strongly
with Fe (III) PPIX that artemisinin did. Aqueous DMSO solution is well suitable
studying hemin-artemisnin interaction. Both quinoline and artemisinin drugs-
hemin complexes exhibited 1:1 stoechiometry.
The reported results showed too that hemin and endoperoxide
lactone derived antimalarials slowly react to give rise to several
stereoisomers supramolecular adducts (three for artesunate, seven for
artemisinin and eight isomers for dihydroartemisinin) while in contrast, it has
been reported that only heme (FeII) did react with artesiminin based
drugs.
CONTENTS
CHAPTER 1 INTRODUCTION
CHAPTER 2 LITERATURE SURVEY
2.1 Biology of the malaria parasite
2.1.1 Life cycle of malaria parasite
2.1.2 Hemozoin formation by malaria
parasite
2.2 Some proposed mechanisms of action of
antimalarials drugs
2.2. 1 Mechanism of action of chloroquine
and related antimalarials
2.2 1.1 Extravacuolar mechanisms
2.2.1.2 Intravacuolar mechanisms:
2.2.2 Mechanism of action of artemisinin
and its derivatives
2.3 Mechanism of resistance of parasite to current
drugs
2.4 New strategy in the war against malaria
2.4.1 Discovering Antimalarials: New drug
targets
2.4.2 New generation of antimalarial
drugs: trioxaquines
2.4.3 Vaccine
2.4.4 Genetic approaches
CHAPTER 3 EXPERIMENTAL MATERIALS AND
METHODS
3.1 Materials
3.1.1Property of Chemicals
3.1.2 Apparatus
3.1.3 Physical chemical properties of used solvents
3.2 Preparation of solutions
3.2.1 Test of solubility of drugs and hemin in some usual
solvents
3.2.2 Buffer solutions
3.2.3 Water- DMSO mixture
3.2.4 Water-propylene glycol mixture
3.2.5 Hemin solutions
3.2.6 Quinolines solutions
3.2.7 Artemisinin solutions
3.3 Methods
3.3.1
Ultraviolet/visible molecular spectroscopy
3.3.1.1. General principle
3.3.1.2
Procedural details of hemin-drugs spectrophotometry titrations.
3.3.2 Chromatography method
3.3.2.1 General description of
chromatography
3.3.2.2 Introduction to HPLC/MS
technique
3.3.2.3 HPLC/MS experiments of
hemin-artemisinin compounds interaction
3.4 Data analysis
CHAPTER 4 RESULTS AND
DISCUSSION
4. 1 Choice of the medium
4. 2 Choice of buffers
4.3 Binding reaction of hemin with chloroquine,
quinine and quinidine in water-propylene glycol mixture
4.4 Binding reaction of hemin with artemisinin
compounds
4.4.1 Binding reaction of hemin with
artemisinin, artesunate and dihydroartemisinin in water-DMSO mixture
4.4.2 Binding reaction of hemin with
artesunate in water-propylene glycol mixture
4.4.2 HPLC/MS analysis of hemin-artemisinin based drugs
interaction
CHAPTER 5 CONCLUSIONS
Acknowledgements
References
Appendixes
Publications
Chapter 1 Introduction
More than 40% of the world's population live in areas where
malaria is endemic and each year 300-400 millions cases of infections are
recorded. Actually, all over the world, malaria is killing one people after 30
seconds. In Africa, official estimations of annual mortality indicate that 1-3
millions cases of death are due to malaria. Most of the victims are children
under 5 years of age (Hoffman, 1996; World Health Organization, 2002).
Surprisingly, the tropical African region where malaria is the major cause of
death coincides closely with the areas where the sickle-cell disease is
prevalent, which is a genetic disorder characterized by mutation of glutamic
acid to valine residue in position 6 of the -chain of hemoglobin. Generally,
people with sickle-cell gene are resistant to malaria (Voet and Voet, 1995).
Malaria, tuberculosis, AIDS, and malnutrition remain the important health
problems of the developing countries and contributing significantly to their
poverty.
With fast spreading multidrug resistance to commonly used
quinoline-based antimalarial drugs (alkaloidal drugs), especially chloroquine
by Plasmodium falciparum (human malaria parasite) (Wyler, 1983; Hien
and White, 1993; Berman and Adams, 1997), antimalarial drugs are intensively
investigated to understand their mode of action and the factors responsible of
the resistance. A better understanding of the mode of action may provide a
rational basis to improve the antimalarial activity of the existing drugs and
to design new drugs like artemisinin derivatives, trioxaquines (China
Cooperative Research Group on Qinghaosu and Its Derivatives as Antimalarials,
1982; Klayman, 1985; Krogstad et al., 1985; Jiang et al., 1995; Dechy et al.,
2002; Gong et al., 2001; Dechy et al., 2003; Cointeaux et al., 2003).
Historically, since 1940, chloroquine was the most effective
drug for treatment and prophylaxis because of its strong therapeutic activity,
low toxicity and low cost. A perfect substitute for chloroquine should exhibit
the qualities of chloroquine, and if possible, be even better. Among the few
new drugs against malaria, the promising, from considerations of potency, low
toxicity, resistance, cost, rapidity of action and first order
pharmacokinetics, is artemisinin (Artemisia annua), a non-alkaloidal
drug from an ancient Chinese herbal drug Qinghao (sweet wormwood).
Artemisinin is a saturated endoperoxide lactone molecule and has been used by
the Chinese for 2 milleniums as a folk remedy against fever. Lack of chemical
resemblance to the quinoline antimalarial might have been the reason of the
success of this drug and its congeners including dihydroartemisinin,
artesunate, artemether and arteether in treatment of multidrug resistant
malaria (Meshnick, 2002). Unfortunately, though more than hundred years have
elapsed since the discovery of malaria parasite and its transmission, detailed
biochemistry of Plasmodia remains poorly understood (Trigg and Kondrachine,
1998). Despite the proven efficacy of artemisinin against severe malaria, the
precise mode of action of it and its derivatives, as well as those quinoline
drugs, remains uncertain. Frequently, controversial discussions in the
literature are seen (Homewood et al., 1972; Chou et al., 1980; Yayon et al.;
1985; Constantinidis and Satterlee, 1988; Egan et al., 1996;
Robert
et al., 1997; Cazelles, 2001). The mechanism of action of any drug is
important in drug development. Generally, the drug compound binds with a
specific target, a receptor to mediate its effects. Strong drug-receptor
interactions are required for high drug activity. The most interesting and
developed theory suggests the binding of intraparasitic heme or hemin (ferro-
or ferriprotoporphyrin IX) with these drugs as the prerequisite for their
antimalarial action, leading to the formation of a complex, which is probably
toxic to the parasite (Chou et al., 1980; Yayon et al., 1985; Egan et al.,
1996; Meshnick et al., 1996; Berman and Adams, 1997; Chen et al., 2001; Robert
et al., 2002). It has been established that hemin is present in high amounts in
malaria parasites as a result of hemoglobin digestion (Sherman, 1984). From
this, hemin is thought of as having critical role in the mechanism of action of
artemisinin and its derivatives.
Several approaches can be undertaken to study the interaction
of antimalarial drugs with hemin, including thermodynamic and theoretical
studies of the binding process. Chou et al. investigated the interaction
between hemin and quinoline drug in aqueous medium. This medium, however,
presents some limitations in regard to the solubility of the reacting partners.
Hemin is soluble in alkaline aqueous solution, whereas quinoline compounds are
soluble in acidic aqueous solution. As reported (
Yang
et al., 1998; Bilia et al., 2002; Kannan et al., 2002), artemisinin compounds are insoluble in aqueous
solutions but they are soluble in ethanol, in dimethyl sulfoxide (DMSO),
methanol, acetone, and dimethylacetamide mediums.
A stable state of hemin in neutral or weakly acid aqueous
solution cannot be achieved because of its tendency to dimerize. Studies of
hemin-antimalarial drugs interactions under these conditions render results
unreliable and difficult to interpret. As a result, nonconsistent
stoichiometries of hemin-quinoline complexes in aqueous solution, such as 2:1,
4:1, and 7:1 complex were reported (Moreau et al., 1982; Dorn
et al., 1998; Egan et al., 2000). Therefore, it is important to take into
account both the influence of hemin dimerization and the prerequisite that
reacting partners must be soluble in the medium when studying hemin-drug
interactions. According to literatures, two methods can be used to circumvent
this problem. One is to use nonaqueous, mixed solvent, or detergent solutions.
The other is to use heme-peptides or iron porphyrins, which exhibit a lower
tendency to aggregate, to model the behaviour of hemin (Marques et al., 1996).
Several studies on the interaction with antimalarial drugs have been performed
using the latter strategy. Constantinides and Satterlee have investigated the
bonding of quinine and chloroquine to Fe(III)uro-porphyrin and 1 :2
stoichiometry (drug :hemin) was reported (Constantinidis and Satterlee,
1988), in contrast the bonding of heme-peptide N-acetylmicroperoxidase-8
(N-AcMP-8) with quinine and 9-epiquine exhibited 1:1 complexation and 2:1
stoichiometry with chloroquine. These conflicting results suggest the
importance of performing studies with hemin itself, while at the same time
taking care to ensure that it is maintained in a strictly monomeric state.
Unfortunately, quantitative data in mixed solvent systems
using hemin, are lacking. Effort has been made to solve the problem by using
40% aqueous DMSO to study the complexes between several quinoline antimalarials
and monomeric hemin and 1:1 stoichiometry was proposed (Egan et al., 2002).
In our previous studies, the interactions of hemin with
chloroquine and quinine and that of deuterohemin (hemin without vinyl groups)
with quinine were investigated in 50% water-ethyleneglycol mixture (Gushimana
et al., 1993; Gushimana et al., 1996).
In this medium, which is thermodynamically close to
water, (Gushimana et al., 1993) the dimerization process of
hemin could be well controlled. A good correlation between thermodynamic and
kinetic data had been determined, leading to the conclusion of a 1:1
stoichiometry of the complex. Although this complex can be used for
parasitologic assays in vitro, ethylene glycol is toxic (Haley and Berndt,
1987). It is thus important to separate the complex from the solvent
before it is used for parasitologic assays in vivo. Another way to solve the
problem is to find an alternative medium, which presents the same thermodynamic
advantage as ethylene glycol-water mixture and, at the same time, is
nontoxic.
Morever, the interactions of hemin with artemisinin compounds
were qualitatively investigated in the past using mediums such as
water-acetonitrile, -dimethyl sulfoxide, -ethanol mixtures and
dimethylacetamide medium. It was found that artemisinin reacted with heme
(FeII) but do not react directly with metal (III) porphyrins like
hemin (FeIII) or (MnIII) tetraphenylporphyrin (Berman and
Adams, 1997; Cazelles et al., 2001; Robert et al., 2002). Unfortunately no
consistent quantitative thermodynamic and kinetic data have been reported (
Yang et al., 1998; Bilia et al., 2002; Meshnick,
2002; Kannan et al., 2002).
In this MSc work, the interaction of hemin with
quinoline-based drugs, i.e. chloroquine, quinine, and quinidine, was firstly
examined in 50% water-propylene glycol mixture at various pH values using a
spectrophotometric titration method. Water-propylene glycol mixture is
interesting because propylene glycol is much less toxic and commonly used as
pharmaceutical adjuvant. Interactions of endoperoxide lactone based
antimalarias, i.e. artemininin, dihydroartemininin and artesunate, with hemin
were then investigated using UV-Vis spectroscopic and HPLC-MS methods. Because
of weak solubility of artemisinin and dihydroartemisinin in 40% aqueous DMSO at
pH 7.4, we report the interaction of hemin with artemisinin, artesunate and
dihydroartemisinin in this medium, at pH 9 at 37oC. The relatively
nontoxicity property and miscibility with water of DMSO allow it to have wide
applications in cell biology as solvent for drugs (Yu and Quinn, 1994).
Chapter 2 Literature Survey
2.1 Biology of the malaria parasite
2.1.1 Life cycle of malaria parasite
In humans, malaria is caused by four species of the genus
Plasmodium, namely Plasmonium falciparum, Plasmodium vivax,
Plasmodium ovale and Plasmodium malariae (Wernsdorfer and
McGregor, 1988).
Of these, P. falciparum is the most important as it
causes almost all malaria-associated deaths. There is, however, significant
morbidity associated with P. vivax (Trigg and Kondrachine, 1998). The
biology of P. falciparum is fortunately the best understood of the
four species. The life cycle of P. falciparum is complex and divided
into three overall stages: mosquito, liver and blood stages.
Sexual reproduction of gametocytes occurs in the gut of the
female vector mosquito (Anophele genus) and leads to the formation of zygotes
that bury themselves in the gut lining of the mosquito. These then develop into
oocysts and after some time form sporozoites that migrate to the salivary
glands of the mosquito. When an infected mosquito bites a human host, these
sporozoites enter the blood stream and rapidly make their way to the liver,
invading hepatocytes. During a period of development in the liver of about a
week as tissue schizonts, the parasites multiply asexually, finally
simultaneously rupturing the host cells and entering the blood stream as
merozoites. These merozoites invade red blood cells, entering into the blood
cycle consisting of ring, trophozoite and blood schizont stages as shown in
Figure 1-1.
Asexual reproduction in the blood cell leads to further
merozoites and hence to ever increasing parasitaemia. Some of the merozoites
develop into gametocytes. Upon entering the red cell the gametocytes may be
taken up by mosquitoes to complete the life cycle. Symptoms of the disease
(high fever, headache, malaise, muscle aches...) are entirely associated with
the blood stage and so any curative drug must be specifically active against
this part of the life cycle (Wernsdorfer and McGregor, 1988).
By knowing what is happening in the blood stage of parasite
life cycle, we can understand why, generally speaking, individuals with
abnormal hemoglobin S are resistant to malaria? Normally, about 2% of the
erythrocytes of individuals with sickle -cell anemia are observed to sickle
under low-oxygen concentration conditions found in the capillaries. However,
the lower pH of infected erythrocytes increases the proportion of sickling in
the capillaries up to 40%. Thus during the early stages of malarial infection,
parasite-enhanced sickling probably causes the preferential removal of infected
erythrocytes from the circulation. In the latter stages of infection, when the
parasitized erythrocytes are attached to the capillary walls, the sickling
induced by the low oxygen environment may mechanically and /or metabolically
disrupt the parasite. Consequently, bearers of the sickle cell trait in a
malarial region have an adaptive advantage (Voet and Voet, 1995).
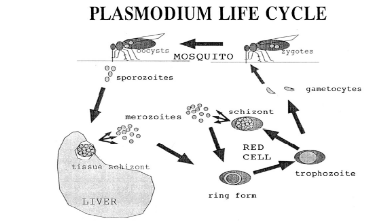
Figure 1-1 A representation of the life cycle
of Plasmodium falciparum. Ring forms, trophozoites and blood schizonts
are collectively referred to as the blood stages of the cycle and are the
specific targets of chloroquine and related antimalarial drugs. After invading
red cells, most merozoites form ring stages and then trophozoites, but a small
fraction instead develop into sexual forms called gametocytes which then
reproduce in the gut of a mosquito when the insect feeds on the infected host.
(Egan et al., 1999).
2.1.2 Hemozoin formation by malaria parasite
During its blood stage, P. falciparum utilises host's
hemoglobin as a food source. This stage occurs in an acidic compartment within
the parasite called a food vacuole that has a pH in the range 5.0-5.6 (Spiller
et al., 2002). Plasmodia degrade hemoglobin and use the amino acids derived
from proteolytic digestion for their biosynthetic requirements. Hemoglobin
degradation is a highly ordered process involving several proteases (Eggleson,
1999; Banerjee, 2002; Rosenthal et al., 2002). Denatured globin formed by the
action of plasmepsins is further degraded into small peptides by other
proteases. A cysteine protease, falcipain, has been characterized from P.
falciparum, which degrades denatured globin (Eggleson, 1999).
Large amounts of free nontoxic heme is released as a product
of hemoglobin degradation (Mavakala and Gushimana, 1991). Released heme from
hemoglobin is autoxidized into ferric form (hematin, hemin or
aquaferriprotoporphyrin IX or H2O-Fe(III)PPIX) that is highly toxic,
inhibiting vacuolar proteases and damaging parasite membranes [Berman and
Adams, 1997]. Detoxification of heme is therefore necessary for the survival
and growth of malaria parasite (Meshnick, 2002).
In the host, detoxification of heme is achieved by an enzyme
called heme oxygenase, which breaks heme to form biliverdin. Another enzyme,
biliverdin reductase, converts biliverdin into bilirubin, which is converted
into a water-soluble conjugate and excreted through urine. Malaria parasite
does not seem to use this pathway for the heme catabolism. Inside the food
vacuole of malaria parasite, heme is converted into hemozoin, popularly known
as malaria pigment. This hemozoin pigment is a dimer of heme units linked
through an iron-carboxylate bond (Pagola et al., 2000).
Pagola et al. have revealed that hemozoin is a hemin
dimer with hydrogen bonding between the dimer units in the crystal as shown in
Figure1-2. In the light of this, the continued use of the word polymer to
describe malaria pigment or -hematin, or the word polymerization to describe
its formation is inappropriate and inaccurate (Pagola et al., 2000; Egan,
2002).
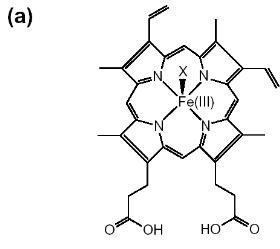
Figure 1-2 Chemical structures are shown for
(a) hematin (aqua or hydroxyferriprotoporphyrin IX),
(b) heme. The dimeric structure for beta-hematin is also
indicated (c). The OH-, H2O group is represented by X in
(a) and the histidine is represented by Y in
(b) (Egan, 2002).
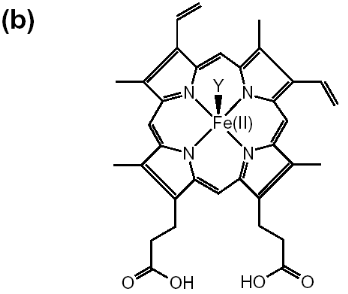
In the dimer, a bond is formed by the linking of central
ferric iron of one heme unit with the propionate side chain of another heme.
This pigment is inert in parasite and released into the host blood supply after
infected erythrocytes burst open at the end of parasite life cycle (Pandey and
Tekwani, 1996). Hemozoin is insoluble in organic solvents (methanol, ethanol,
and acetone) and mildly soluble in alkaline bicarbonate buffer (100 mM, pH
9.0), whereas free heme is soluble in these solvents.
2.2 Some proposed mechanisms of action of antimalarial drugs
Numerous conflicting theories have been put forward over the
past five decades to describe the mechanism of action of antimalarial
drugs. Hypothesis for the mode of action of chloroquine
essentially fall into two broad categories: those in which the drug exerts its
action outside the food vacuole of the parasite and those in which the activity
is located inside the food vacuole.
2.2.1 Mechanism of action of chloroquine and related
antimalarials
2.2.1.1 Extravacuolar mechanisms: DNA
binding
Chloroquine and related drugs exhibit antibacterial activity,
blocking both DNA and RNA synthesis but the required chloroquine concentration
is about one thousand times as much as that needed in curative treatment of
malaria. No binding of mefloquine to DNA has been observed (Slater, 1993; Egan
and Marques, 1999).
2.2.1.2 Intravacuolar mechanisms
Intravacuolar mechanisms seem more plausible because of
substantial accumulation of the drugs in the vacuole. Most
workers in the field currently favour a hypothesis in which quinoline
antimalarial drugs inhibit formation of hemozoin. There is,
however disagreement over how this occurs and there are essentially three
variations of the hypothesis:
1. Slater and Cerami (1992) originally suggested that these
drugs inhibit the putative heme polymerase enzyme.
2. Fitch and Chou (1996) have extended this hypothesis by
suggesting that these drugs are potential regulators of the putative heme
polymerase enzyme.
3. Egan and coworkers (Egan et al., 1994) have shown that
chloroquine, amodiaquine and quinine can directly inhibit formation of
synthetic -hematin and suggested that activity of these drugs in vivo involves
inhibition of hemozoin formation by direct interaction with Fe(III)PPIX. This
hypothesis has also been supported by Dorn and co-workers (Dorn et al., 1995;
Dorn et al., 1998) and further support for this type of mechanism has been
presented by several other laboratories (Sullivan et al., 1996; Basilico et
al., 1997; Hawley et al., 1998) although there are some differences in
detail.
These findings motivated a number of studies on
antimalarial-hematin interactions in both aqueous and non-aqueous solution, as
well as on their interactions with other iron-porphyrins. Many of the earlier
studies concentrated on obtaining visible, Mössbauer and NMR spectroscopic
evidences for hematin-drug interactions and some association constants were
determined. For example, Log K values for the bonding of hemin-drug
are 5.52 (chloroquine), 5.39 (amodiaquine), 4.10 (quinine), 4.04 (9-epiquinine)
and 3.09 (mefloquine), in 40% aqueous DMSO solution, at an apparent pH of 7.5
and 25oC (Egan et al., 1997; Adams et al., 1999). It is clear from
the recent investigation of Egan and coworkers that only 2- and
4-aminoquinolines and their derivatives form strong complexes with Fe(III)PPIX.
Under the conditions of their studies, quinoline, 3-, 5-, 6-, and
8-aminoquinoline, and 4,7-dichloroquinoline exhibited no evidence of
complexation with Fe(III)PPIX. Then, there is a simple correlation between
hemin binding and -hematin inhibitory activity because those of compounds,
which do not form measurable complexes, fail to inhibit -hematin. Surprisingly,
however, not all quinolines, which do form strong complexes with Fe(III)PPIX,
inhibit -hematin formation.(Egan, 2000). Perhaps, they are capable of
inhibiting -hematin formation at high concentration. Egan et al. proposed a
detailed model of the structure-function relationships in chloroquine as
follows:
1. The 4-aminoquinoline nucleus alone provides an hemin
complexing template but is not sufficient for inhibiting the formation of
hemozoin;
2. Introduction of the 7-chloro group is responsible for
inhibition of hemozoin formation but probably has little influence on the
strength of association with hemin;
3. The aminoalkyl side chain is a requirement for strong
antiplasmodial activity. It probably assists in drug accumulation in the food
vacuole. It also appears to enhance the strength of association with hemin in
some cases, but this effect does not appear to be essential for its
activity.
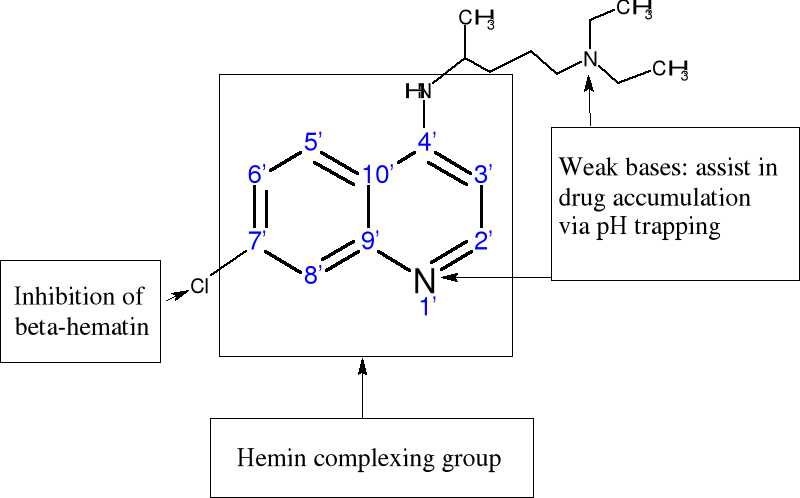
Figure 1-3 Proposed structure-function
relationships in chloroquine based on findings of Egan and coworkers (Egan et
al., 2000).
2.2.1.3 Increased vacuolar pH mechanism
It has been reported that several enzymes like aspartic
proteases, cysteine proteases and metalloproteases (Rosenthal, 1999) are
thought to be involved in the degradation of hemoglobin. Many of these enzymes
are optimally active at pH 4.5-5.0 and it is argued that the food vacuole would
probably need to maintain a similar pH to permit the efficient proteolysis of
hemoglobin (Francis et al., 1997). The work of Homewood and coworkers (Homewood
et al., 1972) in the early 1970s outlined the potential importance of
the pH of the digestive vacuole (pHDV) in the mode of action of
chloroquine (CQ) and similar drugs. CQ is a lipophilic weak base that will pass
through biological membranes in the uncharged form. Once, inside acidic
compartments, CQ is protonated and trapped because the protonated base is
relatively impermeable. If we assume that the digestive vacuole (DV) has a pH
of ~5.0, then this mechanism would permit concentrative uptake of the drug
(Geary et al., 1986). Homewood suggested that CQ might kill parasites by
increasing pHDV, so that the acid proteases of the parasite could no
longer function effectively (Spiller et al., 2002).
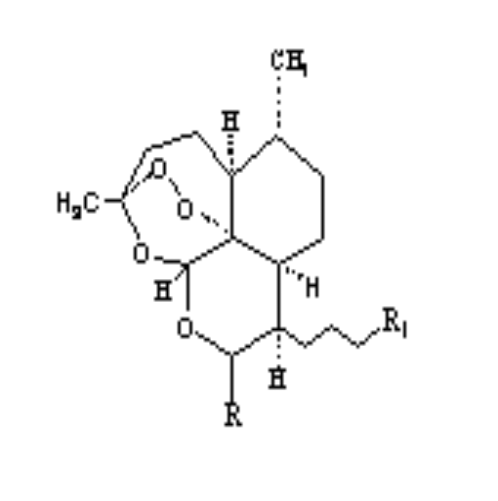
2.2.2 Mechanism of action of artemisinin and its
derivatives
2.Artemisinin 3. R= OH Dihydroartemisinin
R= OCH3 Artemether
R= OCH2CH3
Arteether
R=
O2CCH2CH2CO2H Artesunate
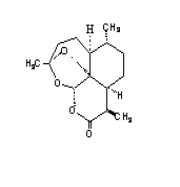
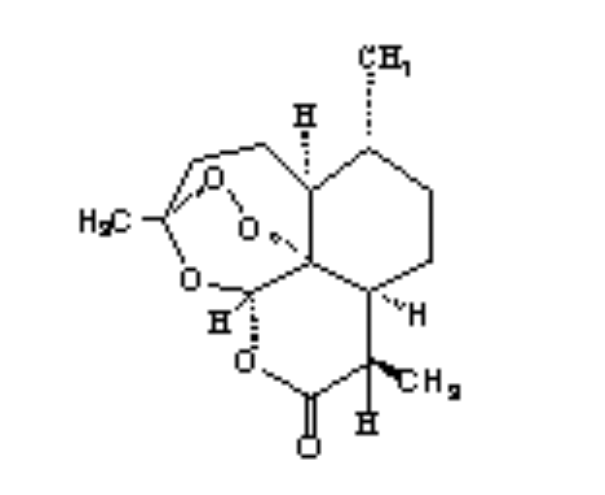
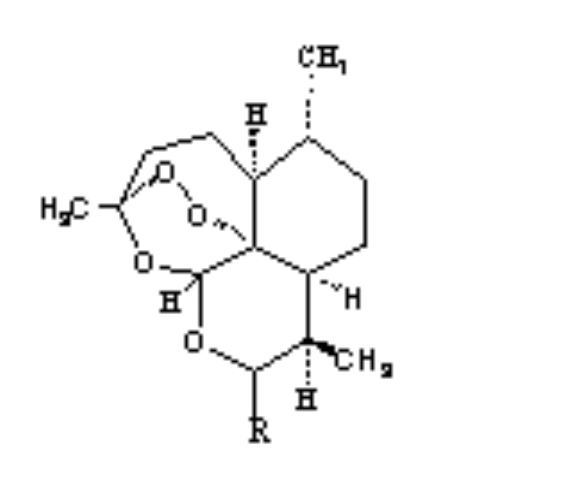
1.Deoxyartemisinin
Artemisinin was developed from an ancient Chinese herbal
remedy. Artemisia annua (sweet wormwood or`qinghao') was used by
Chinese herbal medicine practitioners for at least 2000 years. In 1596, Li Shi
zhen, a famous herbalist, recommended it to patients with fever. In 1967,
Chinese scientists screened a series of traditional remedies for drug
activities, and found that extracts of qinghao had potent antimalarial
activity. In 1972, the active ingredient was purified and first named qinghaosu
(essence of qinghao), and then later renamed artemisinin. Western interest in
Artemisinin derivatives (artesunate, artemether, dihydroartemisinin, arteether)
began to grow as multidrug resistant Plasmodium falciparum strains
began to spread. Hundreds of synthetic second generation artemisinin
derivatives and other natural peroxide compounds with good antimalarial
activity have been reported like yingzhaosu, arteflene (Lian et al., 1988;
Hofneiz et al., 1994) as shown in scheme 2-1. Due to their potent antimalarial
activity, fast action, and low toxicity, artemisinin and its derivatives have
distinguished themselves as a new generation of antimalarial drugs. Actually,
it has been established that the dihydroartemisinin combined to the
holotransferrin would be a promising drug against cancer (Singh and Lai,
2001).
4. R=H R1=C6H5
5. .Arteflene
6.Yinzhaosu
R=H R1=CH3
R= OH R1=C6H5
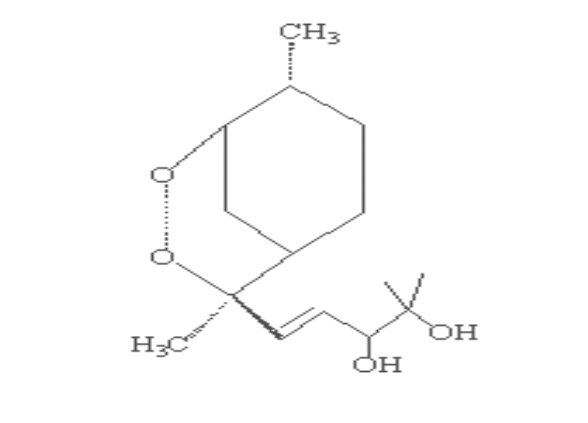
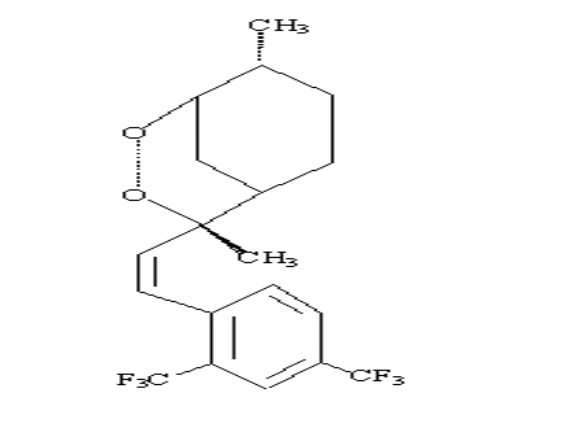
Scheme 2-1 Structures of
artemisinin analogous
The unusual structure of artemisinin molecules might be
indicative of a different mode of action from those of other antimalarial drugs
and hence the high potency against the resistant strains. Although the
mechanism of its antimalarial activity is not clear and still under debate,
there is general agreement that the endoperoxide bridge is essential for the
antimalarial activity of artemisinin since deoxyartemisinin compounds which
lack the endoperoxide moiety are inactive (China cooperative group on
qinghaosu, 1982).
Meshnick et al. proposed a two-step mechanism for
the antimalarial action of endoperoxide:
In the first step, artemisinin is activated by intraparasitic
heme or free Fe (II) ion to produce free toxic carbon-centred radicals,
confirmed by electron paramagnetic resonance (EPR) studies (Meshnick et al.,
1993; Taranto et al., 2002].
In the second step, once formed, the artemisinin-derived free
radicals appear to damage specific intracellular targets, possibly via
alkylation (Berman and Adams, 1997).
But Pandey et al. proposed three possible ways for the effect
of endoperoxide drugs on malaria (Pandey et al., 1999; Kannan et al., 2002):
-Inhibition of hemoglobin degradation
-Inhibition of hemozoin biosynthesis
-Interaction of artemisinin with hemozoin leading to the
breakdown of the hemozoin pigment which could then form a complex with the heme
unity.
These mechanisms are supported by the characterization of a
covalent adduct between artemisinin and heme (Robert and Meunier, 1997) and by
protein alkylation (Meshnick et al., 1991; Yang et al., 1994). Artemisinin also
forms covalent adducts with protein but not with DNA (Yang et al., 1994). Thus,
heme is both an activator and target of the artemisinin derivatives (Posner et
al., 1995).
About the free radicals generated by artemisinin,
there are some controversial discussions on the mechanism of their production.
There is much stronger evidence that carbon-centred free radicals are involved.
In fact, monoelectronic transfer from iron (II) to peroxide resulted in the
cleavage of endoperoxide bond with primary formation of an unstable
oxygen-centred radical, rearrangement and creation of toxic C4-centred free
radicals. It has been proposed that heme attacks the endoperoxide linkage of
artemisinin either at the O1 [Shukla et al., 1995] or O2 position [Tonmumphean,
2001] as shown in scheme 2-2. In pathway A, heme iron attacks the compound at
the O2 position. Later, it rearranges to form C4 free radical. In pathway B,
heme iron attacks the compound at the O1 position after that C3-C4 bond is
cleaved to give carbon radical at C4 as shown in scheme 2.
Thus the presence of heme is necessary for the activation of
artemisinin into an alkylating agent, which preferentially attacks proteins.
The fact that artemisinin becomes cytotoxic in the presence of
ferrous, have triggered some researchers to study its effect on the therapy of
cancer. Since iron influx is high in cancer cells, artemisinin and its
analogous, after incubation with holotransferrin which increase the
concentrations of ferrous iron in cancer cells, selectively kill cancer cells
(Singh and Lai, 2001). In addition to the more largely accepted mechanisms
summarized above, other mechanisms of action have also been proposed. For
example, Jefford proposed that peroxides could interrupt the detoxification
process of heme by transferring an O atom to heme, creating iron-oxene or
oxyheme intermediates, which subsequently disable parasite (Jefford et al.,
1995).
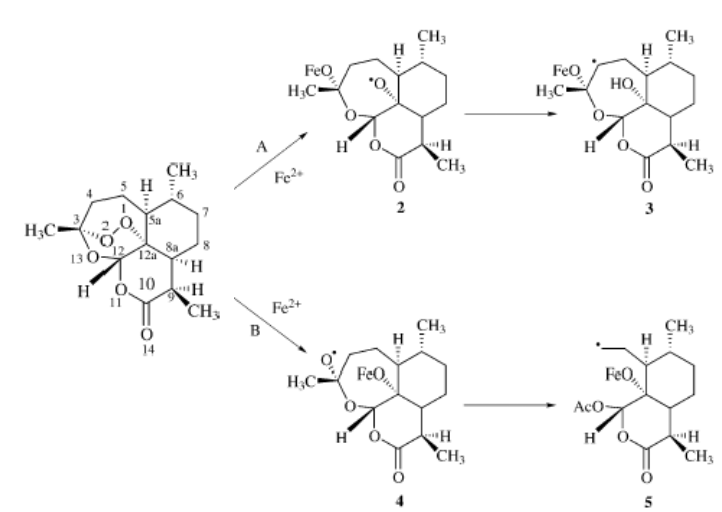
Scheme 2-2
Proposed mechanism of action of artemisinin (Tonmumphean , 200)].
Haynes and co-workers (Haynes et al., 1999) pointed
out that activity is due to the trioxane unity acting as a source of
hydroperoxide, which provides electrophilic oxygenating species, hydroxyl or
alkoxyl radicals via reductive cleavage with Fe (II) or other reducing agents.
These species would be able to hydroxylate biomolecules.
In summary, a schematic diagram of hemoglobin
degradation and related pathways is given in Figure 2-4 (Pandey et al., 1999;
Egan, 2002).
Drug effect 1 :
complex formation with heme
Drug effect 3 :
proteases inhibitors (by endoperoxide only)
Drug effect 2 : inhibition of hemin
dimerization
Drug effect 4 :
Interaction with hemozoin
Toxic effects of heme accumulation :
1. Membrane damage
2. Inhibition of cysteine proteases
Hemoglobin
Globin
Heme
Hemozoin
Small peptides
Hemin
Small peptides
Amino acids
(used by parasite for protein synthesis)
Oxidation
Plasmepsin I, II and IV (aspartic proteases),HAP
Falcipain (cysteine protease)
Peptide transporter
HRP-2
Target of new drug discovery
strategy
Drug transport to parasite cytosol carrier mediated
transport
(pH 4.7-5.4)
Drugs acumulation to millimole level in food vacuole by weak
base mechanism
Parasite membrane
Red cell membrane
Drug uptake through biological membrane by passive
diffusion phenomena
Blood schizontocidal antimalarials
Serine protease
Figure 2-4 A schematic
diagram of hemoglobin degradation and related pathways
DIGESTIVE VACUOLE OF PLASMODIA
2.3 Mechanisms of resistance of parasite to current
drugs
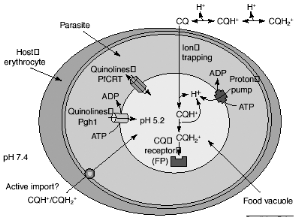
Despite the almost universal occurrence of
chloroquine resistance, available evidence suggests that resistance arises as a
result of a decrease in drug concentration at the site of action, rather than
any change in the target of the drug itself. Chloroquine accumulation in the
acidic food vacuole of the malaria parasite might occur by passive diffusion
down the pH gradient (ion trapping), by import via an ATP-dependent transporter
(active uptake) or by binding to FP (CQ receptor). The CQ in the food vacuole
will be almost exclusively diprotonated. The plasmodial P-glycoproteinhomolog-1
(Pgh-1) or the Plasmodium falciparum resistance transporter (PfCRT)
are implicated in CQ resistance and might modulate quinoline uptake directly,
by transporting drugs in and out of the food vacuole, or indirectly, by
contributing to the generation of a pH or electrochemical gradient as shown in
Figure 2-5. It has long been acknowledged that the pHDV could be
important in the mechanism of CQ resistance: CQ-resistant (CQR) parasites
accumulate much less CQ than do their CQ-sensitive (CQS) counterparts (Bray et
al., 1998). Following from the weak-base theory, small increases in
pHDV (in the order of 0.2-0.5 pH unit) would substantially reduce
the vacuolar concentration of CQ (Yayon et al., 1985; Foley and Tilley, 1998;
Dzekunov et al., 2000; Fidock et al., 2000; Hyde, 2002].
There is currently no evidence for clinically relevant
artemisinin resistance (Meshnick, 2002), but Kamchonwongpaison and co-workers
have reported that P. falciparum parasites in - thalassemic red cells
are more resistant to artemisinin and artesunate than parasites in genetically
normal cell (Kamchonwongpaison et al., 1994). Because P. falciparum
infected thalassemic red cells have a decreased capacity to accumulate drug. In
fact, the thalassemics are a group of genetic diseases with defects in globin
chain synthesis in -thalassemic, there is decrease in -globin chain whereas in
-thalassemia, there is a decrease in -globin synthesis. This result suggests
that special precaution should be made for using artemisinin compounds in the
treatment of malaria in any area where abnormal globin-gene frequency is high
since this will facilitate the development of artemisinin resistance.
Paradoxically, thalassemia appears to confer resistance to malaria infection in
vitro and in vivo (Weatherall, 1987; Yuthavong and Wilairat, 1993).
Figure 2-5 Possible mechanisms for
chloroquine (CQ) uptake and resistance. [Macreadie et al., 2000]
2.4 New strategy in the war against malaria
2.4.1 Discovering Antimalarials: New drug targets
The positive development over the last decade has been the
considerable increase in the understanding of processes occurring within the
parasite that are relevant to the mode of action of current antimalarials. It
also provides knowledge on targets or potential targets for new antimalarial
compounds.
It has been established that proteolysis of
hemoglobin is considered to be carried out by four aspartic proteases, namely
plasmepsins I, II, and IV, and histo-aspartic protease (HAP) (Banerjee, 2002),
three cysteine proteases (falcipains) (Rosenthal et al., 2002), and zinc
protease (falcilysin) (Eggleson, 1999). All of these represent potential
targets for antimalarials (Figure 2-4) and are currently the subject of intense
investigation.
Digestion of hemoglobin releases heme into the food vacuole,
where it is oxidized to hematin. Heme is another possible drug target and has
been implicated in the mode of action of endoperoxide antimalarials, such as
artemisinin and its derivatives (Robert et al., 2002).
Hematin is believed to be the target of chloroquine and other
quinoline antimalarials (Figure 2-4). It has been demonstrated that
histidine-rich protein 2 (HRP-2) has been implicated as an enzyme or, more
likely an initiator in the process of formation of hemozoin. Drugs such as
chloroquine have been proposed to inhibit hemozoin formation via direct
interaction with hematin (Kaschula et al., 2002), by displacing hematin from
HRP-2 (Pandey et al., 2001), or by preventing its binding to this protein.
HRP-2 represents a hitherto unexplored target for new antimalarials (Figure
2-4). In this issue of chemistry and biology, the development of a new
rapid-throughput screening method for investigating the ability of compounds to
prevent hematin binding to HRP-2 is reported recently (Choi et al., 2002;
Kannan et al., 2002).
These discoveries can be elaborated on in the future to yield
new drugs for treatment of this devastating disease (Egan, 2002).
2. 4.2 New generation of antimalarial drugs:
trioxaquines
As recommended by the WHO, the combination of at least two
drugs having different modes of action must be used to prevent the development
of drug resistance. Dechy et al. therefore adopted a covalent bitherapy
strategy by preparing new molecules named trioxaquines by covalently attaching
a trioxane, the moiety responsible for the activity of artemisinin, to a
4-aminoquinoline entity, a key constituent of chloroquine (Dechy- Cabaret,
2000; Rodriguez et al., 2003). DU-1102, the first trioxaquine proved very
active in vitro on chloroquine-sensitive and chloroquine-resistant
Plasmodium falciparum, both on laboratory strains (Dechy-Cabaret,
2000) and on human isolates. DU-1102 is a modular molecule that can be prepared
through a convergent synthesis from the cis-bicyclo [3.3.0] octane-3, 7-dione
in place of the 1,4-cyclohexanedione used to prepare DU-1102 (Dechy-Cabaret et
al., 2002) as shown in scheme 2-3.
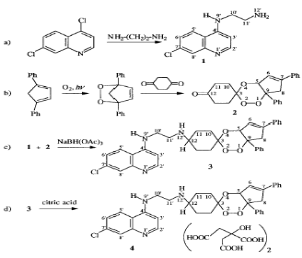
Scheme 2-3.
Convergent synthesis of the trioxaquine, represented by the molecule
4.
2.2.4 Vaccine
Over the years, researchers confronting the extraordinarily
complex parasite have suffered a string of disappointments interspersed with
some high-profile setbacks, as promising candidate vaccines have failed to
perform up to expectations. The scientific obstacles are enormous: Compared to
a virus, with its dozen or so genes and relatively monomaniacal approach to
evading the human immune system, the malaria parasite has 14 chromosomes,
perhaps 7000 genes, and a four-stage life cycle as it passes from humans to
mosquitoes and back again. The existing different species of parasites and
their multistage life are obstacles for efficiency elaboration of vaccine.
Moreover, dozens of new vaccines are in the works, employing a host of
technologies that promise to attack the parasite at every vulnerable point of
its multistage life. Researchers now predict that within 5 or 10 years they
will have a successful vaccine that will actually save lives (Taubes, 2000).
2.2.5 Genetic approaches
With the actual human, related plasmodium species and mosquito
genome sequences, researchers now have in hand the genetic blueprints for the
parasite, its vector, and its victim. This will provide the ability to take a
holistic approach in understanding how the parasite interacts with the human
host. With that approach, new antimalarial strategies should be
possible (Pennisi, 2000). Transgenic mosquitoes could be one
product of these studies.
The goal would be to replace the natural mosquito populations
ravaging developing countries by "designer mosquitoes," genetically modified so
that they are unable to transmit malaria parasite. The development of this
technique is crucial for scientists studying the biology of the mosquito and
its interactions with the malaria-causing parasite. Genetic modification of
mosquitoes offers exciting possibilities for controlling malaria, but success
will depend on how transformation affects the fitness of modified
insects (Enserink, 2002; Flaminia et al., 2003).
Chapter 3 Experimental materials and methods
3.1 Materials
3.1.1 Property of chemicals
|
Product Name
|
Molecular Formula
|
Molecular Weight
|
Manufacturer
|
|
Hemin chloride
|
C34H32ClFeN4O
|
652.0
|
Sigma
|
|
Artemisinin
|
C15H22O5
|
282.34
|
Guilin Pharmaceutical Factory
|
|
Dihydroartemisinin
|
C15H24O5
|
284.35
|
Beijing Cotexcin New Technology Corporation
|
|
Artesunate
|
C19H2808
|
384.43
|
Guilin Pharmaceutical Factory
|
|
Chloroquine diphosphate
|
C18H26N3Cl.2H3PO4
|
515.9
|
Sigma
|
|
Quinine
|
C20H24N2O2
|
324.4
|
Merck
|
|
Quinidine sulfate
|
(C20H24N2O2)2.H2SO4
|
746.9
|
Merck
|
|
Sodium hydroxide A.R.
|
NaOH
|
40
|
Beijing Chemical Factory
|
|
Hydrochloric acid A.R, 36-38%, d=1.18
|
HCl
|
36.46
|
Beijing Chemical Factory
|
|
Sodium bicarbonate
|
NaHCO3
|
84.1
|
Beijing Chemical Reagent Company
|
|
Dimethylsulfoxide
|
(CH3)2SO
|
78.13
|
Beijing Xing Jin Chemical Factory
|
|
Ethanol
|
CH3CH2OH
|
46.07
|
Beijing Yili Fine Chemical reagents Company
|
|
Propylene glycol
|
CH3CHOHCH2OH
|
76.10
|
Beijing Chemical Reagent Company
|
|
Methanol (HPLC grade)
|
CH3OH
|
32.04
|
Fisher Scientific
|
|
Acetic acid
|
CH3COOH
|
47.1
|
Beijing Chemical Reagent Company
|
|
Ethylene glycol
|
HOCH2CH2OH
|
62.07
|
Beijing Chemical Reagent Company
|
|
Sodium hydrogen phosphate A.R.
|
Na2HPO4.12H2O
|
358.14
|
Beijing Yili Fine Chemical Reagents Company
|
|
Sodium dihydrogen phosphate A.R.
|
NaH2PO4.2H20
|
156.01
|
Beijing Yili Fine Chemical Reagents Company
|
|
Tris (hydroxymethyl)-methylamine
|
C4H11NO3
|
121.09
|
Beijing Yili Fine Chemical Reagents Company
|
3.1.2 Apparatus
|
Appliance
|
Method of Analysis
|
Laboratory
|
|
Shimadzu UV -Visible 21OOS Spectrophotometer
Coupled to CPS-260 thermostat, Japan
|
Measurements of absorbance at the Soret band of hemin
(interaction hemin-artemisinin compounds)
|
Tsinghua Analysis Center, Beijing
|
|
Perkin-Elmer Lambda 2 UV-Visible Spectrophotometer, Germany
|
Measurements of absorbance at the Soret band of hemin
(interaction hemin-quinoline compounds )
|
Biomacromolecules Laboratory, Kinshasa University (Congo)
|
|
LS/MS/MS API 300
Column :SB-C18 Zorbax
4.6x250nm(5m), USA
|
Measurements of the mass of the hemin-artemisinin compounds
complex
|
Tsinghua Analysis Center, Beijing
|
|
Agilent 1100 series LC/MSD Trap/ Column :SB-C18 Zorbax
4.6x250nm(5m), USA
|
Measurements of the mass of the hemin-artemisinin compounds
complex (Analytical HPLC/DAD/MS)
|
Tsinghua Analysis Center, Beijing
|
|
Magnetic Stirrer 90-3
|
Mixture of work solutions
|
Chemistry Department,
Tsinghua University
|
|
Balance Adventurer, USA
|
Preparation of stock solutions
|
Chemistry Department,
Tsinghua University
|
|
Temperature Controller KWS-FIE2-B, China
|
Incubation at 37oC
|
Tsinghua Analysis Center, Beijing
|
|
pHmeter PHS-2C(Shanghai Dapu Instruments Limited compagny)
equipped with Aurora Electrode(kept soakep in 4 M KCl)
|
pH measurements of stock and work solutions
|
Chemistry Department,
Tsinghua University
|
3.1.3 Physical chemical properties of used
solvents
Some physical and chemical properties of solvents
which are used to study hemin-antimalarial drugs interactions are summarized on
the Table 3-1.
Table 3-1:
Comparison of physical, chemical and spectroscopic properties of water, DMSO
and propylene glycol (PREG) (Marcus, 1999).
|
Water
|
DMSO
|
PREG
|
|
Molecular weight (g.mol-1) :
|
18.02
|
78.13
|
76.10
|
|
Density at 25oC(g.cm-3) :
|
0.9974
|
1.0958
|
1.0326
|
|
Melting point ( oC) :
|
0.00
|
18.55
|
-60.15
|
|
Boiling point (oC) :
|
100.00
|
189.05
|
187.65
|
|
Surface tension at 25oC :
|
71.8
|
43.0
|
36.5
|
|
Viscosity at 25oC( mPa s) :
|
0.8903
|
1.991
|
42.2
|
|
Dielectric constant at 25oC :
|
78.36
|
46.45
|
32
|
|
Diameter (nm) :
|
0.343
|
0.513
|
0.533
|
|
Dipole momemt (D)
|
1.85
|
4.06
|
2.25
|
|
Hydrogen bond
donation ability :
|
1.17
|
0.00
|
0.83
|
|
Electron -pair donicity :
|
0.47
|
0.76
|
0.78
|
|
Polarity / polarizability :
|
1.09
|
1.00
|
0.76
|
|
Proton affinity (KJ mol-1) :
|
697
|
834
|
828
|
|
PKa at 25oC :
|
-
|
-
|
14.80
|
|
PKb at 25oC :
|
-
|
15.5
|
-
|
|
Spectroscopic windows, UV(nm) :
|
190
|
265
|
-
|
3.2 Preparations of solutions
3.2.1 Test of solubility of drugs and hemin in some
usual solvents
Solubility of hemin and antimalarial drugs in
some usual solvents are summarized in table 3-2. ART (artemisinin), AST
(artesunate), DHA (dihydroartemisinin), EG (ethyleneglycol), PREG
(propyleneglycol), ETOH (ethanol); +, a (in alkaline solution); +, b (in
bicarbonate solution); +, c (soluble at pH >8).
Table 3-2.
Solubility of hemin and antimalaraial drugs in studied medium
|
Reactants
|
Solvents
|
|
H2O
(pH 9)
|
NaHCO3
5 %
|
EG
|
EG 50 %
|
PREG
|
PREG 50 %
|
ETOH
80 %
|
DMSO
|
DMSO 25 %
|
DMSO 40 %
|
|
Hemin
|
+
|
-
|
-
|
+, a
|
-
|
+, a
|
+
|
+
|
+
|
+
|
|
ART
|
-
|
-
|
-
|
-
|
-
|
-
|
+
|
+
|
-
|
+, c
|
|
AST
|
-
|
+
|
-
|
+, b
|
-
|
+, b
|
+
|
+
|
+
|
+
|
|
DHA
|
-
|
-
|
-
|
-
|
-
|
-
|
+
|
+
|
-
|
+, c
|
|
Chloroquine
|
-
|
-
|
-
|
+
|
-
|
+
|
|
+
|
-
|
+
|
|
Quinine
|
-
|
-
|
-
|
+
|
-
|
+
|
|
+
|
-
|
+
|
|
Quinidine
|
-
|
-
|
-
|
+
|
-
|
+
|
|
+
|
-
|
+
|
3.2.2 Buffer solutions
Tris-HCl buffer solutions were prepared by mixing different
amounts of 0.2 M Tris and O.2 M HCl to give required pH.
For 100mL of Tris-HCl buffer, we mixed:
25 mL of Tris with 20.7mL of HCl and diluting it with 45.7 mL
of distillated water (in case of pH 7.4).
25 mL of Tris with 2.5 mL of HCl and diluting it with
distillated water to 100 mL (in case of pH 9).
Phospahte buffer solutions were prepared by mixing amounts of
0.2 M disodium phosphate and O.2 M of sodium phosphate to give required
pH.
For 100 mL of phosphate buffer (pH 7.4), we mixed:
81 mL of disodium phosphate with 19 mL sodium phosphate.
3.2.3 Water- DMSO mixture
40% aqueous DMSO solutions (v/v) were prepared by mixing 40 mL
of DMSO and 60 mL of corresponding buffer so that the final pH of the mixture
was 7.4 or 9.
In addition, 25% aqueous DMSO were prepared by mixing 25 mL
of DMSO and 75 mL of corresponding buffer in the same conditions.
2 M of hydrochloric acid and sodium hydroxide served to adjust
the pH of all solutions.
3.2.4 Water-propylene glycol mixture
Both 50% ethylene glycol and propylene glycol water mixture
were prepared by mixing 50mL of each of them with equivalent volume of buffer,
adjusted to the pH of work solutions..
3.2.5 Hemin solutions
In the propylene glycol medium, hemin stock solution, 306 in
concentration, was prepared by first dissolving 10 mg of in 25 mL of alkaline
distilled water, followed by addition of equivalent volume of propylene
glycol.
(25 or 40%) aqueous DMSO stock solutions of hemin (306 ) were
prepared by first dissolving 10 mg of it in 12.5 or 20 mL of DMSO, followed by
addition 37.5 or 30 mL of buffer.
DMSO stock solutions of hemin (1.0 mM) were prepared by
dissolving 6.52 mg of it in 10mL of DMSO (for HPLC-MS analysis).
Aqueous ethanol 85% stock solutions of hemin (306 ) were
prepared by dissolving 5 mg of it in 21.25 mL of ethanol and 3.75 mL of
distillated water.
Aqueous stock solutions of hemin (306 ) were prepared by
dissolving 5 mg of it in 25 mL of alkaline distillated water.
All stock solutions of hemin were refrigerated under
4oC and, stored in the dark and were stable for at least two
weeks.
3.2.6 Quinolines solutions
Chloroquine, quinine and quinidine stock solutions (0.02 M)
were prepared by dissolving 51.6 mg, 32.4 mg and 78.3 mg of them, respectively,
in 25 mL of acidic distilled water, completed with addition of equivalent
volume of propylene glycol.
0.1 M tris (hydroxymethyl)-methylamine was used as buffer for
all solutions.
3.2.7 Artemisinin solutions
In 40% DMSO aqueous solutions, artesunate, dihydroartemisinin
and artemisinin stock solutions (0.002 M) were prepared by dissolving 19.2 mg,
14.2 mg and 14.1mg of them, respectively, in 10 mL of DMSO, completed with
addition of 15 mL of buffer.
In DMSO solutions, artesunate, dihydroartemisinin and
artemisinin stock solutions (2 mM) were prepared by dissolving 7.69 mg, 5.69
mg and 5.65 mg of them, respectively, in 10 mL of DMSO (for HPLC-MS
measurements).
In 50% propylene glycol solutions, artesunate stock solution
(0.002 M) was prepared by first dissolving19.2 mg of it in 12.5 mL of 5 %
sodium bicarbonate, followed by addition of equivalent volume of propylene
glycol.
3.3 Methods
Various conventional methods thin layer chromatography (TLC)
(Pras et al., 1991), Gas chromatography (GC) (Fulzele et al., 1991), GC-MS and
tandem mass spectroscopy MS\MS (Dhingra et al., 2000), HPLC with UV detection
(Pras et al., 1991) and with electrochemical detection (HPLC-EC) (Acton et al.,
1985) have been proposed and assessed to detect and quantify artemisinin. Radio
immuno assay (RIA) and Enzyme electrochemical detection (ELISA) comprise the
unconventional techniques to detect artemisinin (Dhingra et al., 2000).
In fact, TLC is not reliable technique to quantify artemisinin
due to the poor staining characteristics of the intact molecule and
interference with other constituents of the plants. TLC is useful as an assay
method only after a tedious chromatographic enrichement (Pras et al., 1991).
Gas chromatography also has been applied for the analysis of artemisinin.
However, ART is thermolabile compound (stable upto 150oC) and
decomposes on the column. High-pressure liquid has been used chromatography
with ultra violet detection but the plethora of crude extract constituents that
absorb in the low wavelength region required to detect artemisinin effectively
its peak. Moreover, artemisinin needs to be derivatized due to its lack of
chromophores (Pras et al., 1991). This process can hamper the result by
derivatizing the other compounds present in the crude extract. Moreover, ART is
sensitive to acid and base treatment. The most sensitive way for detecting an
quantifying artemisinin in crude plant extract without any molecular breakdown
or interference from other related compounds and which does not require any
derivatization or sample purifiction is High pressure liquid chromatography
with electrochemical detection (HPLC-EC). HPLC-EC measures ART directly because
the peroxide moiety undergoes electrochemical reduction. This method is highly
sensitive and can detect nanogram levels of artemisinin. However, the reductive
electrochemical detection involves very special precautions as molecular oxygen
is reduced at the low cathodic potentiel of -0.8 V (Acton et al., 1985).
The unconventional methods (RIA and ELISA) are sensitive and
highly specific than conventional methods to detect in artemisinin levels in
small samples of plant tissues from young seedlings and from cell or tissue
cultures. Although RIA is more sensitive, the use of radioactive compounds
present a series of problems of special acquisition and use requirements,
uncertain stability, high cost, health hazards and disposal difficulties
(Dhingra et al., 2000). Hence ELISA is as sensitive as RIA, safer and is based
on the peroxide bridge for antibody specificity to detect artemisinin and
closely related compounds in crude extracts of artemisia annua
(Dhingra et al., 2000).
In our study, we used UV-Vis spectroscopic and HPLC-MS with
UV detection for investigating the binding of hemin with antimalarial drugs.
3.3.1Ultraviolet/Visible molecular absorption
spectrometry
3.3.1.1 General principle
Absorption measurements based upon ultraviolet and visible
radiation find widespread application for the identification and determination
of myriad inorganic and organic species. Molecular ultraviolet/visible
absorption methods are perhaps the most widely used of all quantitative
analysis techniques in chemical and clinical laboratories throughout the world.
Important characteristics of spectrophotometric and photometric methods
include: (1) wide applicability to both organic and inorganic systems, (2)
typical sensitivities of 10-4 to 10-6 M, (3) moderate to
high selectivity, (4) good accuracy, (5) ease and convenience of data
acquisition (Skoog et al., 1998).
Enormous numbers of inorganic, organic and biochemical species
absorb ultraviolet or visible radiation and are thus amenable to direct
quantitative determination. Many nonabsorbing species like artemisinin and
derivatives can also be determined spectrophotometrically by causing them to
react with a chromophoric reagent (i.e. hemin) to yield a product that absorbs
in the ultraviolet or visible region.
Absorption spectroscopy is based upon electromagnetic
radiation in the wavelength region of 160 to 780nm. Then, molecular absorption
spectroscopy is based on the measurement of the transmittance
T or the absorbance A of solutions contained
in transparent cells having a path length of d cm. Ordinarily,
the concentration c of an absorbing analyte is linearly
related to absorbance as represented by the equation 3-1.
A = -log T = cd (3-1)
This equation is a mathematical representation of
Beer-Lambert's law, where is the molar extinction coefficient. Absorbance of a
solution is often influenced by such variables as the nature of the solvent,
pH, temperature, electrolyte concentration, reaction time and presence of
interfering substances (Skoog et al., 1998).
.
3.3.1.2 Procedural details of
hemin-drugs spectrophotometric titrations.
Spectrophotometry is a valuable tool for elucidating the
composition of complex ions in solution and for determining their formation
constants. In this study, we opted for the mole-ratio method, where a series of
solutions is prepared in which the analytical concentration of one reactant is
held constant while that the other is varied. A plot of absorbance versus mole
ratio of the reactants is then prepared.
In our study, the interactions of hemin with quinoline based
drugs were investigated in water-propylene glycol mixture at pH 9, 8.1, 7.4,
and 6.8 using spectrophotometric method. Temperature was controlled at
25oC. Although quinolines compounds showed some bands of absorption
in UV-Visible domain, the titration was carried out at the hemin characteristic
Soret band at 396 nm by mixing a constant volume (0.3 mL) of hemin solution
with various volumes of drug solutions, and then diluted to 5 mL. Thereby,
hemin remains at constant concentration (19 ) while drugs concentrations are
changed in the range of 0-1300 .
Hemin-artemisinin compounds in water-DMSO or in
water-propylene glycol mixture were studied too, using spectrophotometric
method, at pH 9 and 7.4.
The spectrophotometer was equipped with a thermostatic cell
and temperature was controlled at 37oC. Due to its lack of
chromophores group, artemisinin absorb weakly in the low wavelength region and
made his quantification more difficult. Then, the titration was carried out at
the hemin characteristic Soret band at 398 (in 50 % PREG) and 402nm (in 40 %
DMSO) by mixing a constant volume (0.1 mL) of hemin solution with various
volumes of drug solutions, and then diluted to 10 mL by addition of Tris-PEG or
Tris-DMSO mixtures. Thereby, hemin remains at constant concentration (3 ) while
drugs concentrations are changed in the range of 0-200 . Before each
measurements of absorbance, the work solutions were incubated at
37oC. UV-Visible spectra were carried out after 10 or 24 hours of
incubation.
The spectra have been recorded under the following
instrumental conditions:
Light-path-length cell: 1.0 cm
Mode: absorbance
Slit width: 2nm
Scan speed: fast
Wavelength range: 230-650 nm
3.3.2 Chromatographic separation method
3.3.2.1 General description of
chromatography
Chromatography is a separation,
identification, purification and quantification technique that dates from the
work of the Russian chemist Mikhail Tswett in 1903. There are a variety of
chromatography techniques, in common use, all of which work on a similar
principle. The mixture to be separated is dissolved in a solvent, called the
mobile phase, and passed over an adsorption material, called the stationary
phase, which is fixed in place in a column or on a solid surface. Those
components that are strongly retained by the stationary phase move only slowly
with the flow of mobile phase. In contrast, components that are weakly held by
the stationary phase travel rapidly. As a consequence of these differences in
mobility, sample components separate into discrete bands, or zones, that can be
analyzed qualitatively and/or quantitatively. From the chromatogram, several
parameters like the retention time can be deduced to characterize the
separation and the efficiency (Niessen, 1999).
Chromatographic processes can be classified according to the
type of equilibration process involved, which is governed by the type of
stationary phase. Various bases of equilibration are: adsorption
(TLC), partition (HPLC), ion
exchange (IEC), Molecular Exclusion
Chromatography and affinity chromatography.
High-performance liquid chromatography is the most widely
used of all the analytical separation techniques. The reasons for the
popularity of the method is its sensitivity, its ready adaptability to accurate
quantitative determinations, its suitability for separating volatile species,
similar polarties components or thermally fragile ones, and above all, its
widespread applicability to substances that are of prime interest to industry,
to many fields of science, and to the public.
Discussions about HPLC methods often revolve around the
internal diameter (id) or bore of the column to be used. Standard bore columns
have an id of 4 or 5 mm while narrow bore are half that or less. Packed with
the same materials, the narrow bore column will require less solvent for the
same resolving power since the analytes can be eluted at a lower flow rate,
under 0.5 ml/min, than the 2 to 3 ml/min used for standard bore. Narrow bore
columns are 4 to 6 times more sensitive (b) using the injection volume required
for a standard bore column (a). The eluting analytes can be detected by a
variety of techniques, the most universal being UV-visible absorbance (1)
which, with diode-array (DAD) technology provides spectral confirmation in the
third dimension. Particular analytes have specific physical characteristics
that enable detection based on fluorescence, phosphorescence or
chemiluminescence (2), refractive index or electrochemical HPLC can be coupled
with others analytical methods like HPLC-mass spectrometry (HPLC-MS), HPLC-nuclear magnetic resonance (HPLC-NMR).
3.3.2.2 Introduction to HPLC/MS technique
In its simplest form, MS (mass spectrometry), a technique
used to characterize and separate ions by virtue of their mass/charge
(m/z) ratios can be helpful in structure determination as the
fragmentation can give useful informations about the structure. Mass
spectrometry data from HLPC-MS has two dimensions: Time and Mass. Time
describes the isolated time of molecule (retention time, Rt) and Mass
represents the mass/charge ratios. Mass spectrometry, especially
HPLC/MS/MS, is an important and quite useful technique for the detection,
identification, quantitation and analysis of small pharmaceutical molecules,
peptides, proteins, and oligonucleotides and their metabolites and degradants.
There are several common modes of obtaining mass spectra. These include:
Time-of-flight (TOF), quadrupole, ion trap, magnetic sector, and combinations
of these. Ionization techniques commonly used in biotechnology and
pharmaceutical analysis for non-volatile samples include Matrix-Assisted Laser
Desorption/Ionization (MALDI), Electrospray Ionization (ESI), Inductively
Couple Plasma (ICP), electron capture ionization (ECI), Atmospheric Pressure
Chemical Ionization (APCI) and Fast Atom Bombardment (FAB). Each technique has
its own set of advantages and disadvantages. That is, no one technique will
solve all problems.
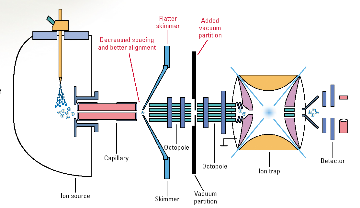
An Agilent1100 Series LC/MSD system consists of an ion trap
mass spectrometer and a HPLC as shown in Figure 4-. The mass spectrometer is
equipped with electrospray (ESI) and atmospheric pressure chemical ionization
(APCI) ion sources and is able to operate in positive and negative ion modes.
Samples can be analyzed by direct injection into the ion source or following
separation using high performance liquid chromatography. Both qualitative and
quantitative analyses are available by using full scan, single ion or selected
reaction monitoring. A variety of tandem mass spectrometry experiments can be
performed with ions produced by ESI and APCI methods (Figure 4-1).
Figure 3-1 Schematic diagramm of Agilent 1100
Series LC/MSD Trap (Agilent Technologies, 2001).
3.3.2.3 HPLC/MS experiments of hemin-artemisinin
compounds interactions
HPLC/MS analysis was performed on LS/MS/MS API 300. The
Column was a 4.6 x 250 mm (5m), SB-C18 Zorbax (Hewlett & Packard,
USA); the open temperature was 30oC. The eluents were A: H2O
adjusted to pH 3.2 by CH3COOH and B: methanol. The following gradient was
applied: from 50 % A and 50 % B to 25 % A and 75 % B within 70 minutes. Flow
elution was 1mL min-1, 20 L of samples were injected.
MS spectra were registered in positive and sometimes
in negative ion mode. The positive MS spectra were performed on an LCQ
electrospray directly coupled to the HPLC.
HPLC/DAD/MS analysis was performed on Agilent 1100
series LC/MSD Trap, under the same work conditions. Except this appliance is
equipped with UV DAD detector and UV-Vis spectra were recorded in the range
200-450nm. Products were detected at 412 nm in order to follow the modification
of the porphyrin chromophore.
All work solutions were mixed under magnetic stirring for 5
min and prepared, daily before each experiment or analysis and protected from
light. 2 M of hydrochloric acid and sodium hydroxide served to adjust the pH of
all solutions. 0.1 M tris (hydroxymethyl)-methylamine was used as buffer for
all solutions. For all HPLC-MS analysis, 1mL of 2 mM DMSO solution of
artemisinin compounds was mixed with 1 mL of 1 mM DMSO hemin solution and
incubated at (37 \u177À1) o C over 10h.
3.4 Data analysis
It is assumed that the interaction between hemin (H) and
antimalarial drug (Q) can be described according to the equilibrium shown
below:
 (3-2)
(3-2)
In diluted solutions, the association constant of
complex K can be written as follows:
 (3-3) (3-3)
and
where  is the concentration of complex and is the concentration of complex and  and and  are the initial concentrations of hemin and drug, respectively are the initial concentrations of hemin and drug, respectively
 (3-4)
(3-4)
 (3-5)
(3-5)
Combining Equations (3-2), (3-3), (3-4) and (3-5), the
resulting quadratic equation can be written as:
 (3-6) (3-6)
One of the roots of the equation (3-6) is given by:
 (3-7) (3-7)
The optical absorption of the system during titration can be
written as:
 (3-8) (3-8)
where A and d are the optical density and
the light path, respectively,  and and  are the molar extinction coefficients of hemin and its complex
solutions. are the molar extinction coefficients of hemin and its complex
solutions.
Combining Equations (3-4) and (3-7), with Equation (3-8), the
following equation is obtained:
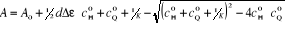 (3-9) (3-9)
Where A0 is the molar extinction of hemin
solution at  =0, and ( = =0, and ( =  - - ) is the difference of the molar extinction coefficients between
hemin complex and free hemin. The basic data are initial concentrations of
hemin ( ) is the difference of the molar extinction coefficients between
hemin complex and free hemin. The basic data are initial concentrations of
hemin ( ) and drug ( ) and drug ( ) and the corresponding optical absorption of hemin (A). With these
data, parameters particularly the equilibrium constant K, can be
fitted according to Eq. (3-9) with the help of Microsoft Origin 6.1 package. ) and the corresponding optical absorption of hemin (A). With these
data, parameters particularly the equilibrium constant K, can be
fitted according to Eq. (3-9) with the help of Microsoft Origin 6.1 package.
Chapter 4 Results and
discussion
4. 1 Choice of the medium
One of the reasons contributed to the conflicting
results reported in the literature about interaction hemin-antimalarial drug
interactions is the inappropriate choice of the working medium. It has been
well shown that the study of Fe(III)PPPPIX in aqueous solution is problematic
because of its tendency to aggregate or dimerize. As can be seen from Figure 7,
the spectra (b) of hemin in alkaline aqueous solution showed a large band from
350 to 400 nm which is attributed to an oxodimere represented as
(H2O)Fe-O-Fe(H2O), whereas hemin was monomeric and exhibited a sharp Soret peak
with a maximum at 396-398 nm (50 % PREG or 50 % EG), at 400 nm (25 % DMSO, 80
% ethanol), at 402 nm (40 % DMSO), at 404 nm (DMSO). The slight shift observed
towards longer wavelength is due to the change of medium.
Practically, propylene glycol mixture presents the same
thermodynamic advantage as ethylene glycol mixture and is much less toxic than
the latter. It was used to study both interaction pairs of hemin-quinoline and
hemin-artesunate. Since Artemisinin and dihydroartemisinin are insoluble in
both propylene glycol and 25 % DMSO, the bonding of hemin with artemisinin
compounds was investigated in 40 % DMSO aqueous solutions. Because of their
density, polarity, wide temperature range of the liquid state and ability to
have bonding hydrogen with water molecules, DMSO and PREG mix easily with
water. Particularly, DMSO is an extraordinarily efficient solvent for many
kinds of substances including both organic and inorganic compounds. The heat of
mixing of DMSO and water indicates there are stronger interactions between DMSO
and water than between DMSO molecules (Yu and Quinn, 1994). At high DMSO
concentrations, water-structure is disrupted due to the formation of the
DMSO-water complexes.
Figure 4-1 Spectra of hemin solutions in
different mediums at 25oC.

The spectrum range from 300 to 500 nm and 250 to
650 nm were selected to study the interactions of hemin-quinoline and
hemin-artemisinin, respectively. This is because the induced spectral
modifications in the presence of the drugs are more significant in this range
than in the remainder of the UV-visible region.
4. 2 Choice of buffers
Tris-HCl buffer was preferred to phosphate buffer because the
latter showed some incompatibilty in terms of solubility (formation of
precipitate) in 40 % DMSO and was not suitable when pH>8, although it was
well used both in 25 % DMSO and water-propylene glycol mixture at pH 7.4.
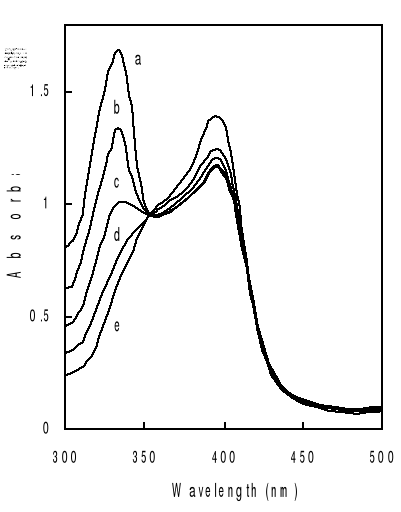
4.3 Binding reaction of hemin with chloroquine, quinine and
quinidine in water-propylene glycol mixture.
More specifically, the wavelength of 396 nm was selected to
determine the constants of complexation because of the greatest variation of
the optical density observed in the presence of the antimalarial drugs.
Titration of hemin by increasing amount of drugs in mixed
water-propylene glycol solutions gives typical spectral changes as exemplified
in Figure 4-2. They are similar to those observed on deuterohemin-quinine,
hemin-chloroquine and hemin-quinine interactions in other mediums
(Constantinidis and Satterlee, 1988; Gushimana et al., 1993, 1996).
The absorption band centered around 332 nm is from the
quinoline derivative and that centered at 396 nm is from hemin. As can be seen
from Figure 4-2, addition of chloroquine drug modifies markedly the hemin
spectrum, but the peak maximums are still at about 396 nm. This indicates that
the complexation does not involve significant modifications on the structure of
the porphyrin ring of the ferriprotoporphyrin IX.
Another feature that can be seen for all the three drugs is
the appearance of an isosbetic point located at around 350 nm on the titration
curves. The experimental data were fitted into a 1:1 complex model as described
mathematically in Eq. (3-9). What are shown in Figure are selected such results
with the total drug concentration as the only changing parameter. It can be
seen that the extinction of the hemin solution decreases with increasing total
drug concentration.
This trend is consistent with previous results and can be
attributed to complex formation between the drug and hemin (Constantinidis and
Satterlee, 1988; Gushimana et al., 1993, 1996).
The solid curves in the figure are fitted data with the
experimental results according to Eq. (3-9). Correlation coefficients of the
nonlinear fittings are better than 0.9, which implies that the titration curves
can be well described by the 1:1 complexation scheme. Similar variation in
absorbance of hemin at 396 nm as function of total drug concentration has been
obtained at other values of pH and the results are also consistent with the
formation of 1:1 complex.

Values of binding constants at various pH obtained from these
titration curves are summarized in Table 4-1. As highlighted by values of
binding constants in Table 4-1, K values are in the same order of
magnitude as those obtained in water-ethylene glycol mixture (Gushimana et al.,
1993, 1996).
Table 4-1 Binding
constant of hemin-drug complexes at various pH.
|
K (105 M)
|
|
pH
|
Hemin-chloroquine
|
Hemin-quinine
|
Hemin-quinidine
|
|
9.0
|
0.170.03
|
0.050.01
|
2.170.43
|
|
8.1
|
0.220.04
|
0.150.03
|
4.170.83
|
|
7.4
|
0.330.06
|
0.110.03
|
1.770.94
|
|
6.8
|
0.400.10
|
0.110.02
|
2.870.92
|
In fact, the complexation of ferriprotoporphyrin IX with the
drug is believed to play the role to bring back the hemin into solution in
order to prevent it from polymerization. The ability of quinoline drug to
complex with hemin will inhibit the formation of hemozoin (-hematin) in vivo.
The drug that has a greater affinity with hemin should maintain more hemin in
solution and is thus more effective. This means that quinidine should have the
highest efficiency, then comes chloroquine, and finally quinine, based on the
data in Table 4-1. But in practical applications, an opposite trend is
observed, probably due to the emergence of new resistant strains of malaria
parasites against the existing and commonly used antimalarial drugs.
As a matter of fact, in some areas (the case in D.R.Congo, for
example) quinine appears more effective than chloroquine. This proves that the
strength of haematin-quinoline interactions does not directly correlate with
antiplasmodial activity. This indicates that haematin binding is a necessary,
but not sufficient requirement for antiplasmodial activity (Egan et al.,
1994).
Scheme 4-1 Structures of three
quinoline-based drugs, quinine (1), quinidine (2) and chloroquine (3).
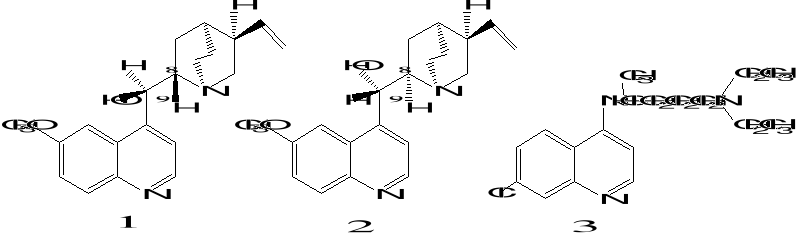
In regard to the molecular basis of the hemin-drug
interactions, rather less is known about the structures of these complexes. In
fact, the complexes between 4-aminoquinolines and hemin are almost certainly
p-p complexes (Egan et al., 1994).
This means that there is an interaction between the aromatic
ring of the quinoline and the porphyrin structure. In addition, hydrophobic
interaction, electronic and steric factors also play important roles in
influencing the structures of such complexes. Results from the present study
show that chloroquine interacts more strongly with ferriprotoporphyrin IX than
quinine does, indicating some additional interaction of the side chain of the
quinoline with Fe(III)PPIX. This finding rejoins the result of Egan and
co-workers which reported the association constants of chloroquine (log
K= 5.52) and quinine (log K= 4.10) in 40% aqueous DMSO at pH
7.5 (Egan et al., 2000). It is suggested that the flexible side aliphatic chain
of the chloroquine structure, which is less crowded than that of the stiff
quiniclidine group of the quinine structure, stabilizes hemin-chloroquine
interaction. It is also supposed also that a hydrogen-bonding interaction
between the side-chain amine group of chloroquine and the heme propionate group
may play a role in the hemin-chloroquine complex stability. More likely, there
may be some direct Van der waals interaction between the side chain of
quinoline and the porphyrin ring. In addition, the stability of these complexes
is supported by computational results. A molecular mechanics study of the
interaction between chloroquine and an iron-porphyrin model for
N-acetylmicroperoxidase-8 revealed a minimum energy arrangement with
coplanar interaction of the quinoline and iron-porphyrin ring, but could not
define a preferred conformation for the complex (Marques, 1996).
It is interesting to note that the conformation of drugs
affects their affinity with hemin. As can be seen from Scheme 1, quinine
differs from quinidine only at positions C-8 and C-9, the former has 8S9R
structure and the latter has 8R9S structure (Ribeiro, 1997). The data showed
significantly different affinity to hemin of the two chiral isomers.
Further more, it can also be seen that K values are
pH-dependent. That dependence is probably due to acido-basic equilibrium
influence on electrostatic interactions between hemin and the drugs. Due to
their different pKa values, reacting partners have different electric
charge at different pH values (Constantinidis and Satterlee, 1988;
Gushimana et al., 1993; Kuhn, 1995).
4.4 Binding reaction of hemin with artemisinin drugs.
![]()
![]()
4.4.1 Binding reaction of hemin with artemisinin,
dihydroartemisinin and artesunate in water-DMSO mixture.
![]()
![]()
Figure 4-4 Spectroscopic changes of
Fe(III)PPIX at Soret band (402 nm) as a function of increasing concentartions
of drug :
0 (a), 1.4 (b), 2.4 (c), 70 (d), 100 (e), 160 M of DHA (f)
after 10 hours,
0 (a), 6 (b), 14 (c), 24 (d), 50 (e), 120 M of DHA (f) after
24 hours,
0 (a), 3 (b), 10 (c), 50 (d), 120 (e), 160 M of AST (f) after
24 hours,
0 (a), 14 (b), 18 (c), 70 (d), 100 (e), 160 M of ART (f) after
24 hours with 40 % DMSO aqueous as solvent and 0.1 M Tris-HCl buffer (pH
9).
Typical spectral changes observed upon hemin-sesquiterne
endoperoxide lactone-based drugs complexation are shown in figure 4-4. They are
similar to those observed on hemin-artesunate and hemin-artemisinin
interactions in other mediums (Berman and Adams, 1997, Bilia et al., 2002).
The wavelength of 402 nm was selected to determine the
constants of complexation. Complex formation was monitored by the decline in
Absorbance (402 nm) whereas absorbance of hemin, incubated with drug, was
essentially unchanged after 24 hrs.
The spectral changes resulting from addition of quinoline
based drug to Fe(III)PPIX and those resulting from artemisinin drug-hemin
interaction are different. The latter shows a substantial hypochromic effect of
the hemin Soret band at 402 nm, accompanied with a red shift of 2-5 nm, whereas
in bonding of hemin with quinoline, the peak maximums are still at about 396nm.
It means that artemisinin and derivatives are auxochromes because their
reaction to hemin leads to red shift, which is clearly apparent after 10 hours.
The new peak around 407nm may belong to the complex.
About the decrease in absorbance of the Soret band of hemin,
two possible processes can be envisaged which would lead to these changes.
Either addition of micromolar concentrations of drug induces aggregation of
hemin or the changes reflect drug association with hemin. While a large
decrease in the absorbance of the Soret band is often an indication of
aggregation, equally large decreases are caused by formation of p-p
(donor-acceptor) complexes (Egan et al., 1997). Generally, spectral changes of
iron porphyrins in the visible region vary depending on the conditions of
solvents and pH and the nature of interacting species. The decrease of hemin
absorbance is dependent on the drug concentration. A dilution experiment showed
that Beer's law is strictly adhered to in the presence of 306 M drug and in the
concentration range 0.99 to 48 M Fe(III)PPIX thus providing no evidence of
hemin aggregation in this concentration range. Thus, the most reasonable
explanation for these spectral changes is the presence of drug-hemin
association. There is another feature on the titration curves of artemisinin
and derivatives, i.e. a quite regular spectral changes over time with a
well-defined isosbetic point around 325 nm. This behaviour is suggestive of an
equilibrium between two species. These spectral modifications suggest a
progressive disruption of delocalised -electron system of the hemin
tetrapyrrole ring. In addition, another band at 290 nm with low intensity was
also observed, the origin of that is unclear at this time. Without drug, the
band of hemin was still unchanged after 24hours.
Typical kinetic analysis of the mixture of hemin plus
artesiminin and derivatives are shown in Figure 9. For example, for 24 M of
drug (at pH 9), the residual intensity of the soret band, compared to the
control (hemin, 100%), is:
after 10h, 84% (ART), 83 % (AST), 59% (DHA)
after 24h, 66% (ART), 57 % (AST), 37 % (DHA)
Figure 4-5 Variation of absorbance at 402 nm
observed when hemin is titrated with artemisinin derivatives (24 M) within 60
hours of observation in 0.1 M Tris buffer (pH 9, 37oC).
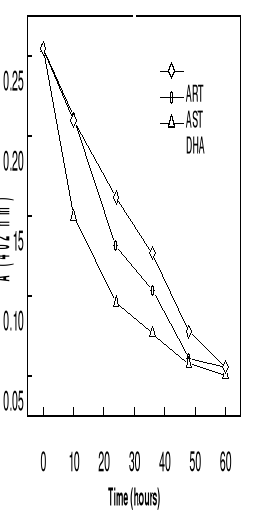
At 37oC, the curves of absorbance-time
relationship for the complexation showed that the time taken to reach
absorbance minimun is shorter for DHA. It was found that the reaction rate is
faster with dihydroartemsinin, followed by artesunate than artemisinin did.
Some typical titration curves have been shown in Figures 4-6
and 4-7.
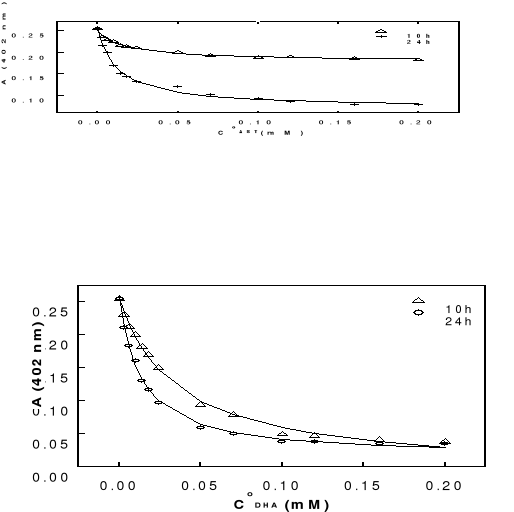
Figure 4-6 Variation in
absorbance of hemin at 402 nm as function of total concentartion of artemisinin
-based drugs after 10 and 24 hours of incubation at 37oC (pH 9).
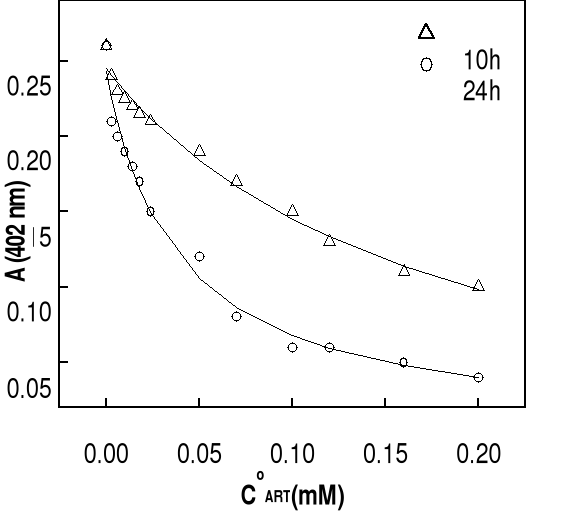
The solid lines are best fits of the data to a 1:1 association
model obtained by nonlinear least-squares analysis. Association constants for
all of the compounds are summarized in Table 4-2. It should be pointed out that
the conditions under which the association constants have been measured are of
course quite different from those in food vacuole of the parasite (pH~ 5.4,
acidic aqueous medium). These are only apparent or conditional association
constants. It can be seen that the extinction of the hemin solution decreases
with increasing in total drug concentration. Generally, at drug concentrations
smaller than 50 M (molar ratio hemin / drug =1:17), there is a significantly
and progressive decay in Soret absorbance, more perceptible in the case of DHA.
At highest concentrations of drug (molar ratio hemin / drug 1: 25), this
decrease is less significant, indicating the saturation of drug binding to
heme. Correlation coefficients of the non linear fittings are better than 0.9,
which implies that the titration curves can be well describes by the 1:1
association between drug and Fe(III)PPIX. Similar variation in absorbance of
hemin at 402 nm as function of total drug concentration has been obtained at pH
7.4 and the results are also consistent with the formation of 1:1 complex.
Values of binding constants at related pH obtained from these titration curves
are summarized in Table 4-2.
Figure 4-7 Variation in
absorbance of hemin at 402 nm as function of total concentration of
artemisinin-based drugs after 24 hours of incubation at 37oC (pH
9).
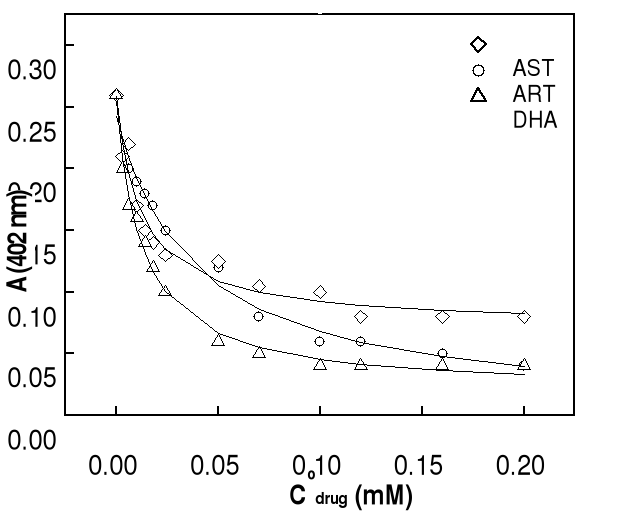
Table 4-2 Binding constant
of hemin-drug complexes in 40 % DMSO, pH 9,
0.1M Tris-HCl buffer
|
pH
|
K (105 M)
|
|
Hemin-DHA
|
Hemin-AST
|
Hemin-ART
|
|
10 hrs
|
24 hrs
|
10 hrs
|
24 hrs
|
10 hrs
|
24 hrs
|
|
9
|
0.28 0.03
|
0.76 0.06
|
0.65 0.15
|
0.82 0.07
|
0.06 0.02
|
0.26 0.04
|
|
7.4
|
-
|
-
|
0.37 0.06
|
0.65 0.05
|
-
|
-
|
4.4.2 Binding reaction of hemin with artesunate in
water-propylene glycol mixture.
10 hrs
![]()
Because of insolubility of artesiminin and dihydroartemisinin
in water-propylene glycol mixture, we only reported the bonding reaction of
hemin with artesunate in this medium. Figure 4-8 shows typical spectral changes
observed when hemin is titrated with artesunate. The wavelength of 398nm was
selected to determine the constants of complexation. The main spectroscopic
changes consist of a red shift of about 3-4 nm and a decrease in intensity of
the Soret band. In addition, the spectra of artesunate showed another
absorption peak at 290 nm, already observed in DMSO aqueous medium. The
titration curves showed, in the range 250-650 nm, a quite regular spectral
change over time with a well-defined isosbetic point around 330 nm.

Figure 4-8 Spetroscopic changes of
Fe(III)PPIX Soret band (398nm) as a function of increasing concentartions of
drug :
AST (10 h): 0 (a), 1.4 (b), 2.4 (c), 70 (d), 120 (e), 160 M
of AST (f) after 10 hours,
AST (24 h): 0 (a), 6 (b), 14 (c), 50 (d), 70 (e), 160 M of
AST (f) after 24 hours with water-propylene glycol mixture as solvent and 0.1 M
Tris-HCl buffer (pH 9).
24 hrs
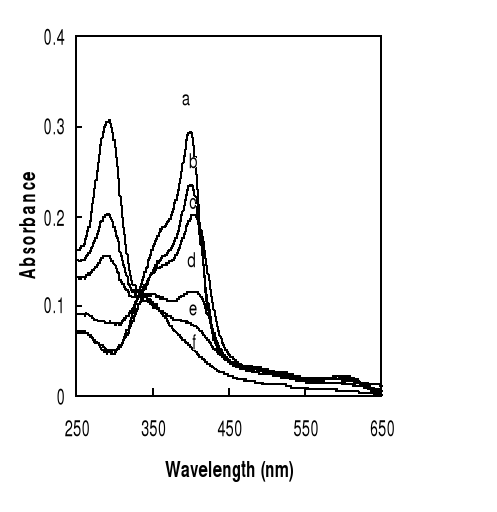
Similar variation in absorbance of hemin at 402 nm as function
of total drug concentration has been obtained at pH 7.4 and the results are
also consistent with the formation of 1:1 complex as shown in Figure 4-9.
Figure 4-9 Variation in absorbance of hemin
at 398 nm as function of total concentration of artesunate (pH 9) after 10 or
24 hours of incubation at 37oC.
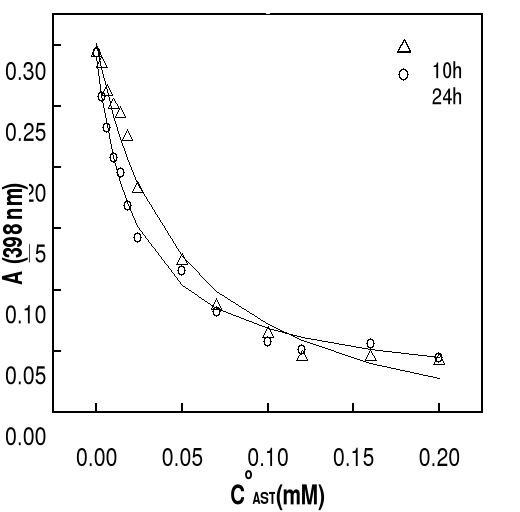
Values of binding constants at related pH obtained from these
titration curves are summarized in Table 4-3.
Table
4-3 Binding constant of hemin-drug complexes in water-
propylene glycol at pH 9, in 0.1M
Tris-HCl buffer.
|
pH
|
K ( 105 M)
|
|
Hemin-artesunte
|
|
10 hrs 24hrs
|
|
9.0
|
0.21 0.04
|
0.43 0.06
|
|
7.4
|
0.33 0.07
|
0.60 0.08
|
In the light of above results, we observed that fixing the
concentration of hemin at 3 M and varying drug from 0 to 200 M, the Soret band
of hemin decreased. Along with the increase in incubation time and drug
concentration, it arises a new peak centred at 290 nm, indicating that the peak
belongs to artemisinin compounds. The origin of which is unclear at this time
but we suggested that it is a decomposed product of artemisinin as a result of
reaction between hemin and drugs. The spectral propriety of this product with
strong absorbance is similar to that observed by Green and co-workers (Green et
al., 2000) caused by alkali decomposition of ART. They called it ARTS 290 and
have described this compound as an enolate/carboxylate. Enolates readily couple
to electrophilic dyes such as diazonium salts (Zollinger, 1991), therefore it
is possible that
Figure 4-10. Spectral
changes of the alkali decomposition product of 0.001 M artesunate to 1 M NaOH
after 20 min.
![]()
the alkali decomposition product of ART may be similar in
structure. In order to verify this assertion, we mixed 0.001 M of AST with 1M
of NaOH at room temperature for 20 min. We observed exactly a peak at 290 nm,
which has the same characteristic of ART 290 as shown in figure 4-10.
It has been postulated that the interaction of artemisininn
with the target heme or hemin in vivo proceeds through the complexes, in which
the peroxide bridge of trioxanes coordinates with the iron of hemin, leading to
the formation of drug-hemin adduct.
This long-lived intermediate has the spectral characteristics
of a heme peroxide (Berman and dams, 199)] compound analogous, in which the
hemin is covalently bound to artemisinin via a iron-oxygen-carbon bond, formed
by attack of the iron center on the endoperoxide group of drug. This metastable
species gradually decays over the ensuing (24 hours for drug highest
concentration or 48 hours for drug lowest concentration), to final product
devoid of Soret absorbance, indicative of disruption of the heme tetrapyrrole
ring system.
Based on data in Tables 4-2 and 4-3, AST should have greater
affinity with hemin, then DHA and finally ART. In regard to their constants
bindings values, AST and DHA should have the highest efficiency than ART.
Practically, it has been shown that artemisinin derivates are at least five
times higher than artemisinin. In regard to their molecular structure (Scheme
4-2) it is probably that succininic group of artesunate interacts with hemin
propionic group via intra-molecular hydrogen bonding and make this bonding
stronger than that of artemisinin does. In addition, in vivo metabolism,
artemisinin and derivatives (artesunate, arteether, artemether) are hydrolyzed
mainly to the active derivative DHA. DHA, a first generation analogous and
metabolite of ART, is known with artesunate to be therapeutically more active
than artemisinin (China Cooperative Research Group, 1982, Kamchonwongpaisan and
Meshnick, 1996). It was demonstrated too by analyzing the reaction products of
DHA plus hemoglobin and of DHA plus globin, DHA reacted rapidly with hemoglobin
(as shown in spectral changes in Figure 4-4) but not with globin. This may be a
major reason for fast action of these drugs compared to quinoline
antimalarials. This is supported equally by the binding constants values
(calculated in water propylene glycol mixture) of artesunate (0.43) which are
higher than chloroquine (0.17) and quinine (0.05) do. In pratical applications,
a similar trend is observed because artemisinin compounds are now at the top of
list of new antimalarial drugs in terms of efficacy, rapidity of action and
first order pharmacokinetic against chloroquine -resistant strains of
plasmodium.
Our results showed that the physical property of the medium of
reaction affects the rate of interaction between hemin and drug. We supposed
that because of the weak dielectric constants of DMSO and PREG compared to that
of water, the bonding constant values of the related artemisinin drug would be
more greater in aqueous medium.
Water solubility of artesunate may be due to the presence of
succinc group, which increases its polarity make it distinct from other
derivatives. DMSO which is highly polar aprotic solvent, with negligible
hydrogen bond donation compared to water, may be solvate artesunate anion
only through ion-dipole interactions. Less an anionic ligand is
solvated, the more readily the complex is formed. From literature, it is known
aprotic dipolar solvent permit good complexation while allowing also reasonable
solubility of the reacting species (Marcus, 1999). Then, artesunate could
coordinate strongly with hemin. The structure of artemisinin-hemin complexes
are not well known, may be they are transfert-charge complexes.
In water-DMSO mixture, the binding of hemin to artesunate is
better than that in water-propylene glycol. In fact, the propylene glycol, with
high viscosity, may be decrease significantly the reactivity of artesunate in
this medium than water-dimethyl sulfoxide does.
The interaction of hemin and artemisinin compounds is
supported too by molecular mechanic calculations. The molecular electrostatic
potentiel (MEP) of artemisinin showed that it has two main region with negative
potential which may interact with the positively charged iron ion of the heme,
one of these regions covers endoperoxide oxygen O1 and O2 whereas the other
encompasses the carboxyl oxygen atom 011 and O14 (Scheme 2-2). This suggests
that electrostatic interaction between artemisinin and heme can involve large
part of the artemisinin structure. However, the carboxyl and peroxide oxygen
atoms, which been the most electronegative part of molecule, will probably be
more competitive for complexation (Shukla et al., 1995). In addition,
Tonmunphen and co-workers reported automated molecular docking of artemisinin
to heme. The docking between artemisinin and heme indicated that artemisinin
approaches heme by pointing O1 at the peroxide linkage toward the iron center,
a mechanism that is controlled by steric hindrance whith a lowest binding
energy of -33.13 kcal.mol-1 (Tonmunphen et al., 2001, Taranto et
al., 2001). This is probably due to pyramidal geometry of hemin (where iron is
out of the main plan formed by the four pyrrole N atoms) which facilitates the
approach of Fe to the endoperoxide moiety.
4.4.3 HPLC/MS analysis of hemin-artemisinin based
drugs interaction
As already reported by some researchers, artemisinin reacts
with heme (FeII) but do not react with metal (III) porphyrins (like
hemin (FeIII), (MnIII) tetraphenylporphyrin (
Robert
et al., 1997, Cazelles, 2001; Robert et al., 2002).
Based on the findings of Bilia and co-workers (Bilia et al.,
2002) who reported formation of two isomers artemisinin-hemin covalent adduct
in DMSO solutions and based on the fact that, so far most of the reported
information center on artemisinin, studies on artesunate and dihydroartemisinin
are few. Then, we have proposed to investigate the formation of supramolecular
adducts between artemisinin derivatives like artesunate and dihydroartemisinin)
by HPLC/MS and HPLC/DAD/MS spectrometry using DMSO solutions incubated at
37oC over 12 h period. The structures of hemin and related
artemisinin drugs are represented in Scheme 4-2. For the HPLC/MS analysis,
0.002 M DMSO solutions of drugs and 0.001 M DMSO solutions of hemin were used.
The reported results showed that hemin and drug slowly react to give rise to
supramolecular adducts. Hemin no mixed to drug showed a peak with a retention
time (Rt) of 38.95 min. His MS spectra is characterized by the molecular mass
of 616.5 m/z (M+-35.5) corresponding to fragment with loss of
chloride atom as shown in figure 4-10. After drug addition, we found a
chromatographically similar product with an apparent molecular mass close to
the theoretical value of 898 (for ART), 900.5 (for DHA), 1000.5 (for AST),
indicating a 1:1 heme-artemisinin compounds adduct. In the case of artesunate,
three more peaks with Rt 41.26, 49.37, and 53.23 min. Their MS spectra were
similar and characterized by four fragments at 1000.5, 940.5, 882.5 and 822.4
m/z as shown in figure 4-11. The first corresponding exactly to a
supramolecular complex, result of addition of artesunate (m/z=384.4) with hemin
(m/z=616.3). The three latter corresponding to the covalent adducts between a
modified artemisinin and hemin without extensive degradation of both partners.
[M+-60= 940.5] corresponds to an adduct with
likely loss of CH3COOH, [M+-118=882.5] to an adduct with
loss of HO2C(CH2)2CO2H (succinic
acid) as expected from succinate containing molecule (case of artesunate).
[M+-178= 882.5] corresponds to an adduct with both loss of
CH3COOH and
HO2C(CH2)2CO2H. These data
evidenced the presence of three supramolecular complexes represented by three
isomers.
Artesunate
Dihydroartemisinin Artemisinin
  
Scheme 4-2 Structures
of hemin and related artemisinin based drugs.
Hemin

Figure 4-10 HPLC-MS spectra of hemin.

Figure 4-11 HPLC-MS spectra of
artesunate-hemin complex

We have the similar results with dihydroartemisinin. The
HPLC/DAD/MS spectra analysis of DHA showed two kind of peaks: one with Rt 33.5
(m/z=616.5) corresponding to hemin spectra and another peaks with Rt 42.1;
46.6; 51.2; 54.8; 61.1; 64.1; 69.8; 75.7 min. These eight latter have all
similar MS spectra and exhibited one intense peak at m/z = 840 m/z. These
peaks are attributed to dihydroartemisinin-hemin adduct, resulting from
addition of DHA (m/z=284.4) with hemin (m/z=616.3) followed with loss of a
fragment of 60 m/z most likely due to loss of CH3COOH as expected
for an acetate containing molecule. These data evidenced the presence of eight
supramolecular complexes represented by eight isomers (appendix 2).
Paradoxically to the findings of Bilia et co-workers, we
identified seven isomeric hemin-artemisinin covalent adduct with retention time
at 37.9; 39.4; 41.2; 42.5; 45.6; 47and 48.6 min as shown at figure. The
molecular peak was detected at m/z=838.8 (M+), corresponding to the
expected mass for an adduct hemin (m/z=616.5)/artemisinin (m/z=283.3) which,
lost a fragment of acetic acid molecule within the mass spectrometer (appendix
3).
Consequently, we supported that, both hemin and heme can react
with endoperoxide lactone based drugs. Based on literature, it seems heme
reacts more quickly with artemisinin compounds than hemin does. But, ours
findings suggest that it is useful in the understanding of mechanism of action
artemisinin drug to always take account of that hemin which, is metal (III)
porphyrin can form with those drugs adduct products.
Chapter 5 Conclusion
To sum up, from this study we draw conclusions as follows:
Hemin, product of hemoglobin degradation in vacuole food of
parasite, interacted both with quinoline and artemsinin compounds. The major
advantage of water-propylene glycol and water-DMSO mixture is that hemin still
monomeric and, under these conditions, interpretation of results is not
complicated. Both quinoline and artemisinin drugs- hemin complexes exhibited
1:1 stoechiometry. It was found that water-propylene glycol is suitable for
hemin-quinolines interactions whereas aqueous DMSO solution is suitable
studying hemin-artemisnin interaction. For quinoline based drugs, the results
indicated that hemin complexed more strongly with quinidine than with
chloroquine and quinine, and the binding constants were pH-dependent. Because
of lack of quantitative data, about the bonding of hemin with endoperoxide
lactone based antimalarial drugs, we focused our investigation in it.
Artemisinin and derivates were studied by UV and HPLC/DAD/MS analysis for their
reactivity with hemin. The reported results showed that hemin and endoperoxide
lactone derived antimalarials slowly react to give rise to several
stereoisomers supramolecular adducts (three for artesunate, seven for
artemisinin and eight isomers for dihydroartemisinin) while many studies
certified that metal (III) porphyrins react poorly with those drugs. Generally,
hemin (FeIII) is firstly reduced to heme (FeII) in the
presence of reducing agent like glutathione (in high concentration in
erythrocytes)[Robert et al., 2002], secondly the resulting heme will react with
artemisinin drug. Thermodynamic data supported too our results and showed that
artesunate and dihydroartemisinin interacted more strongly with Fe (III) PPIX
that artemisinin did. Then, it must be considered too that Fe (III) PPIX should
be a potentiel target of artemisinin derived drugs.
It is already known that active endoperoxides react with
porphyrins while inactive ones do not, suggesting that this reaction may be
important in parasite. In the light of preview researches, we suggest that in
vivo, artemisinin and derivatives diffuses into the food vacuole, where its
reacts with newly formed monomere heme (released from digested hemoglobin) or
hemin to generate whether a covalent heme-artemisinin or whether a covalent
hemin adduct. This long-lived intermediate may ultimately participe, via
C4-centred alkylating radical, in the oxidative damage of membrane, which is
lethal for the malaria parasite. The full characterization of a covalent
artemisinin-hemin adduct is a key in the understanding of the mode of action of
this antimalarial drug, the lead molecule for the rational design of cheap and
highly efficient endoperoxide-containing molecules against the
chloroquine-resistant strains. Thus due to the high sensitivity, simplicity and
feasibility of the two analytical methods should be considered a rapid and
inexpensive approach in the search for new lead compounds having an
antimalarial activity similar to that of artemisinin. These methods can be
considered as widespread analysis techniques in the search of false
artemisinin, artesunate and dihydroartemisinin drugs on the market.
Recommandations:
Since DMSO solutions are a suitable medium of
hemin-artemisinin adduct formation, we recommend to produce this adduct in high
yield under optimal experimental conditions. Then, the artemisinin adduct
products will be separated by reverse HPLC, isolated and his different isomers
characterized for future parasitologic essay.
The structure of those isomers can be elucidated by R-X
diffraction, or by NMR spectroscopy. But because of paramagnetic character of
artemisinin-hemin adduct with Fe (III), some precautions will be taken, like
the demetallisation of those adducts.
As physiological medium is aqueous medium, it is suitable to
find the experimental optimal conditions in aqueous medium will permit both to
control the dimerization of hemin and take account of solubility of
antimalarial drugs. In the future, we suggest also:
-To study the artemisinin-drug interaction at food vacuole
pH of plasmodium in the used medium.
-To investigate the bonding of hemin with artemisinin based
drugs in presence of glutathione (reducing agent present in high concentration
in erythrocytes).
-To identify exactly the structure and the nature of the ART
290.
-To investigate by two-dimensional infrared correlation
spectroscopy the nature of interaction between artemisinin of drug and hemin.
Acknowledgements
I am very grateful to Prof. Dr Yu Zhi Wu for the supervision
of this research. His helpful suggestions, comments, and scientific
instructions were very benefit for the planning and the conduct of this
study.
I would like to thank professors Xing Zhi, Yang Cheng Dui, Li
and Guo An of Tsinghua Analysis Center for their wonderful cooperation.
I thank also Prof. Dr Yav Gushimana, Dr Mpiana and Nlandu of
Kinshasa Univerity for their fruitful collaboration.
I am thankful for our group meeting members four their
friendly assistance in my working and living.
I acknowledge all the Chemistry Department members and the
foreign students office for their hospitality.
I wish to express acknowledge to the Chinese Scholarship
Council for the financial support of this research.
I am pleased to thank my wife Agnes Tshombo K. and my daughter
Ketsia Mavakala for their love and affection and to them, I dedicate this
work.
Glory, honor and majesty forever to the only wise
God through Jesus Christ.
References and notes
[ 1] Acton N, Klayman D L, Rollman I J.
Reductive electrochemical HPLC assay for artemisinin (qinghaosu). Planta Med.,
1985, 51: 445~446.
[2] Adams P A, Berman P A, Egan T J et al. The iron
environment in heme and heme-antimalarial complexes of pharmacological
interest. J. Inorg. Biochem., 1996, 63: 69~77.
[3] Basilico N, Monti D, Olliaro P, Taramelli D. Non iron
porphyrins inhibit -haematin (malaria pigment) polymerization. FEBS Lett.,
1997, 409: 297~299.
[4] Berman, P A., Adams P A. Artemisinin
enhances Heme-catalyse oxidation of lipid membranes. Free Radical Bio.
Med., 1997, 22: 1283~1288.
[5] Bray P G et al. Access to hematin: the basis of
chloroquine resistance. Mol. Pharmacol., 1998, 54:170~179.
[6] Cazelles J, Robert A, Meunier B. Alkylation of heme by
artemisinin, an antimalarial drug, C.R. Acad.Sci.Paris, 2001, 4:
85~89.
[7] Chen Y, Zhu S M, Chen H Y. Study on the Electrical
Behaviors of Artemisinin ( qinghaosu) and its Derivates II: Reduction
Mechanism of Artemisinin in the presence of Hemin. J. Peking Univ. (Acta Sci.
Nat.) 2001, 37: 255~259.
[8] China Cooperative Research Group on Qinghaosu and its
derivatives as antimalarials. J. Trad. Chin. Med.,
1982, 2: 3.
[9] Choi C, Schneider E L, Kim J M et al. Interference with heme
binding to histidine-rich protein-2 as an antimalarial strategy. Chem. Biol.,
2002, 9: 881~889.
[10] Chou A C, Chevli R, Fitch C D Ferriprotoporphyrin IX,
fulfills the criteria for identification as the chloroquine receptor of malaria
parasites. Biochem. 1980, 19:1543~1549.
[11] Constantinidis I, Satterlee J D. UV-Visible and
carbon NMR studies of chloroquine binding to urohemin I chloride and
uroporphyrin I in aqueous solution. J. Am. Chem. Soc., 1988, 110: 4391~4395.
[12] Cointeaux L, Berrien J F, Peyrou V et al. Synthesis and
antimalarial activity of 2-methoxyprop-2-yl peroxides derivatives. Bioorganic
& Medicinal Chemistry Letters, 2003, 13: 75~77.
[13] Dechy-Cabaret O, Benoit-Vical F, Robert A et al.
Preparation and antimalarial activity of trioxaquine, new modular molecules
with trioxanes skeleton linked to a 4-aminoquinoline, Chem. Bio. Chem., 2000,
1: 281~283.
[14] Dechy-Cabaret O, Robert A, Meunier B. Synthesis and
stereochemical study of a trioxaquine prepared from
cis-bicyclo[3.3.0]octane-3,7-dione. C. R. Chimie, 2002, 5: 297~302.
[15] Dechy-Cabaret O, Benoit-Vical F, Robert A et al.
Synthesis and biological evaluation of a new trioxaquine containing a trioxane
moiety obtained by halogenocyclisation of a hemiperoxyacetal. C. R. Chimie,
2003, 6:153~160.
[16] Dorn A, Stoffel H, Matile H et al. Malaria
haemzoin/-haematin supports haem polymerization in the absence of protein.
Nature, 1995, 374: 269~271.
[17] Dhingra V K, Rao V and Narasu M L, Current status of
artemsinin and its derivates as antimalarial drugs. Life Sciences, 2000, 66:
279~300.
[18] Dorn A, Vippagunta S R, Matile H et al. Comparison and
analysis of several ways to promote heamatin (haem) polymerization and an
assessment of its initiation in vitro, Biochem. Pharmacol., 1998, 55:
737~747.
[19] Dzekunov S M et al. Digestive vacuolar pH of intact intra
erythrocytic P. falciparum either sensitive or resistant to
chloroquine. Mol. Biochem. Parasitol., 2000, 110: 107~124.
[20] Egan T J, Hempelmann E, Mavuso W W. Characterization
of synthetic -haematin and effects of the antimalarial drugs quinidine,
halofantrine, desbutylhalofantrine and mefloquine. J. Inorg. Biochem., 1999,
73: 101-107.
[21] Egan T J, Marques H M. The role of haem in the activity
of chloroquine and related antimalarial drugs. Coordination Chemistry Reviews,
1999,190: 493~517.
[22] Egan T J, Ross D C, Adams P A. Quinoline antimalarial
drugs inhibit spontaneous formation of beta-hematin (Malaria pigment). FEBS
Lett., 1994, 352: 54~57.
[23] Egan T J, Ross D C, Adams P A. The mechanism of action of
quinolines and related antimalarials drugs. S. Afr. J. Sci., 1996, 92:
11~14.
[24] Egan T J, Hunter R., Kaschula C H et al.
Structure-Function relationships in aminoquinolines: effects of amino and
chloro groups on quinoline-hematin complex formation, inhibition of
beta-hematin formation and, antiplasmodial activity. J. Med. Chem., 2000, 43:
283~291.
[25]
Egan
T J,
Mavuso
W W,
Ross
D C et al. Thermodynamic Factors Controlling the Interaction of Quinoline
Antimalarial Drugs with Ferriprotoporphyrin IX,
J. Inorg.
Biochem., 1997, 68: 137~145.
[26] Egan T J. Discovering Antimalarials: a New Strategy.
Chemistry and biology, 2002, 9: 852~853.
[27] Eggleson K K, Duffin K L, Goldberg D E. Identification
and characterization of falcilysin, a metallopeptidase invovled in hemoglobin
catabolism within the malaria parasite Plasmodium falciparum. J. Biol. Chem.,
1999, 274: 32411~32417.
[28] Enserink M. Ecologists See Flaws in Transgenic Mosquito.
Science, 2002, 297: 30~31.
[29] Flaminia C H, Godfray C J, Crisanti A. Impact
of Genetic Manipulation on the Fitness of Anopheles stephensi Mosquitoes.
Science, 2003, 299: 1225~1227.
[30] Feustel, D. MS Thesis, Koln University,
Koln, 1984.
[31] Fitch C D, Chou A C. Heat-labile and heat-stimulable heme
polymerase activities in Plasmodium berghei. Mol. Biochem. Parasitol., 1996,
82: 261
[32] Fidock D A et al. Mutations in the
P.falciparum digestive vacuole transmembrane protein PfCRT and
evidence for their role in chloroquine resistance. Mol. Cell, 2000, 6:
861~871.
[33] Foley, M. and Tilley, L. Quinoline antimalarials:
mechanisms of action and resistance and prospects for new agents.
Pharmacol. Ther., 1998, 79: 55-87.
[34] Francis S E et al. Hemoglobin metabolism in the
malaria parasite Plasmodium falciparum. Annu. Rev.
Microbiol.,1997, 51: 97~123.
[35] Fulzele D P, Sipahimalani A T, Heble M R. Tissue cultures
of Artemisia annua: organogenesis and artemisinin production. Phytother. Res.,
1991, 5:149~153.
[36] Geary T G et al. Uptake of [3H] chloroquine by
drug-sensitive and -resistant strains of the human malaria parasite Plasmodium
falciparum. Biochem. Pharmacol.,1986, 35: 3805~3812.
[37] Gong D H, Li J F, Yuan C Y New and Facile Synthesis of
6-Methyl-2-trifluoromethy1-4- (O, O-dialkyl)phosphoryl-quinoline Chin. J.
Chem. 2001, 19:1263.
[38] Gushimana Y, Doepner B, Martinez-H E et al. Kinetics of
quinine-deuterohemin binding. Biophys. Chem., 1993, 47: 153~162.
[39] Gushimana Z Y, Mpiana P T, Tshilanda D D. Etude de la
complexation de la ferriprotoporphyrine IX avec la quinine et la chloroquine
dans le melange eau-ehyleneglycol 50%. Ann. Fac. Sci. Kinshasa, 1996,
2: 145~154.
[40] Green M D, Mount D L, Wirtz R A, White N J. A
colorimetric field method to assess the authenticity of drugs sold as the
antimalarial artesunate. J. Pharm. Biomed. An., 2000, 24: 65~70.
[41] Haley T J, Berndt W O. Handbook of Toxicology, Harper
& Row Pub., New-York, 1987.
[42] Hawley S R., Bray P G, Mungthin M et al., Relationship
between antimalarial drug activity, accumulation, and inhibition of heme
polymerization in plasmodium falciparum in vitro. Antimicrob. Agents
Chemother., 1998, 42: 682~686.
[43] Haynes R K, Pai H H O, Voerste A. Ring opening of
artemisinin (qinghaosu) and dihydroartemisinin and interception of the open
hydroperoxides with formation of N-oxides -a chemical model for antimalarial
mode of action. Tetrahedron Lett., 1999, 40: 15~18.
[44] Hien T T, White N J, Qinghaosu. Lancet, 1993,
34: 603~608.
[45] Hoffman S L. Artemether in severe malarias still too many
deaths. New Engl. J. Med. 1996, 335: 124~126.
[46] Hofneiz W, Burgin H, Gocke E et al. Ro
42-1611(arteflene), a new effective antimalarial:chemical:structure and
biological activity. Trop. Med. Parasitol., 1994, 45: 261~265.
[47] Homewood C A et al. Lysosomes, pH and the anti-malarial
action of chloroquine, Nature, 1972, 233: 50~52.
[48] Hyde J E. Mechanism of resistance of plasmodium
falciparum to antimalarials drugs. Microbes and infections, 2002, 4:
165~174.
[49] Jefford C W, Favarger F, Vicente M., Jacquier Y. The
decomposition of cis-fused cyclopenteno-1, 2, 4-trioxanes induced by ferrous
salts and some oxophilic reagents. Helv. Chim. Acta, 1995, 78: 4521~458.
[50] Jiang H L, Chen K X, Tang Y et al. Quantum chemical
studies on antimalarial of artemisinin (qinghaosu) derivatives. Chin. J. Chem.,
1995, 13: 131.
[51] Kamchonwongpaison S, Chandrangam G, Avery M A et al.
Resistance to artemisinin of malaria parasites (plasmodium falciparum infetcing
-thalasemic erythrocytes in vitro.Competition in drug accumulation with
uninfected erythrocytes. J. Clin. Invest., 1994, 93: 467~473.
[52] Kamchonwongpaisan S, Meshnick S R, the mode of action the
antimalarial artemisinin and its derivates. Gen. Pharmac., 1996, 27: 587~592
[53] Kannan R., Dinkar S, Chauhan V S Heme -artemsinin Adducts
are crucial mediators of the ability of artemisinin to inhibit heme
polymerization. Chemistry and Biology, 2002, 9: 321~332
[54] Kaschula C H, Egan T J, Hunter R. et al. J. Med.
Chem.2002, 45, 3531~3539
[55] Klayman, D. L. Qinghaosu (artemismin): An antimalarial
drug from China. Science, 1985, 228: 1049~1055
[56] Krogstad, D. J.; Schlesinger, P. H.; Gluzman, I. Y.
Antimalarials increase vesicle pH in plasmodium falciparum, J. Cell Biol. 1985,
101: 2302.
[57] Kuhn, S. Ph.D. Dissertation, Koln University, Koln, 1995.
[58] Lian Z, Zhou W S, Xu X.X A new sesquiterpene peroxide
(yingzhaosu D) and sesquiterpenol (yingzhaosu) from Artabotrys uncinatus (L.)
Merr. J. Chem. Soc. Chem. Comm., 1988: 523~524.
[59] Macreadie I G, Hagai G, Worachart S et al. Antimalarial
drug development and new drug targets. Parasitology Today, 2000, 16:
438~444.
[59] Marques H M, Voster K, Egan T J. The Interaction of the
Heme-Octapeptide, N-Acetylmicroperoxidase-8 with Antimalarial Drugs: Solution
Studies and Modeling by Molecular Mechanics Methods. J. Inorg. Biochem.,
1996, 64: 7~23.
[60] Marcus Y. The properties of solvents, John Wiley &
Sons, Inc; Vol.4, New York, 1999.
[62] Mavakala B K and Gushimana Z Y, Contribution a l'etude
de la denaturation de la methemoglobin: influence de la force ionique, memoire,
Kinshasa University, 1991.
[63] Meshnick S R. Artemisinin: mechanisms of action,
resistance and toxicity, International Journal for Parasitology, 2002, 32:
165~1960.
[64] Meshnick S R, Yang Y Z, Lima V et al. Iron-dependent free
radical generation from the antimalarial agent artemisinin (qinghaosu).
Antimicrob. Agents Chemother., 1993, 37: 1108~1114.
[65] Meshnick S R, Jefford C W, Posner G H et al. Second
generation antimalarial endoperoxides. Parasitology Today, 1996, 12: 79~82.
[66] Meshnick S R., Thomas A., Ranz A et al. Artemisinin
(qinghaosu): the role of intracellular hemin in its mechanism of antimalarial
action. Mol.Biochem. Parasitol., 1991, 49: 181~189.
[67] Monti D. et al. Does chloroquine really act through
oxidative stress? FEBS. Lett. 2002, 522: 3~5.
[68] Moreau S, Perly B, Chachaty C et al A nuclear magnetic
resonance study of the interactions of antimalrial drugs in with porphyrins.
Biochem.Biophys.Acta, 1985, 840: 107~116.
[69] Moreau S, Perly B, Biguet B. Interactions de la
chloroquine avec la ferriprotoporphyrine IX. Biochimie, 1982, 64:1015~1020.
[70] Niessen WM A, Liquid Chromatography-Mass Spectrometry,
2d Ed., Vol. 79, Marcel Dekker, Inc, New York, 1999.
[71] Pagola S, Stephens P W, Bohle D S et al. The structure of
malaria beta-haematin. Nature, 2000, 404: 307~310.
[72] Pandey A V, Singh N, Tekwani B L et al. Assay of
ß-hematin formation by malaria parasite. J. Pharm. Biomed. Anal., 1999,
20: 203~207.
[73] Pandey A V, Tekwani B L, Singh R L et al. Artemisinin, an
endoperoxide antimalarial, disrupts the hemoglobin catabolism and heme
detoxification systems in malarial parasite. J. Biol. Chem, 1999, 274,
19383~19388.
[74] Pandey A V, Bisht H, Babbarwal V K et al. Biochem. J.,
2001, 355: 333~338.
[75] Pras N, Visser J F, Batterman S et al Laboratory
selection of Artemisia annua L. for high artemisinin yielding types. Phytochem.
Anal., 1991, 2: 80~83
[76] Pennisi E., Closing In on a Deadly Parasite's Genome.
Science, 2000, 290:439.
[77] Posner G H, Wang D, Cumming J N et al. Further evidence
supporting the importance of and the restrictions on a carbon-centered radical
for high antimalarial activity of 1,2,4-trioxanes like artemisinin. J. Med.
Chem., 1995, 38: 2273~2275.
[78] Sherman I W, Metabolism, In: W.H.G. Richards (Eds.),
Antimalarial Drugs I, Springer, Berlin, 1984, p.31.
[79] Singh N P and Lai H Selective toxicity of hydroartemsinin
and holotransferrin toward human breast caner cells. Life Sciences, 2001, 70:
49~56.
[80] Shukla K L, Gund T M, Meshnick S R. Molecular modeling
studies of the artemisinin (qinghaosu)-hemin interaction: docking between the
antimalarial agent and its putative receptor. J. Mol.Graph., 1996, 13:
215~222.
[81] Skoog D A, Holler FJ, Nieman T A, Principles of
instrumental analysis, 5th ed., Harcourt Brace College Publishers,
London, 1998.
[82] Slater A F G, Chloroquine: Mechanism of drug action and
resistance in plasmodium falciparum,. Pharmacol. Ther., 1993, 57: 203~235.
[83] Slater A F G, Cerami A., Inhibition by chloroquine of a
novel haem polymerase enzyme activity in malaria trophozoites, Nature 1992,
355: 167~169.
[84] Spiller D G, Bray P G, Hughes R H et al. The pH of the
Plasmodium falciparum digestive vacuole: holy grail or dead-end trail? Trends
Parasitol., 2002, 18: 441~444.
[85] Taubes G. Searching for a Parasite's Weak Spot, Science,
2000, 290: 434~437.
[86] Taranto A G, Carneiro J W M., Oliveira F G et al. The
role of C-centered radicals on the mechanism of action of artemisinin. Journal
of molecular structure (theochem), 2002, 580: 207~215.
[87] Taranto A G, Carneiro J W M, Oliveira F G, MND/d
calculations on the interaction between artemisinin and heme, ournal of
molecular structure (theochem) 2001, 539: 267~272.
[88] Tonmumphean S, Parasuk V. Automated calculation of
docking of artemisinin to heme. J. Mol. Model., 2001, 7: 26~33.
[89] Trigg P I, Kondrachine A V. In Malaria. Parasite biology,
pathogenesis and protection; Sherman, I.W., Ed; ASM Press, Washington DC, 1998;
pp. 11~22
[90] Ribeiro M C D, Augusto O, Ferreira A M D. J. Inorg.
Biochem., 1997, 65:15.
[91] Robert A, Meunier B. Characterization of the first
covalent adduct between artemisinin and a heme model. J. Am. Chem. Soc.,
1997,119: 5968~5969.
[92] Robert A, Meunier B. Characterization of the first
covalent adduct between artemisinin and heme model. J. Am. Chem. Soc., 1997,
119: 5968~5969.
[93]
Robert
A,
Boularan
M,
Meunier
B. Interaction of artemisinin (qinghaosu) with the
tetraphenylporphyrinato-manganese (II) complex. C. R. Acad. Sci. Paris, serie
Iib., 1997, 234: 59~66.
[94] Robert A, Yannick C, Meunier B, NMR characterization of
covalent adducts obtained by alkylation of heme with the antimalarial drug
artemisinin. Inorganica Chimica Acta, 2002, 339: 488~496
[95] Rodriguez M, Bonnet-Delpon D, Begue J P et al. Alkylation
of Manganese (II) Tetraphenylporphyrin by Antimalarial Fluorinated Artemisinin
Derivatives, Bioorg. Med. Chem. Lett., 2003, 13, 1059~1062.
[96] Rosenthal P J, Sijwali P S, Singh A et al. Curr. Pharm.
Des, 2002, 8, 1659~1672.
[97] Rosenthal P J. Proteases of protozoan parasites.
Adv.Parasitol., 1999, 43:105~159.
[98] Voet D, Voet J G. Biochemistry,
2nd Ed; John Wiley & Sons, Inc.: New York,
1995 pp.124~125.
[99] Weatherall D J, Common genetic disorders of the red cell
and <<malaria hypothsis>>, Ann. Trop.Med.Parasitol, 1987, 81:
539~548.
[100] Wernsdorfer, W.H., McGregor, I., Malaria: Principles and
Practice of Malariology, Eds; Churchill-Livingstone: Edinburgh, 1988.
[101] World Health Organization, The World Health Report,
Geneva, 2002
[102] Wyler D J. Malaria-resurgence, resistance and research.
New Engl. J. Med., 1983, 30: 875~878.
[103]
Yang
C
Z,
Shi M,
Chen
H Y et al. Artesunate interaction with hemin.
Bioelectrochem.
and Bioenergetics ,1998, 44: 295~300 .
[104] Yang Y Z., Little B, Meshnick S R. Alkylation of
proteins by artemisinin. Effects of heme, pH, and drug structure. Biochem.
Pharmacol.,1994, 48: 569~573.
[105] Yayon A. et al. Susceptibility of human malaria
parasites to chloroquine is pH dependent. Proc. Natl. Acad. Sci. U. S. A. 1985,
82:2784~2788.
[106] Yu Z W, Quinn P J. Dimethyl sulfoxide: A review of its
applications in cell bilogy. Bioscience Reports, 1994, 4: 259~281.
[107] Yuthavong Y and Wilairat P. Protection against malaria
by thalassemia and hemoglobin variants. Parasitology Today, 1994, 9:
241~245.
[108] Zhang Y, Gosser D K, Meshnick S R. Hemin-catalysed
decomposition of artemisinin. Biochem, 1992, 43: 1805 ~1809.
[109] Zollinger H, Color Chemistry: synthesis, Properties and
Aplications of Organic Dyes and Pigments, VCH, New york, 1991, p. 119.
Appendix 1
Table A1.1 Absorbance values
of hemin Soret band as a function of artemisinin concentartion, at various pH
, in water-DMSO mixture, in 0.1M Tris-HCl buffer at 37oC.
|
Conc.(M)
|
E (420nm), pH 9
|
E(402nm), pH 7.4
|
|
DHA
|
ART
|
AST
|
AST
|
|
10h
|
24h
|
10h
|
24h
|
10h
|
24h
|
10h
|
24h
|
|
0
|
0.255
|
0.255
|
0.255
|
0.255
|
0.255
|
0.255
|
0.291
|
0.291
|
|
3
|
0.230
|
0.214
|
0.240
|
0.202
|
0.235
|
0.216
|
0.261
|
0.253
|
|
6
|
0.212
|
0.183
|
0.229
|
0.190
|
0.229
|
0.200
|
0.253
|
0.240
|
|
10
|
0.200
|
0.162
|
0.225
|
0.188
|
0.225
|
0.169
|
0.242
|
0.199
|
|
14
|
0.182
|
0.133
|
0.222
|
0.184
|
0.216
|
0.151
|
0.227
|
0.185
|
|
18
|
0.170
|
0.116
|
0.215
|
0.167
|
0.214
|
0.143
|
0.209
|
0.167
|
|
24
|
0.150
|
0.096
|
0.210
|
0.162
|
0.210
|
0.132
|
0.141
|
0.128
|
|
50
|
0.094
|
0.058
|
0.190
|
0.116
|
0.200
|
0.121
|
0.138
|
0.112
|
|
70
|
0.078
|
0.050
|
0.166
|
0.083
|
0.100
|
0.103
|
0.132
|
0.108
|
|
100
|
0.049
|
0.038
|
0.147
|
0.065
|
0.188
|
0.094
|
0.124
|
0.102
|
|
120
|
0.047
|
0.037
|
0.127
|
0.055
|
0.189
|
0.086
|
0.108
|
0.092
|
|
160
|
0.040
|
0.035
|
0.109
|
0.045
|
0.186
|
0.078
|
0.107
|
0.090
|
|
200
|
0.038
|
0.035
|
0.096
|
0.039
|
0.183
|
0.078
|
0.105
|
0.087
|
Table A1.2 Absorbance values
of hemin Soret band as a function of artesunate concentartion, at various pH
in water-propylene glycol mixture, in 0.1M Tris-HCl buffer at
37oC.
|
Conc. ( M)
|
AST
|
|
E (398 nm), pH 9
|
E (398 nm), pH 7.4
|
|
10 h
|
24 h
|
10 h
|
24 h
|
|
0
|
0.294
|
0.294
|
0.200
|
0.200
|
|
3
|
0.285
|
0.258
|
0.185
|
0.175
|
|
6
|
0.262
|
0.233
|
0.176
|
0.161
|
|
10
|
0.251
|
0.208
|
0.17
|
0.156
|
|
14
|
0.244
|
0.196
|
0.158
|
0.147
|
|
18
|
0.225
|
0.169
|
0.146
|
0.134
|
|
24
|
0.183
|
0.143
|
0.131
|
0.123
|
|
50
|
0.124
|
0.116
|
0.129
|
0.112
|
|
70
|
0.0865
|
0.082
|
0.114
|
0.108
|
|
100
|
0.051
|
0.058
|
0.107
|
0.094
|
|
120
|
0.045
|
0.051
|
0.093
|
0.092
|
|
160
|
0.045
|
0.056
|
0.09
|
0.090
|
|
200
|
0.042
|
0.045
|
0.087
|
0.086
|
APPENDIX 2


HPLC-MS spectra of hemin-dihydroartemisnin
complex


APPENDIX 3
HPLC-MS spectra of hemin-artemisnin complex

Publication
Mavakala K, Nlandu B B, Mpiana P T, Gushimana Z Y and Yu
Zhi-Wu (\u23561ξ־Îä), Binding Reaction of
Hemin with Chloroquine, Quinine and Quinidine in Water-propylene Glycol
Mixture. Chinese Journal of Chemistry, 2003, volume 21.
| 

