5.3 Data presentation and Interpretation results
5.3.1 Soil moisture (SM)
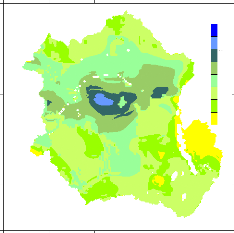
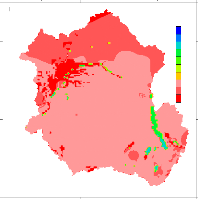
Annual average Soil moisture and seasonal soil moisture maps
are shown in Figures 38 and 39, respectively. The mean annual soil moisture for
the entire basin ranges between 0.7 and 431.4 mm, with highest mean monthly
soil moisture of 546.2 mm during November and lowest, in July (146.2mm). A
general trend is observed in the spatial distribution of the moisture: the
regions around the equator are characterised by high soil moisture and this is
reduced as the distance to equator is increased (Figure 37).
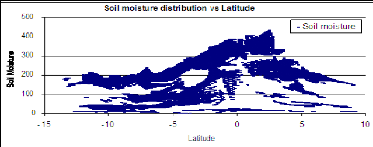
Figure 37 Soil moisture correlation with the
latitude
Spatially, the highest values are located in the centre of the
basin which coincides with the core of the dense equatorial forest. These
values range between 200 and 432 mm (mean annual). The lowest value ranging
between 0 and 50 mm are located in the western part on Tanzania (eastern part
of Tanganyika Lake). This region is also characterised by the small amount of
annual rainfall (< 800) compared to other region inside the basin,
«Lithosol» as type of soil Available Water content (<120 mm/root
depth).
Statistically, the soil moisture distribution over the basin
correlates strongly with the hydrological soil group and the climatic
parameters such as rainfall and Evapotranspiration. The computed soil moisture
values would be better interpreted as indexes of relative wetness rather than
absolute estimates because none are calibrated against measured values in the
field.
Soil Moisture
mean ann (mm)
250
200
350
300
50
0
150
100
10
5
0
-5
-10
-15
10 15 20 25 30 35
Figure 38 Mean annual moisture (in mm) over the Congo
basin.
10 15 20 25 30 35
Total Soil Moisture- June-July-August (mm)
400
300
200
100
0
10 15 20 25 30 35
10 15 20 25 30 35
Total Soil Moisture- September-October-November
(mm)
500
400
300
200
100
0
10 15 20 25 30 35
10
5
0
-5
-10
-15
10
5 0
-5
-10 -15
-10
-15
10
-5
5
0
-10
-15
10
-5
5
0
Total Soil Moisture- March-April-May (mm)
500
400
300
200
0
100
Total Soil Moisture- December-January-February
(mm)
500
400
300
200
0
100
Figure 39 Season Soil moisture (in mm per season) over the
basin.
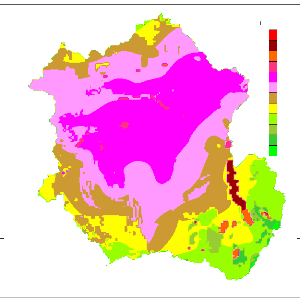
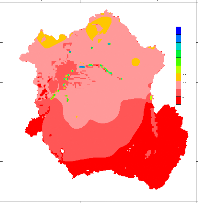
5.3.2 Actual Evapotranspiration (AET)
The simulated results for the Actual Evapotranspiration (AET)
are monthly estimates for each 6 minutes grid cell covering the Congo basin.
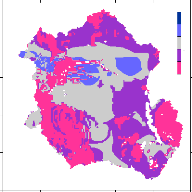
Figures 40 and 41 show the mean annual AET and seasonal AET, respectively. The
mean annual AET ranges between 564.13 and 1576.8 mm/year with a mean of 1098
mm/year. It is well observed that the AET trends similarly with the Rainfall
and the existing land cover map of the basin. Consequntly, the area with lowest
AET is located in the south-eastern region of the basin which coincides with
low rain feed region of the area.
-10
-15
10
-5
5
0
Total An nual Actual Evapotranspiration
mm/year
400
900
800
700
600
1600
1500
1400
1300
1200
1100
1000
10 15 20 25 30 35
Figure 40 Mean Annual Actual Evapotranspiration over the
Congo River basin
High annual averaged AET values are sequentially observed over
the water bodies such as the Tanganyika with a maximum of 1576.8 mm/year,
followed by Upemba, Rukwa, Mweru, Delcommune, Bangwelungu Lakes (1300 - 1531
mm/year) and Kivu, Mai-Ndombe Lakes (>1250 mm/year). Some portions of the
Congo River inside the heart of the Tropical forest present also high annual
values of AET. Excluding the water bodies, the density of the equatorial forest
varies positively with AET distribution.
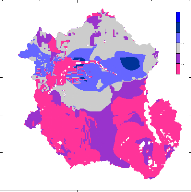
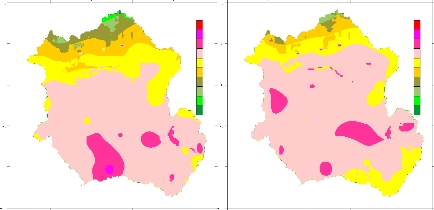
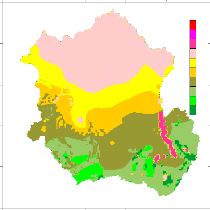
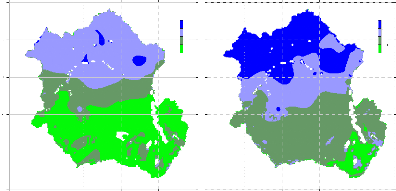
The seasonal distributions of AET (FigurF41) are characterised
by alternation of high values in the northern hemisphere during the two seasons
of December-February and March-May and low values in the southern hemisphere;
inversely during the other 2 seasons ( June-August and September-November).
-10
10
15
5
0
5
-10
10
15
5
0
5
Actual Evapotranspiration: March-April-May
[mm]
400
250
200
500
350
300
150
100
50
0
Actual Evapotranspiration:
December-January-February
[mm]
500
400
350
300
250
200
50
0
150
100
10 15 20 25 30 35 10 15 20 25 30 35
10
5
0
5
-10
15
Actual Evapotranspiration: Jun-July-August
[mm]
500
400
350
300
250
200
50
0
150
100
Actual Evapotranspiration:
September-October-November
[mm]
400
250
200
500
350
300
150
100
50
0
10
5 0 5
-10
15
10 15 20 25 30 35 10 15 20 25 30 35
Figure 41 Season Actual Evapotranspiration over the Congo
basin
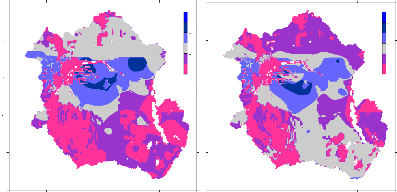
5.3.3 Runoff
The simulated annual Total runoff is shown in Figure42. The
mean annual Runoff for for the Congo Basin varies between 1 and 1945 mm with a
mean annual runoff of 342 mm. The highest values are concentrated in the heart
of the equatorial forest along the Middle Congo river branch. This area records
higher rainfalls in the whole basin. The lowest value is simulated in the
southern hemisphere around the grid of coordinate 31 0E and and
6.730S (western part of Tanzania). A part the lakes, the highest
values of runoff are simulated in the heart of the equatorial forest across the
equator, and decrease progressively towards the tropics. This trend is
relatively disturbed with the soil types especially in the south-eastern, the
extreme north regiond and along the main Congo River. The annual simulated
runoff show a general trend strongly influenced by the distribution pattern of
precipitation (Figure 43) in the basin, while seasonal and monthly runoff
correlate strongly with both rainfall and soil type during dryer seasons. The
area with zero runoff values correspond to swamps and some inland lakes where
there is negligible or nil flow to the river system.
Figure 42 Mean annual runoff over Congo basin
(mm/year)
10 15 20 25 30 35
10
5
Runoff
0
[mm/year]
1350
1250
1050
850
-5
750
650
525
400
350
-10
200
100
0
Rainfall
-15
Total Annual Rainfall and Runoff
Figure 43 The relationship between precipitation and
drigged simulated runoff in the CRB
Seasonally, September-November records the highest amount
(658432 mm. /season) of runoff whereas the lowest (358223 mm/season) is
generated during June-August. This shows again the influence of rainfall on the
generated runoff pattern in the Congo basin where, in general, the period
June-July season records the lowest rainfall in the southern hemisphere which
occupies more than 55% of the basin area. Two picks runoff are observed in
March-May and September-November (658432 mm.) seasons which record higher
rainfall during the year in the southern region.
Runoff: December-January-February
[mm]
450
400
350
300
250
200
50
0
150
100
10 15 20 25 30 35
10 15 20 25 30 35
Runoff: March-April-May
[mm]
450
400
350
300
250
200
50
0
150
100
10 15 20 25 30 35
Runoff: September-October-November
[mm]
450
400
350
300
250
200
50
0
150
100
10 15 20 25 30 35
10
5 0
-5
-10
-15
10
-10
-15
10
-10
-15
10
-5
-5
5
0
5
0
Runoff: Jun-July-August
[mm]
450
400
350
300
250
200
150
100
50
0
Figure 44 Seasonal Runoff grid runoff maps. Top left:
December-February, Top right: March-May, Bottom Left: June-August, Bottom
right: September-November
5.3.4 Simulated sub-watershed and basin-wide
runoff
The runoff averages for each subwateshed are given in table 18
below. The Lualaba subcatchement knows the highest runoff than others. The
higher amount accumulated runoff was expected in the Congo but this is not the
case due to the presence of swamps in the subcachements where are simulated
small values averaged to 0 mm per year.
At the basin scale, the total annual runoff is about 47,418
m3/sec. This amount is comparable to those reported in literature
(45,000 m3/sec, Asante, 2000) with a marginal error of 5.1%.
Table 16 Subwatershed runoff averages
|
Area name
|
ROF ROF Simulated
Mean Ann (m3/sec)
(mm/year)
|
ROF Observed
(m3/sec)
|
Error (%)
|
|
Sangha
|
335.5 3,565
|
No data
|
-
|
|
Ubangi
|
348.6 8,274
|
No data
|
-
|
|
Kasai
|
344.7 11,545
|
No data
|
-
|
|
Lualaba
|
297.3 12,3 14
|
No data
|
-
|
|
Congo
|
385.5 12,177
|
No data
|
-
|
|
CRB
|
342.0 47,418
|
45,000
|
+5.1
|
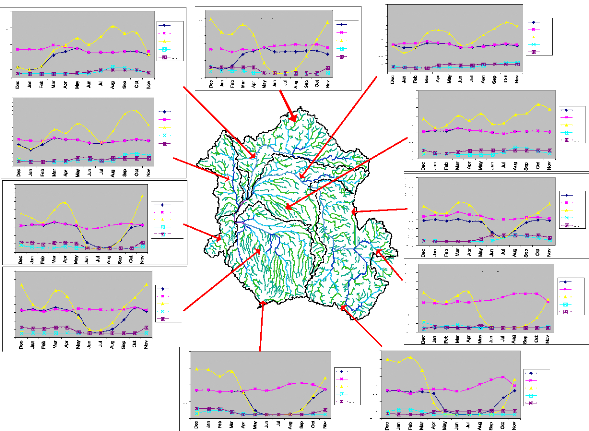
Figure 45 shows the local water balance graphs for 11 selected
grid cells around selected rainfall stations used in the model. The
hydrological behavior correlates strongly with the rainfall betwenn -5 and 5
degree latitude zone. In the South-eastern region (Lubumbashi, Urambo,
South-westen) and the Up-North sation, runoff starts to increase in the
mid-year as well as the soil moisture. An inverse situation is observed in the
high rain fed region.
300
260
220
180
140
100
|
300
|
|
260 220 180 140 100 60 20 -20
|
OUESSO
|
|
|
AET PET PPT ROF SOM
|
|
|
|
300
|
|
260 220 180 140 100 60 20 -20
|
KINSHASA
|
|
|
AET PET PPT ROF SOM
|
|
|
|
300
|
|
260 220 180 140 100 60 20 -20
|
KANANGA
|
|
|
AET
PET
PPT
|
|
ROF
SOM
|
|
|
|
300
|
-20
60
20
BANGUI
AET PET PPT ROF SOM
260
220
180
140
100
-20
60
20
Sangh
260
220
300
180
140
100
-20
20
60
SOUTH-WEST
Kasa
UP-NORTH
Ubangi
Cong
Lualab
AET PET PPT ROF SOM
AET PET PPT ROF SOM
300
260
220
180
140
100
60
20
20
300
260
220
180
140
100
-20
60
20
300
260
220
300
260
220
300
260
220
180
140
100
180
140
100
180
140
100
-20
60
20
60
20
20
60
20
20
LUBUMBASHI(-14, 27)
KISANGANI
BUKAVU (2852, -230)
BOYENDE
URAMBO
AET PET PPT ROF SOM
AET PET PPT ROF SOM
AET PET PPT ROF SOM
AET PET PPT ROF SOM
AET PET PPT ROF SOM
Figure 45 Local water balance for selected grid cells in
the Congo River Basin.
5.3.5 Vertical Integrated Moisture
Convergence
Figures 46 (A-D) show the Mean seasonal distribution of the
Vertically Integrated Atmospheric Moisture Convergence (C) over the Congo
Basin. The moisture convergence corresponds to the negative values whereas the
positive values correspond to the moisture divergence.
A
Vertical Convergence Moisture
CV'
Dec - Feb
2
0 0
-5
-5-5
-10
-15
10
-5
5
0
Vertical Convergence Moisture
B
CV'
Mar - May
-
-5-5
0 0
10
5
0
-5
-10
-15
10 15 20 25 30 35
10 15 20 25 30 35
10 15 20 25 30 35
10 15 20 25 30 35
-10
-15
10
-5
5
0
Vertical Convergence Moisture
C
CV' Jun - Aug
2
0 0
-5
-5-5
-10
-15
10
-5
5
0
Vertical Convergence Moisture
D
CV'
Sep - Nov
-
-5-5
0 0
Figure 46 Seasonal and Spatial distribution maps for
Vertical Integrated Moisture Convergence (in mm/month) over the Congo River
basin. A: December-February, B: March-May, C: June-August, D:
Septembre-November (Negative values correspond to the moisture convergence,
positive values correspond to the moisture divergence).
The basin is well separated into two majors and disctintive
zones based on the C parameter: The northern and the southern zones,
corresponding exactelly to the northern and the southern hemisphere,
respectively (Figures 46, A-D). Large values of Convergence (negative values)
are simulated during June-August season (in the southern hemisphere) and
December-February season (in the northern hemisphere), whereas during the same
season, the northern and southern hemispheres are characterised by moisture
divergence. During March-May season, the northern hemisphere sees its
convergence moisture moving gradually towards the southern hemisphere, and a
divergence moisture zone completely takes place at the end of June-August
season. At the same time, the southern hemisphere which was characterised by
the highest values of C during December-February starts to loose its C and
falls into a highest convergence moisture zone during
June-August. This behaviour is clearly explained from monthly observations of
C.
| 

