PRESENTATION AND ANALYSIS
OF RESULTS
Patient Satisfaction with Intrapartum and Postpartum Nursing
Care: Buea Regional Hospital Annex.
4.0 Introduction
The results of this study have been presented per objective for
easy and logical discussion in this chapter.
4.1 Socio-Demographic Data
This involves age distribution, parity status, educational level,
marital status, profession and the number of days spent in the maternity.
Figure 8: Age Group Proportions
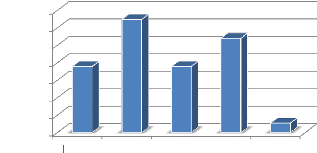
[16;20[ [20;25[ [25;30[ [30;35[ [35;37[
27.00%
2.70%
Proportions
35.00%
30.00%
25.00%
20.00%
15.00%
10.00%
5.00%
0.00%
18.90%
32.40%
18.90%
Age Groups (years)
4.1.1. Age distribution Table 2:
Distribution according to Age.
|
Age Groups (years)
|
Mean
Age (x)
|
Frequency
(f)
|
Proportion
|
f(x)
|
|
[16;20[
|
18
|
7
|
18.9%
|
126
|
|
[20;25[
|
22.5
|
12
|
32.4%
|
270
|
|
[25;30[
|
27.5
|
7
|
18.9%
|
192.5
|
|
[30;35[
|
32.5
|
10
|
27.0%
|
325
|
|
[35;37[
|
36
|
1
|
2.7%
|
36
|
|
Total
|
|
37
|
100%
|
949.5
|
The greatest proportion of the population (32.4%) is between
the age group of (20 and 25)
with a mean age of 25.7
4.1.2. Levels of Education
Table 3: Distribution according to Levels of Education.
Levels of Educations Frequency Proportions
None 1 2.9%
FSLC 16 47.1%
O/L 6 17.6%
A/L 4 11.8%
1st Degree 5 14.7%
DIPES I 1 2.9%
CEP 1 2.9%
Total 34 100%
2.90%
47.10%
17.60%
14.70%
11.80%
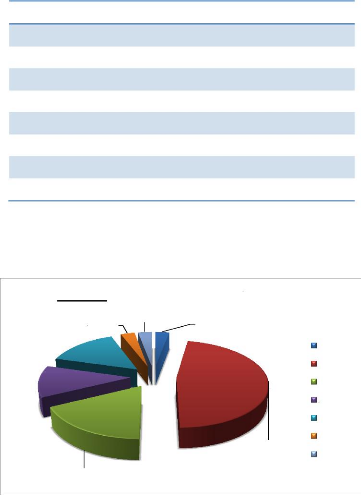
Figure 9: Proportions by Level of
Education
2.90% 2.90%
None FSLC O/L A/L
DEGREE DIPES I CEP
Majority (47.1%) of the population were FSLC holders.
4.1.3. Professional Distribution
Table 4: Distribution according to Profession.
PROFESSION Frequency Proportions
Accountant 1 2.9%
Applicant 2 5.7%
Business 3 8.6%
Hair dresser 5 14.3%
House wife 10 28.6%
Secretary 2 5.7%
Seamstress 3 8.6%
Student 6 17.1%
Teacher 3 8.6%
Total 35 100%
28.6%
30.0%
25.0%
20.0%
17.1%
14.3%
15.0%
8.6%
.6%
8.6%
10.0%
5.7%
5.7%
2.9%
5.0%
0.0%
Proportions
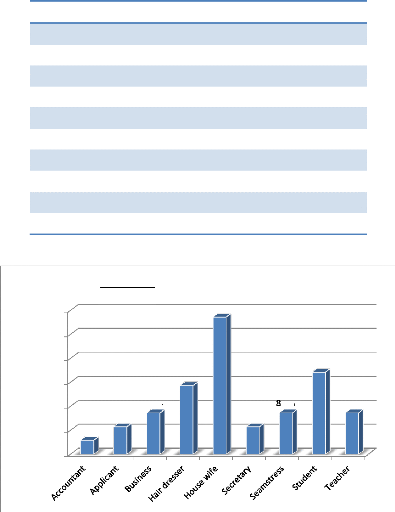
Figure 10: Professional Distribution
Low and no income earners constituted the majority with house
wives making up 28.6% of
the total population.
4.1.4. Marital Status Distribution
Table 5: Distribution according to Marital Status.
Marital status Frequency Proportion
Married 25 67.6%
Single 12 32.4%
Total 37 100%
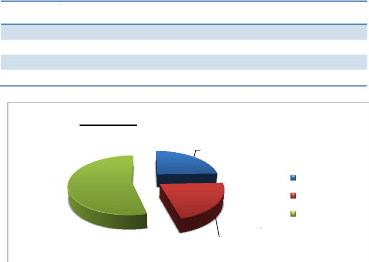
Figure 11: Marital status
|
32.40%
|
|
67.60%
|
|
Married Single
|
A greater proportion of the population (67.6%) were married.
4.1.5. Number of days spent at Maternity
Table 6: Distribution according to Number of days spent at
Maternity.
Number of days Frequency Proportion
1 9 24.3%
2 8 21.6%
3 or more 20 54.1%
Total 37 100%
24.30%
54.10%
21.60%
Figure 12: Duration of Hospitalisation
1 day
2 days
3 days or more
A majority (54.1%) spent 3 or more days in the hospital.
Patient Satisfaction with Intrapartum and Postpartum Nursing
Care: Buea Regional Hospital Annex.
4.1.6. Distribution according to
Parity Table 7: Distribution according to Parity.
PARITY Frequency Proportion
Primipares 17 45.9%
Multipares 20 54.1%
Total 37 100.0%
Figure 13: Parity Distribution
|
54.10%
|
|
45.90%
|
|
Primipars Multipares
|
54.1% of the participants were multipares.
4.1.7. Mode of Delivery Table 8:
Distribution according to Mode of Delivery.
MODE OF DELIVERY Frequency Proportion
Normal delivery 24 64.9%
Emergency C/S 13 35.1%
Total 37 100%
Figure 14: Mode of Delivery

Normal delivery Emergency C/S
64.90%
35.10%
64.9% of the participants delivered per-vagina
4.2. Intrapartum Nursing Care Assessment 4.2.1.
Nurses' Attitude on Admission
Table 9: Distribution according to Nurses' Attitude on
Admission.
Attitude Frequency Percentage
Friendly and welcoming 31 83.8%
Not very welcoming 2 5.4%
Unwelcoming 4 10.8%
Total 37 100%
Majority (83.8%) said nurses were friendly and welcoming.
4.2.2. Nursing Comfort Measures
Table 10: Distribution according to Nursing Comfort Measures.
Comfort and Support? Frequency Proportion
YES 23 63.9%
NO 13 36.1%
Total 36 100%
Comfort Measure Frequency Proportion
Placing hand in anus 2 8.3%
Words of comfort 16 66.7%
Back rubs 1 4.2%
Medications 2 8.3%
Sensitisation 1 4.2%
Cautioning 1 4.2%
Prayer and counsel 1 4.2%
Total 24 100%
Most patients (63.9 %) benefited from comforting measures and
among them 66.7%
received words of comfort and encouragement.
4.2.3. Breathing Techniques Taught
Table 11: Distribution according to Breathing Techniques
Taught.
Received Teachings? Frequency Proportion
YES 20 60.6%
NO 13 39.4%
Total 33 100%
60.6 % received teachings on breathing techniques.
4.2.4. Environmental Hygiene
Table 12: Distribution according to Environmental Hygiene.
Environment Frequency Proportion
Clean 34 94.4%
Unclean 2 5.6%
Total 36 100%
Majority (94.4%) affirmed that the maternity was clean.
4.2.5. Time spent with patients
Table 13: Distribution according to Time spent with patients.
Time accorded? Frequency Proportion
YES 28 87.5%
NO 4 12.5%
Total 32 100%
How often if YES? Frequency Proportion
At regular intervals 11 39.3%
On emergency 4 14.3%
During examination and drug administration 13 46.4%
Total 28 100%
87.5% of the patients acknowledged that time was spent with
them during labour and
46.4% of this time was spent during examinations and
drug administration.
4.2.6. Interpretation of Patients'
feelings
Table 14: Distribution according to Interpretation of Patients'
feelings.
Interpretation? Frequency Proportion
YES 13 40.6%
NO 19 59.4%
Total 32 100%
A lesser proportion (40.6%) of the respondents had the
interpretations of their feelings
while 59.4% of them did not have.
4.3. Postpartum Nursing Care Assessment 4.3.1.
Monitoring Vital signs
Table 15: Distribution according to Monitoring Vital signs.
Vital signs checked? Frequency Proportion
YES 24 64.9%
NO 13 35.1%
Total 37 100%
How often if YES? Frequency Proportion
Regularly every 5 mins 2 9.1%
Every 30 mins 5 22.7%
Once a day 9 40.9%
Twice a day 5 22.7%
Immediately after delivery 1 4.5%
Total 22 100%
A majority (64.9%) had their vital signs checked and 40.9% of
such checks were done just
once daily.
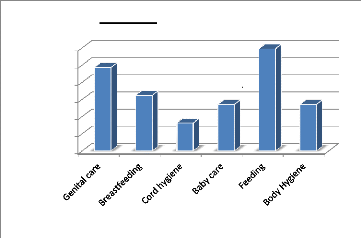
4.3.2. Patient Education
Table 16: Distribution according to Patient Education.
Topic Taught Frequency Proportion
Genital care 9 24.3%
How to breast feed 6 16.2%
How to care for baby's cord 3 8.1%
How to bathe/care for baby 5 13.5%
Feeding 11 29.7%
Hygiene 5 13.5%
Total 39 100%
Proportions
30.00%
25.00%
20.00%
15.00%
10.00%
0.00%
5.00%
24.30%
Figure 15: Patient Education
16.20%
8.10%
Topics Taught
13.50%
29.70%
13.50%
Education was mostly given on feeding (29.7%).
4.3.3. Examination of Baby
Table 17: Distribution according to Examination of Baby.
Baby examined? Frequency Proportion
YES 10 27.0%
NO 27 73.0%
Total 37 100%
How often if Yes? Frequency Proportion
At least once every shift 4 40%
Once a day 6 60%
Total 10 100%
Most babies (73.0%) were not examined postpartum. For the few
who were examined 60%
of such examinations was once daily.
4.3.4. Examination of Mother
Table 18: Distribution according to Examination of Mother
Mother examined? Frequency Proportion
YES 18 48.6.0%
NO 19 51.4%
Total 37 100%
Checks performed Frequency Proportion
Amount of bleeding 18 48.6%
Breast examination 11 29.7%
Genitals 5 13.5%
Conjunctiva 17 45.9%
Fundal height 11 29.7%
More than half of the population never had any checks at all,
and among such checks, 48.6%
was monitoring the amount of bleeding.
4.4. Assessment of Patient Satisfaction
4.4.1. Rating during Intrapartum (using the Likert's
Scale)
|
|
Table 19: Rating during Intrapartum
|
|
RATING
|
Mean Value
|
Frequency
|
Proportion
|
|
Very good
|
1
|
34
|
20.2%
|
|
Good
|
2
|
71
|
42.3%
|
|
Fair
|
3
|
42
|
25.0%
|
|
Poor
|
4
|
21
|
12.5%
|
|
Total responses
|
|
168
|
100%
|
|
RATING
|
Ability to give
Information
(%)
|
Care and
Concern
(%)
|
Skills and
Competence
(%)
|
Restful
Atmosphere
(%)
|
Coordination of
Care
(%)
|
|
Very good
|
14.7
|
18.9
|
24.2
|
18.8
|
25.0
|
|
Good
|
35.3
|
35.1
|
48.5
|
46.9
|
46.9
|
|
Fair
|
20.6
|
35.1
|
21.2
|
28.1
|
18.8
|
|
Poor
|
29.4
|
10.8
|
6.1
|
6.3
|
9.4
|
|
Total
|
100
|
100
|
100
|
100
|
100
|
Proportion
40.0%
60.0%
50.0%
30.0%
20.0%
10.0%
0.0%
14.7%
Ability to give
Information
35.3%
20.6%
29.4%
Figure 16: Rating during Intrapartum
18.9%
35.1%
Care and
Concern
35.1%
10.8%
24.2%
Skills and
Competence
48.5%
21.2%
6.1%
18.8%
Restful
Atmosphere
46.9%
28.1%
6.3%
25.0%
Coordination
of Care
46.9%
18.8%
9.4%
Very good Good
Fair
Poor
A greatest proportion of the respondents (42.3%) indicates that
the nursing care was good, that is; 35.3% for good nursing ability to pass on
information, 35.1% for good nursing care and concern, 48.5% for good nursing
skills and competence, 46.9% for a good restful atmosphere and coordination of
care. Thus giving a Mean value of 2.3 and a standard deviation of
(ä=0.9).
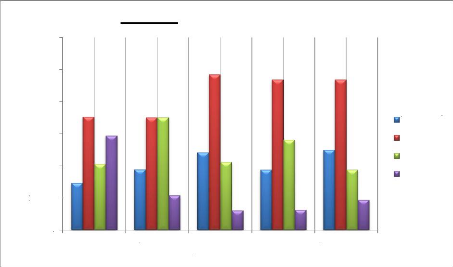
4.4.2. Rating during Postpartum(using the Likert's
Scale)
|
Table 20: Rating during Postpartum
|
|
RATING
|
Mean Value
|
Frequency
|
Proportion
|
|
Very good
|
1
|
10
|
7.1%
|
|
Good
|
2
|
48
|
34.0%
|
|
Fair
|
3
|
30
|
21.3%
|
|
Poor
|
4
|
53
|
37.6%
|
|
Total responses
|
|
141
|
100%
|
|
RATING
|
Information
given
(%)
|
Nursing
attention
(%)
|
Responsiveness
to calls
(%)
|
Reliable
services
(%)
|
Recognition of
opinions
(%)
|
|
Very good
|
0.0%
|
11.1%
|
9.9%
|
6.9%
|
3.9%
|
|
Good
|
20.0%
|
30.6%
|
46.7%
|
41.4%
|
26.9%
|
|
Fair
|
10.0%
|
25.0%
|
16.7%
|
17.2%
|
34.6%
|
|
Poor
|
70.0%
|
33.3%
|
26.7%
|
34.5%
|
34.6%
|
|
Total
|
100%
|
100%
|
100%
|
100
|
100%
|


46.7%
34.6%
34.6%
|
Proportion
|
70.0% 60.0% 50.0% 40.0% 30.0% 20.0% 10.0% 0.0%
|
80.0%
70.0%
20.0%
10.0%
0.0%
30.6% 33.3%
25.0%
11.1%
26.7%
16.7%
9.9%
41.4%
34.5%
17.2%
6.9%

26.9%
3.9%
Information given Nursing attention Responsiveness to
calls
Reliable services Recognition of
opinions


Very good Good Fair Poor


Figure 17: Rating during Postpartum
A majority of the respondents (37.6%) indicated that the
postpartum nursing care was poor, that is; 70% for poor nursing ability to
communicate, 33.3% lacked nurses' attention and 34.6% of patients' opinions
were not recognized. However, for the 34.0% who rated the care given as good,
46.7% had good response to calls and 41.4% for good reliability of nurses to
perform their services. Thus giving an overall Mean value of 2.9 and a standard
deviation of (ä=1.0).
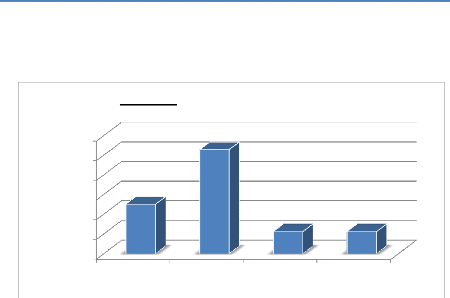
4.5. Patients' Recommendation of the
Maternity
The respondents made recommendations solely based on the nursing
they received.
|
|
Table 21: Patients' Recommendation of the Maternity
|
|
Recommendations
|
|
Mean values Frequency
|
Proportion
|
|
Strongly agree
|
1
|
9
|
25.0%
|
|
Somewhat agree
|
2
|
19
|
52.8%
|
|
Somewhat disagree
|
3
|
4
|
11.1%
|
|
Strongly disagree
|
4
|
4
|
11.1%
|
|
Total
|
|
36
|
100%
|
Strongly disagree
Strongly agree Somewhat agree Somewhat
disagree
Figure 18: Patients' Recommendations
52.8%
60.0%
50.0%
Proportions
40.0%
25.00%
30.0%
20.0%
10.0%
0.0%
11.10% 11.10%
A majority of the respondents (52.8%) somewhat agreed to
recommend the Maternity to their family members and friends. Hence giving an
overall Mean value of 2.1 and a standard deviation of (ä=0.9).
4.6. Patients' Opinion on how satisfaction can be
improved.
The chart below represents various ways on which patient
satisfaction can be improved based on the patients' perspective.
Table 22: Patients' Opinion on how satisfaction can be
improved.
|
PATIENT'S OPINION
|
Frequency
|
Proportion
per
Individual
|
Proportion
on total
answers
|
|
Authorities should sanction stubborn nurses
|
1
|
3.4%
|
1.7%
|
|
Bathe babies and improve on child care policy
|
10
|
34.5%
|
16.7%
|
|
Be more comforting and caring
|
7
|
24.1%
|
11.7%
|
|
Be more friendly, polite and truthful
|
11
|
37.9%
|
18.3%
|
|
Be understanding, respectful and collaborate with patients
|
7
|
24.1%
|
11.7%
|
|
Improve on mother care policy
|
15
|
51.7%
|
25.0%
|
|
Improve on hygiene and mend toilets
|
3
|
10.3%
|
5.0%
|
|
Improve on number of nurses for rapid intervention
|
3
|
10.3%
|
5.0%
|
|
Teach what patients don't know
|
3
|
10.3%
|
5.0%
|
|
TOTAL
|
60
|
|
100%
|
|
| 

