I-2\ A persistent anomaly in time:
In the United States, at the end of
the first day of trading, the shares traded on average at 18.9% above the offer
price at which the company sold them (1990-2007). Underpricing has averaged
21.2% in the 1960s, 9% in the 1970s, and increasing from 7.8% in the 1980s to
14.4% in the 1990s and to a surprisingly and severe underpricing of 63.5% that
exceeded any level previously seen in 1999 and 2000 (reflecting the internet
boom years) before falling to 14% in 2001, averaged 11.8% from 2002 to 2006
before rising to 14% in 2007. These are the average levels of underpricing
observed in the United States IPO market. When we observe these different
levels and percentages of underpricing, we can say that underpricing fluctuates
so much and its level changes over time, but it is persistent over time. This
anomaly is always observed in the IPO market, whatever the industry to which
the offering belongs and whatever the period of going public. The level changes
but this anomaly is persistent.
In dollar terms, IPO firms appear to leave many billions
«on the table» every year in the U.S. IPO market alone. But the
highest amount is in 1999 and 2000, period of internet bubble, this amount of
money left on the table at IPO market has reached 66.63 billion dollars, an
amount that exceeded any level previously seen. It is the period of internet
bubble that attracted the attention of much research effort. Ritter documents
that in 1999 and 2000 only, 803 companies went public in the United States,
raising about $123 billion, and leaving about $65 billion on the table in the
form of initial returns. Loughran and Ritter (2004)1 explain
low-frequency movements in underpricing (or first-day returns) that occur less
often than hot and cold issue markets. On a data for IPOs over 1980-2003, they
find that IPO underpricing doubled from 7% during 1980-1989 to almost 15%
during 1990-1998 before reverting to 12% during the post-bubble period of 2001-
2003, there are some level differences over time but underpricing is
persistent.

1 Loughran and Ritter (2004): «Why Has IPO
Underpricing Changed Over Time?».
I-3\ A persistent anomaly in all countries:
Many researchers have been concentrated in
studying the persistence of underpricing anomaly internationally. The
underpricing phenomenon of Initial Public Offerings (IPOs) has been widely
studied across different stock markets around the world and it is a persistent
phenomenon all over the world.
Loughran, Ritter and Rydqvist (1994)2 documented
that the underpricing anomaly exists in all IPO markets. They collected data
for 45 countries for different periods and found that underpricing is
persistent for all the IPO markets with no exceptions but surely with different
levels.
A comparative study by Jenkinson (1990) examines the
performance of IPOs in Japan as well as IPOs in the U.S. and the U.K., and
concludes that IPOs in these countries are systematically priced at a discount
relative to their subsequent trading price. In the U.S. the discount is around
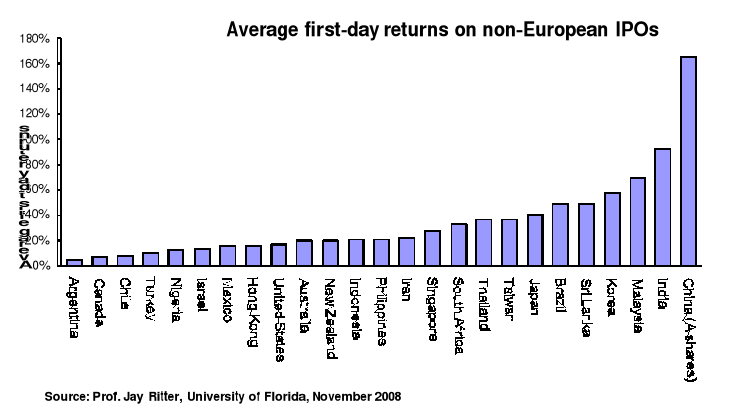
10% while in the U.K., it is around 7%. But when we see the next figures
presented by Jay Ritter and that represent the underpricing average in 2008 for
many countries, we can see that the level of underpricing has been increased in
comparison to the earlier results that were presented by many researchers.
Figure 1- Underpricing on non-European IPOs (2008)

2 Loughran, Ritter and Rydqvist (1994):
«Initial Public Offerings: international insights».
Figure 2- Underpricing on European IPOs (2008)

Loughran et al. (1994) provide also a comprehensive survey of
companies going public in 25 countries and find that underpricing is a
persistent phenomenon. Ritter (2003) reports the extent of underpricing in 38
countries and finds the same results.
Table 1. Average first day returns of some studies
3
|
Country
|
Sample size
|
Time period
|
Avg first-day return %
|
|
Australia
|
381
|
1976-1995
|
12.1
|
|
Brazil
|
62
|
1979-1990
|
78.5
|
|
Canada
|
500
|
1971-1999
|
6.3
|
|
Indonesia
|
106
|
1989-1994
|
15.1
|
|
Mexico
|
37
|
1987-1990
|
33.0
|
|
Norway
|
68
|
1984-1996
|
12.5
|
|
Taiwan
|
293
|
1986-1998
|
31.1
|
|
UK
|
3.042
|
1959-2000
|
17.5
|
|
US
|
14.76
|
1960-2000
|
18.4
|

3 This table presents the results of some different
studies that were advanced. It is a demonstration of the persistence of IPO
underpricing for different countries regardless the period of the study, to
insist on the fact that this persistence is not only due to the period of IPOs.
Regardless the period, underpricing phenomenon exists for all countries.
| 

