ANNEXES
BASE DES DONNEES
|
Année
|
DPT
|
INST
|
PFN
|
PIBHB
|
TXINFL
|
CDRT
|
|
1980
|
0,672
|
1
|
7,901
|
613,644
|
36,8
|
0,0041
|
|
1981
|
0,583
|
1
|
8,807
|
612,006
|
40,9
|
0,0044
|
|
1982
|
0,700
|
1
|
10,783
|
594,009
|
35,3
|
0,0045
|
|
1983
|
0,482
|
0
|
72,372
|
587,424
|
100,8
|
0,0062
|
|
1984
|
1,012
|
0
|
6,618
|
604,202
|
33,4
|
0,0130
|
|
1985
|
0,771
|
0
|
6,897
|
590,935
|
26,5
|
0,0160
|
|
1986
|
0,928
|
0
|
8,066
|
601,881
|
32,8
|
0,0153
|
|
1987
|
1,535
|
0
|
8,784
|
600,599
|
99,5
|
0,0189
|
|
1988
|
3,142
|
0
|
10,565
|
585,571
|
121,5
|
0,0155
|
|
1989
|
1,417
|
1
|
8,519
|
559,760
|
95,8
|
0,0385
|
|
1990
|
0,788
|
1
|
12,890
|
505,049
|
233,2
|
0,1175
|
|
1991
|
0,396
|
1
|
15,214
|
445,366
|
3644,9
|
0,0197
|
|
1992
|
0,301
|
1
|
15,843
|
383,046
|
2989,6
|
0,0031
|
|
1993
|
0,770
|
1
|
30,679
|
318,545
|
4651,7
|
0,0048
|
|
1994
|
0,000
|
1
|
8,401
|
294,950
|
9796,9
|
0,0031
|
|
1995
|
0,166
|
0
|
6,741
|
287,301
|
370,3
|
3,1386
|
|
1996
|
0,236
|
1
|
7,450
|
276,232
|
693
|
1,4515
|
|
1997
|
0,093
|
0
|
4,200
|
254,085
|
13,7
|
0,6058
|
|
1998
|
1,009
|
1
|
8,460
|
243,992
|
134,8
|
9,8398
|
|
1999
|
0,000
|
0
|
7,550
|
227,881
|
483,7
|
0,0000
|
|
2000
|
0,105
|
1
|
15,177
|
206,567
|
511,2
|
0,8800
|
|
2001
|
0,166
|
0
|
4,844
|
196,502
|
135,1
|
0,7392
|
|
2002
|
0,115
|
0
|
4,857
|
196,252
|
15,8
|
0,0311
|
|
2003
|
0,109
|
0
|
5,416
|
200,775
|
4,4
|
0,0142
|
|
2004
|
0,634
|
1
|
8,095
|
207,547
|
9
|
0,0978
|
|
2005
|
0,261
|
1
|
7,780
|
213,310
|
21,5
|
0,2893
|
|
2006
|
0,524
|
0
|
9,981
|
217,535
|
18,2
|
4,5116
|
|
2007
|
0,885
|
0
|
12,280
|
223,780
|
9,9
|
5,4085
|
|
2008
|
1,509
|
0
|
15,076
|
230,119
|
27,6
|
9,1708
|
|
2009
|
1,084
|
1
|
16,366
|
229,142
|
53,4
|
6,0565
|
|
2010
|
0,809
|
0
|
16,364
|
237,572
|
9,8
|
6,8236
|
|
2011
|
1,135
|
1
|
16,029
|
245,869
|
15,4
|
8,4213
|
|
2012
|
0,622
|
1
|
16,935
|
255,208
|
2,7
|
6,2969
|
|
2013
|
0,744
|
0
|
15,630
|
268,277
|
1,03
|
7,1271
|
ANNEXES
A. STATIONNARITE
A.1. Pibhb
|
Null Hypothesis: PIBHB has a unit root
|
|
|
Exogenous: Constant, Linear Trend
|
|
|
Lag Length: 0 (Automatic - based on SIC, maxlag=0)
|
|
|
|
|
|
|
|
|
|
|
|
|
|
t-Statistic
|
Prob.*
|
|
|
|
|
|
|
|
|
|
|
|
Augmented Dickey-Fuller test statistic
|
0.656093
|
0.9993
|
|
Test critical values:
|
1% level
|
|
-4.262735
|
|
|
5% level
|
|
-3.552973
|
|
|
10% level
|
|
-3.209642
|
|
|
|
|
|
|
|
|
|
|
|
|
*MacKinnon (1996) one-sided p-values.
|
|
|
|
|
|
|
|
|
|
|
|
|
Augmented Dickey-Fuller Test Equation
|
|
|
Dependent Variable: D(PIBHB)
|
|
|
|
Method: Least Squares
|
|
|
|
Date: 06/15/16 Time: 20:58
|
|
|
|
Sample (adjusted): 2 34
|
|
|
|
Included observations: 33 after adjustments
|
|
|
|
|
|
|
|
|
|
|
|
|
Variable
|
Coefficient
|
Std. Error
|
t-Statistic
|
Prob.
|
|
|
|
|
|
|
|
|
|
|
|
PIBHB(-1)
|
0.032181
|
0.049050
|
0.656093
|
0.5168
|
|
C
|
-45.92640
|
31.73640
|
-1.447121
|
0.1582
|
|
@TREND(1)
|
1.394878
|
0.851608
|
1.637935
|
0.1119
|
|
|
|
|
|
|
|
|
|
|
|
R-squared
|
0.165915
|
Mean dependent var
|
-10.46566
|
|
Adjusted R-squared
|
0.110309
|
S.D. dependent var
|
22.05590
|
|
S.E. of regression
|
20.80388
|
Akaike info criterion
|
8.994665
|
|
Sum squared resid
|
12984.05
|
Schwarz criterion
|
9.130711
|
|
Log likelihood
|
-145.4120
|
Hannan-Quinn criter.
|
9.040440
|
|
F-statistic
|
2.983771
|
Durbin-Watson stat
|
0.512607
|
|
Prob(F-statistic)
|
0.065790
|
|
|
|
|
|
|
|
|
|
|
|
|
|
|
Null Hypothesis: D(PIBHB) has a unit root
|
|
|
Exogenous: Constant, Linear Trend
|
|
|
Lag Length: 0 (Automatic - based on SIC, maxlag=0)
|
|
|
|
|
|
|
|
|
|
|
|
|
|
t-Statistic
|
Prob.*
|
|
|
|
|
|
|
|
|
|
|
|
Augmented Dickey-Fuller test statistic
|
-2.185354
|
0.4812
|
|
Test critical values:
|
1% level
|
|
-4.273277
|
|
|
5% level
|
|
-3.557759
|
|
|
10% level
|
|
-3.212361
|
|
|
|
|
|
|
|
|
|
|
|
|
*MacKinnon (1996) one-sided p-values.
|
|
|
|
|
|
|
|
|
|
|
|
|
Augmented Dickey-Fuller Test Equation
|
|
|
Dependent Variable: D(PIBHB,2)
|
|
|
Method: Least Squares
|
|
|
|
Date: 06/15/16 Time: 20:58
|
|
|
|
Sample (adjusted): 3 34
|
|
|
|
Included observations: 32 after adjustments
|
|
|
|
|
|
|
|
|
|
|
|
|
Variable
|
Coefficient
|
Std. Error
|
t-Statistic
|
Prob.
|
|
|
|
|
|
|
|
|
|
|
|
D(PIBHB(-1))
|
-0.261721
|
0.119761
|
-2.185354
|
0.0371
|
|
C
|
-9.741193
|
6.043473
|
-1.611854
|
0.1178
|
|
@TREND(1)
|
0.415384
|
0.280787
|
1.479360
|
0.1498
|
|
|
|
|
|
|
|
|
|
|
|
R-squared
|
0.155336
|
Mean dependent var
|
0.459607
|
|
Adjusted R-squared
|
0.097083
|
S.D. dependent var
|
14.41126
|
|
S.E. of regression
|
13.69386
|
Akaike info criterion
|
8.160832
|
|
Sum squared resid
|
5438.130
|
Schwarz criterion
|
8.298244
|
|
Log likelihood
|
-127.5733
|
Hannan-Quinn criter.
|
8.206380
|
|
F-statistic
|
2.666584
|
Durbin-Watson stat
|
1.898732
|
|
Prob(F-statistic)
|
0.086481
|
|
|
|
|
|
|
|
|
|
|
|
|
|
|
Null Hypothesis: D(PIBHB,2) has a unit root
|
|
|
Exogenous: Constant, Linear Trend
|
|
|
Lag Length: 0 (Automatic - based on SIC, maxlag=0)
|
|
|
|
|
|
|
|
|
|
|
|
|
|
t-Statistic
|
Prob.*
|
|
|
|
|
|
|
|
|
|
|
|
Augmented Dickey-Fuller test statistic
|
-5.834472
|
0.0002
|
|
Test critical values:
|
1% level
|
|
-4.284580
|
|
|
5% level
|
|
-3.562882
|
|
|
10% level
|
|
-3.215267
|
|
|
|
|
|
|
|
|
|
|
|
|
*MacKinnon (1996) one-sided p-values.
|
|
|
|
|
|
|
|
|
|
|
|
|
Augmented Dickey-Fuller Test Equation
|
|
|
Dependent Variable: D(PIBHB,3)
|
|
|
Method: Least Squares
|
|
|
|
Date: 06/15/16 Time: 20:58
|
|
|
|
Sample (adjusted): 4 34
|
|
|
|
Included observations: 31 after adjustments
|
|
|
|
|
|
|
|
|
|
|
|
|
Variable
|
Coefficient
|
Std. Error
|
t-Statistic
|
Prob.
|
|
|
|
|
|
|
|
|
|
|
|
D(PIBHB(-1),2)
|
-1.080072
|
0.185119
|
-5.834472
|
0.0000
|
|
C
|
-1.172044
|
5.974613
|
-0.196171
|
0.8459
|
|
@TREND(1)
|
0.122363
|
0.298013
|
0.410595
|
0.6845
|
|
|
|
|
|
|
|
|
|
|
|
R-squared
|
0.549320
|
Mean dependent var
|
0.648049
|
|
Adjusted R-squared
|
0.517129
|
S.D. dependent var
|
21.20126
|
|
S.E. of regression
|
14.73253
|
Akaike info criterion
|
8.309759
|
|
Sum squared resid
|
6077.332
|
Schwarz criterion
|
8.448532
|
|
Log likelihood
|
-125.8013
|
Hannan-Quinn criter.
|
8.354996
|
|
F-statistic
|
17.06417
|
Durbin-Watson stat
|
1.927870
|
|
Prob(F-statistic)
|
0.000014
|
|
|
|
|
|
|
|
|
|
|
|
|
|
|
Null Hypothesis: DPT has a unit root
|
|
|
Exogenous: Constant
|
|
|
|
Lag Length: 0 (Automatic - based on SIC, maxlag=0)
|
|
|
|
|
|
|
|
|
|
|
|
|
|
t-Statistic
|
Prob.*
|
|
|
|
|
|
|
|
|
|
|
|
Augmented Dickey-Fuller test statistic
|
-3.056490
|
0.0400
|
|
Test critical values:
|
1% level
|
|
-3.646342
|
|
|
5% level
|
|
-2.954021
|
|
|
10% level
|
|
-2.615817
|
|
|
|
|
|
|
|
|
|
|
|
|
*MacKinnon (1996) one-sided p-values.
|
|
A.2. Depot
|
Null Hypothesis: DPT has a unit root
|
|
|
Exogenous: Constant
|
|
|
|
Lag Length: 0 (Automatic - based on SIC, maxlag=0)
|
|
|
|
|
|
|
|
|
|
|
|
|
|
t-Statistic
|
Prob.*
|
|
|
|
|
|
|
|
|
|
|
|
Augmented Dickey-Fuller test statistic
|
-3.056490
|
0.0400
|
|
Test critical values:
|
1% level
|
|
-3.646342
|
|
|
5% level
|
|
-2.954021
|
|
|
10% level
|
|
-2.615817
|
|
|
|
|
|
|
|
|
|
|
|
|
*MacKinnon (1996) one-sided p-values.
|
|
|
|
|
|
|
|
|
|
|
|
|
Augmented Dickey-Fuller Test Equation
|
|
|
Dependent Variable: D(DPT)
|
|
|
|
Method: Least Squares
|
|
|
|
Date: 06/15/16 Time: 21:00
|
|
|
|
Sample (adjusted): 2 34
|
|
|
|
Included observations: 33 after adjustments
|
|
|
|
|
|
|
|
|
|
|
|
|
Variable
|
Coefficient
|
Std. Error
|
t-Statistic
|
Prob.
|
|
|
|
|
|
|
|
|
|
|
|
DPT(-1)
|
-0.463212
|
0.151550
|
-3.056490
|
0.0046
|
|
C
|
0.324465
|
0.140031
|
2.317090
|
0.0273
|
|
|
|
|
|
|
|
|
|
|
|
R-squared
|
0.231573
|
Mean dependent var
|
0.002206
|
|
Adjusted R-squared
|
0.206785
|
S.D. dependent var
|
0.594396
|
|
S.E. of regression
|
0.529385
|
Akaike info criterion
|
1.624490
|
|
Sum squared resid
|
8.687702
|
Schwarz criterion
|
1.715188
|
|
Log likelihood
|
-24.80409
|
Hannan-Quinn criter.
|
1.655007
|
|
F-statistic
|
9.342131
|
Durbin-Watson stat
|
2.019304
|
|
Prob(F-statistic)
|
0.004581
|
|
|
|
|
|
|
|
|
|
|
|
|
|
A.3. Profondeur financière
|
Null Hypothesis: PFN has a unit root
|
|
|
Exogenous: Constant, Linear Trend
|
|
|
Lag Length: 0 (Automatic - based on SIC, maxlag=0)
|
|
|
|
|
|
|
|
|
|
|
|
|
|
t-Statistic
|
Prob.*
|
|
|
|
|
|
|
|
|
|
|
|
Augmented Dickey-Fuller test statistic
|
-5.565672
|
0.0004
|
|
Test critical values:
|
1% level
|
|
-4.262735
|
|
|
5% level
|
|
-3.552973
|
|
|
10% level
|
|
-3.209642
|
|
|
|
|
|
|
|
|
|
|
|
|
*MacKinnon (1996) one-sided p-values.
|
|
|
|
|
|
|
|
Augmented Dickey-Fuller Test Equation
|
|
|
Dependent Variable: D(PFN)
|
|
|
|
Method: Least Squares
|
|
|
|
Date: 06/15/16 Time: 21:01
|
|
|
|
Sample (adjusted): 2 34
|
|
|
|
Included observations: 33 after adjustments
|
|
|
|
|
|
|
|
|
|
|
|
|
Variable
|
Coefficient
|
Std. Error
|
t-Statistic
|
Prob.
|
|
|
|
|
|
|
|
|
|
|
|
PFN(-1)
|
-1.013296
|
0.182062
|
-5.565672
|
0.0000
|
|
C
|
15.73148
|
5.148519
|
3.055535
|
0.0047
|
|
@TREND(1)
|
-0.160320
|
0.224923
|
-0.712780
|
0.4815
|
|
|
|
|
|
|
|
|
|
|
|
R-squared
|
0.508027
|
Mean dependent var
|
0.234211
|
|
Adjusted R-squared
|
0.475229
|
S.D. dependent var
|
16.86156
|
|
S.E. of regression
|
12.21470
|
Akaike info criterion
|
7.929665
|
|
Sum squared resid
|
4475.967
|
Schwarz criterion
|
8.065711
|
|
Log likelihood
|
-127.8395
|
Hannan-Quinn criter.
|
7.975441
|
|
F-statistic
|
15.48947
|
Durbin-Watson stat
|
2.008222
|
|
Prob(F-statistic)
|
0.000024
|
|
|
|
|
|
|
|
|
|
|
|
|
|
A.4. Taux d'inflation
|
Null Hypothesis: TXINFL has a unit root
|
|
|
Exogenous: None
|
|
|
|
Lag Length: 0 (Automatic - based on SIC, maxlag=0)
|
|
|
|
|
|
|
|
|
|
|
|
|
|
t-Statistic
|
Prob.*
|
|
|
|
|
|
|
|
|
|
|
|
Augmented Dickey-Fuller test statistic
|
-3.159252
|
0.0025
|
|
Test critical values:
|
1% level
|
|
-2.634731
|
|
|
5% level
|
|
-1.951000
|
|
|
10% level
|
|
-1.610907
|
|
|
|
|
|
|
|
|
|
|
|
|
*MacKinnon (1996) one-sided p-values.
|
|
|
|
|
|
|
|
|
|
|
|
|
Augmented Dickey-Fuller Test Equation
|
|
|
Dependent Variable: D(TXINFL)
|
|
|
|
Method: Least Squares
|
|
|
|
Date: 06/15/16 Time: 21:51
|
|
|
|
Sample (adjusted): 2 35
|
|
|
|
Included observations: 34 after adjustments
|
|
|
|
|
|
|
|
|
|
|
|
|
Variable
|
Coefficient
|
Std. Error
|
t-Statistic
|
Prob.
|
|
|
|
|
|
|
|
|
|
|
|
TXINFL(-1)
|
-0.464428
|
0.147006
|
-3.159252
|
0.0034
|
|
|
|
|
|
|
|
|
|
|
|
R-squared
|
0.232216
|
Mean dependent var
|
-1.045294
|
|
Adjusted R-squared
|
0.232216
|
S.D. dependent var
|
1992.873
|
|
S.E. of regression
|
1746.220
|
Akaike info criterion
|
17.79727
|
|
Sum squared resid
|
1.01E+08
|
Schwarz criterion
|
17.84216
|
|
Log likelihood
|
-301.5535
|
Hannan-Quinn criter.
|
17.81257
|
|
Durbin-Watson stat
|
2.166439
|
|
|
|
|
|
|
|
|
|
|
|
|
|
A.5. Investissement (INV)
|
Null Hypothesis: D(INV) has a unit root
|
|
|
Exogenous: Constant, Linear Trend
|
|
|
Lag Length: 0 (Automatic - based on SIC, maxlag=0)
|
|
|
|
|
|
|
|
|
|
|
|
|
|
t-Statistic
|
Prob.*
|
|
|
|
|
|
|
|
|
|
|
|
Augmented Dickey-Fuller test statistic
|
-4.643400
|
0.0041
|
|
Test critical values:
|
1% level
|
|
-4.273277
|
|
|
5% level
|
|
-3.557759
|
|
|
10% level
|
|
-3.212361
|
|
|
|
|
|
|
|
|
|
|
|
B. COINTEGRATION
B.1. Détermination du lag optimal
|
VAR Lag Order Selection Criteria
|
|
|
|
|
Endogenous variables: DDPIBHB DINV DPT CDRT TXINFL PFN
|
|
|
Exogenous variables: C
|
|
|
|
|
Date: 06/17/16 Time: 19:42
|
|
|
|
|
Sample: 1 35
|
|
|
|
|
|
Included observations: 29
|
|
|
|
|
|
|
|
|
|
|
|
|
|
|
|
|
Lag
|
LogL
|
LR
|
FPE
|
AIC
|
SC
|
|
|
|
|
|
|
|
|
|
|
|
|
|
0
|
-650.9959
|
NA
|
1.92e+12
|
45.31006
|
45.59295*
|
|
1
|
-604.6929
|
70.25289
|
1.00e+12
|
44.59951
|
46.57973
|
|
2
|
-574.6654
|
33.13379
|
2.15e+12
|
45.01141
|
48.68896
|
|
3
|
-500.6830
|
51.02237*
|
4.88e+11*
|
42.39193*
|
47.76682
|
|
|
|
|
|
|
B.2. Analyse de la causalité par le test de
granger
|
Pairwise Granger Causality Tests
|
|
Date: 06/15/16 Time: 21:05
|
|
Sample: 1 35
|
|
|
|
|
|
|
|
|
|
|
Null Hypothesis:
|
Obs
|
F-Statistic
|
Prob.
|
|
|
|
|
|
|
|
|
|
DPT does not Granger Cause DDPIBHB
|
31
|
5.08979
|
0.0321
|
|
DDPIBHB does not Granger Cause DPT
|
0.02370
|
0.8788
|
|
|
|
|
|
|
|
|
|
PFN does not Granger Cause DDPIBHB
|
31
|
6.67955
|
0.0153
|
|
DDPIBHB does not Granger Cause PFN
|
2.89365
|
0.1000
|
|
|
|
|
|
|
|
|
|
TXINFL does not Granger Cause DDPIBHB
|
31
|
5.48367
|
0.0265
|
|
DDPIBHB does not Granger Cause TXINFL
|
5.87536
|
0.0221
|
|
|
|
|
|
|
|
|
|
INST does not Granger Cause DDPIBHB
|
31
|
0.19834
|
0.6595
|
|
DDPIBHB does not Granger Cause INST
|
1.66137
|
0.2080
|
|
|
|
|
|
|
|
|
|
PFN does not Granger Cause DPT
|
33
|
0.07622
|
0.7844
|
|
DPT does not Granger Cause PFN
|
0.09131
|
0.7646
|
|
|
|
|
|
|
|
|
|
TXINFL does not Granger Cause DPT
|
33
|
0.96629
|
0.3335
|
|
DPT does not Granger Cause TXINFL
|
0.14443
|
0.7066
|
|
|
|
|
|
|
|
|
|
INST does not Granger Cause DPT
|
33
|
8.02142
|
0.0082
|
|
DPT does not Granger Cause INST
|
0.69650
|
0.4106
|
|
|
|
|
|
|
|
|
|
TXINFL does not Granger Cause PFN
|
33
|
0.04314
|
0.8369
|
|
PFN does not Granger Cause TXINFL
|
1.91483
|
0.1766
|
|
|
|
|
|
|
|
|
|
INST does not Granger Cause PFN
|
33
|
1.85640
|
0.1832
|
|
PFN does not Granger Cause INST
|
0.11382
|
0.7382
|
|
|
|
|
|
|
|
|
|
INST does not Granger Cause TXINFL
|
33
|
1.15297
|
0.2915
|
|
TXINFL does not Granger Cause INST
|
0.00015
|
0.9902
|
|
|
|
|
|
|
|
|
|
|
|
|
|
B.3. Estimation par le MCO
|
Dependent Variable: DDPIBHB
|
|
|
|
Method: Least Squares
|
|
|
|
Date: 06/17/16 Time: 15:50
|
|
|
|
Sample (adjusted): 3 34
|
|
|
|
Included observations: 32 after adjustments
|
|
|
|
|
|
|
|
|
|
|
|
|
Variable
|
Coefficient
|
Std. Error
|
t-Statistic
|
Prob.
|
|
|
|
|
|
|
|
|
|
|
|
C
|
4.977284
|
4.928219
|
1.009956
|
0.3215
|
|
DPT
|
-4.527171
|
3.863368
|
-1.171820
|
0.2515
|
|
PFN
|
0.048687
|
0.194444
|
0.250389
|
0.8042
|
|
TXINFL
|
0.003344
|
0.001304
|
2.564396
|
0.0162
|
|
INST
|
-9.647416
|
4.970172
|
-1.941063
|
0.0628
|
|
|
|
|
|
|
|
|
|
|
|
R-squared
|
0.285685
|
Mean dependent var
|
0.459607
|
|
Adjusted R-squared
|
0.179861
|
S.D. dependent var
|
14.41126
|
|
S.E. of regression
|
13.05106
|
Akaike info criterion
|
8.118216
|
|
Sum squared resid
|
4598.913
|
Schwarz criterion
|
8.347238
|
|
Log likelihood
|
-124.8915
|
Hannan-Quinn criter.
|
8.194131
|
|
F-statistic
|
2.699613
|
Durbin-Watson stat
|
2.646561
|
|
Prob(F-statistic)
|
0.051744
|
|
|
|
|
|
|
|
|
|
|
|
|
|
C. DIAGNOSTIC DU MODEL
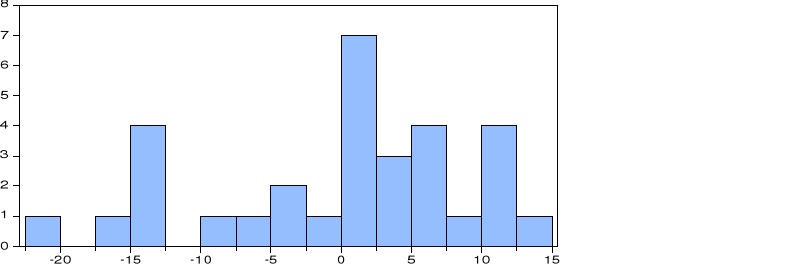
C.1. test de normalité des erreurs
C.2. Test d'autocorrelation des erreurs
|
Breusch-Godfrey Serial Correlation LM Test:
|
|
|
F-statistic
|
0.698757
|
Prob. F(2,19)
|
0.5095
|
|
Obs*R-squared
|
2.123933
|
Prob. Chi-Square(2)
|
0.3458
|
|
|
|
|
|
|
Variable
|
Coefficient
|
Std. Error
|
t-Statistic
|
Prob.
|
|
|
|
|
|
|
|
|
|
|
|
C
|
2.441063
|
6.297803
|
0.387605
|
0.7026
|
|
DDPIBHB(-1)
|
-0.246184
|
0.283023
|
-0.869837
|
0.3952
|
|
DPT
|
-0.248253
|
4.662547
|
-0.053244
|
0.9581
|
|
DPT(-1)
|
-1.332227
|
4.314676
|
-0.308766
|
0.7609
|
|
PFN
|
-0.033383
|
0.184562
|
-0.180877
|
0.8584
|
|
PFN(-1)
|
-0.003731
|
0.178686
|
-0.020879
|
0.9836
|
|
TXINFL
|
0.000372
|
0.001587
|
0.234248
|
0.8173
|
|
TXINFL(-1)
|
0.000350
|
0.001538
|
0.227377
|
0.8226
|
|
INST
|
0.108599
|
4.860582
|
0.022343
|
0.9824
|
|
INST(-1)
|
-2.869127
|
6.031770
|
-0.475669
|
0.6397
|
|
RESID(-1)
|
0.441810
|
0.382360
|
1.155481
|
0.2622
|
|
RESID(-2)
|
-0.154120
|
0.287278
|
-0.536484
|
0.5979
|
|
|
|
|
|
|
|
|
|
|
C.3. Test
d'hétéroscedasticité
|
Heteroskedasticity Test: Breusch-Pagan-Godfrey
|
|
|
|
|
|
|
|
|
|
|
|
F-statistic
|
0.483965
|
Prob. F(9,21)
|
0.8691
|
|
Obs*R-squared
|
5.325288
|
Prob. Chi-Square(9)
|
0.8051
|
|
Scaled explained SS
|
1.742016
|
Prob. Chi-Square(9)
|
0.9949
|
|
|
|
|
|
|
|
|
|
|
|
|
|
|
|
|
Test Equation:
|
|
|
|
|
Dependent Variable: RESID^2
|
|
|
|
Method: Least Squares
|
|
|
|
Date: 06/15/16 Time: 21:16
|
|
|
|
Sample: 4 34
|
|
|
|
|
Included observations: 31
|
|
|
|
|
|
|
|
|
|
|
|
|
|
Variable
|
Coefficient
|
Std. Error
|
t-Statistic
|
Prob.
|
|
|
|
|
|
|
|
|
|
|
|
C
|
81.54419
|
58.15245
|
1.402249
|
0.1755
|
|
DDPIBHB(-1)
|
-0.018286
|
1.871881
|
-0.009769
|
0.9923
|
|
DPT
|
-17.00285
|
45.37412
|
-0.374726
|
0.7116
|
|
DPT(-1)
|
7.173907
|
40.18486
|
0.178523
|
0.8600
|
|
PFN
|
-1.262712
|
1.782448
|
-0.708414
|
0.4865
|
|
PFN(-1)
|
-0.717613
|
1.742322
|
-0.411872
|
0.6846
|
|
TXINFL
|
0.010921
|
0.014077
|
0.775828
|
0.4465
|
|
TXINFL(-1)
|
-0.007789
|
0.014433
|
-0.539678
|
0.5951
|
|
INST
|
34.82321
|
46.42291
|
0.750130
|
0.4615
|
|
INST(-1)
|
33.47325
|
53.77542
|
0.622464
|
0.5403
|
|
|
|
|
|
|
|
|
|
|
|
R-squared
|
0.171783
|
Mean dependent var
|
83.30678
|
|
Adjusted R-squared
|
-0.183166
|
S.D. dependent var
|
101.1143
|
|
S.E. of regression
|
109.9855
|
Akaike info criterion
|
12.49427
|
|
Sum squared resid
|
254033.0
|
Schwarz criterion
|
12.95685
|
|
Log likelihood
|
-183.6612
|
Hannan-Quinn criter.
|
12.64506
|
|
F-statistic
|
0.483965
|
Durbin-Watson stat
|
2.038192
|
|
Prob(F-statistic)
|
0.869074
|
|
|
|
|
|
|
|
|
|
|
|
|
|
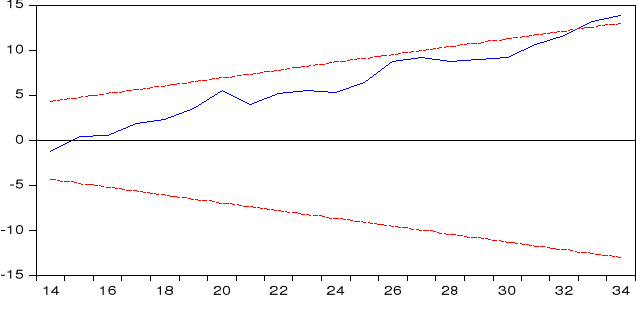
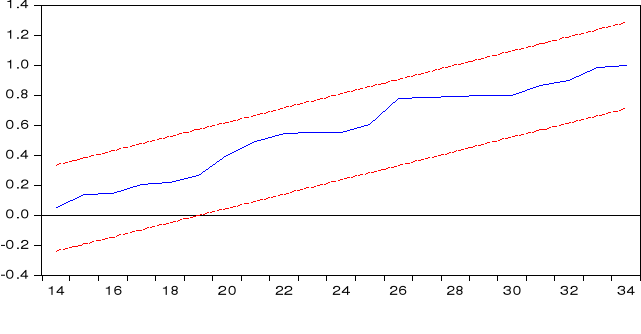
C.4. Test de stabilité du
modèle
92
|
|

