|

SPECIALIZED MASTER
In Corporate Finance
Professional thesis subject:
Analysis of the Efficiency and the Future of the Foreign
Cross-Listing
Societe Generale Corporate & Investment
Banking
(Contact : vincent-chertier.mas(c)
em-lyon.com)
Promotion 2008
Date: 17th December 2008
Professor supervisor: Associate Professor in Finance Mr Loïc
Belze
Copyright E.M.LYON
Par accord du CFC
Cession et reproduction interdite
Summarv
Introduction...............................................................................................
3
I. Theoretical Approach of the Foreign Cross-Listing
......................................... 5
Preamble
..........................................................................................
5
Different Methods of Foreign Cross-Listing ............... 6
I.2.a. Depositary Receipts (DRs) ...............................
6
I.2.b. Dual-Listed Companies (DLCs) 7
I.2.c. Other Means
..............................................................................
16
Reasons Pleading for Foreign Cross-Listing
.......................................... 16 I.3.a. Business Motivations
................................................................... 16 I.3.b.
Corporate Governance Motivations
................................................ 17 I.3.c. Financial
Motivations ...................................................................
20 I.3.d. Main Impacts of the Foreign Cross-Listing
...................................... 25
Different Geographical Origins Imply Different Purposes
........................ 27
II. Geography of the Foreign Cross-Listing
................................................... 28
Methodology for the Creation of the Sample
....................................... 28 II.1.a. Sources
....................................................................................
28 II.1.b. Statements and Assumptions Regarding the Analysis
...................... 30
Presentation of the Results
............................................................... 31
Empirical Interpretation of the Results
............................................... 33 II.3.a. Geographic
Distribution .............................................................. 33
II.3.b. Sector
......................................................................................
36 II.3.c. Size and Growth
........................................................................ 38
II.3.d. Cultural Similarities
................................................................... 41
Going Further in the Empirical Interpretation ......... 42
III. Environment and Current Evolutions
...................................................... 43
III.1. Decreasing Advantages and Increasing Concerns ? 43
III.2. A Major Tendency Has Emerged ..........................
45
III.3. A New Deal in the Stock Exchanges Industry 49
III.3.a. Mergers between Stock Exchanges 49
III.3.b. Strategic Partnerships between Stock Exchanges 50
III.3.c. New Actors Are Arriving... 50
IV. Is the Foreign Cross-Listing Efficient
?.................................................... 52
Empirical Determination of the Efficiency 52
Liquidity Analysis 56
Volumes Analysis 60
IV.3.a. Analysis of the Efficiency 60
IV.3.b. Current Tendency: the "Fading Listing" 64
Future of the Foreign Cross-Listing 69
ArcelorMittal Case Study 71
V. Conclusion
...........................................................................................
75
Bibliography............................................................................................
78
OtherSources 79
Appendix1 80
Appendix2: Articles 81
Introduction
In 2001, the Kenyan based company East African Breweries Ltd,
initially listed on the Nairobi Stock Exchange, performed a foreign
cross-listing on the Uganda Securities Exchange and, the year after,
re-performed this operation on the Tanzanian Dar-es-Salaam Stock Exchange in
Tanzania. This atypical example materializes how the company's decision to be
cross-listed on a foreign stock exchange depends on a set of motivations or
events inherent to each company. Over the decades, the phenomenon related to
foreign cross-listing has known various tendencies, illustrated by a set of
highs and lows. This phenomenon started in the 70s and reached its highs during
the 1980s-1990s. However, since the beginning of the new millennium new
cross-listings have become scarcer, but above all the number has been steadily
diminishing. This growing loss of interest in foreign cross-listing mainly
results from regulatory framework evolutions, materialized by the
Sarbanes-Oxley Act (2002) and the amendment of the Markets in Financial
Instruments Directive (2007) which paved the way to the harmonisation of
regulatory regime for investment services.
Up to now, many researches have already dealt with the
phenomenon of foreignlisting and foreign cross-listing, but few have developed
the notion of efficiency of such operations. In this perspective, this research
bases its findings on a sample of 1,347 foreign cross-listing cases and tries
to answer to the following problematic:
Within the current context of financial markets, is the foreign
cross-listing an efficient tool for companies ?
Nevertheless, on account of the existence of intangible
benefits like the visibility, the prestige and the recognition, there is no
Manichean answer. However, through the analysis of a set of elements, it is
possible to outline the current tendencies and therefore to predict the likely
future of foreign cross-listing.
In the first place, this research focuses on the theoretical
analysis of the foreign cross-listing, describing the advantages and drawbacks
for a company. The goal is to understand the motivations and the patterns
leading to perform such operations.
Then, the second part develops a statistical analysis of the
foreign cross-listing
phenomenon and its geographical distribution, with a
focus on Western European,
North American, Japanese and Australian stock
exchanges. Through the analysis
of the collected data, the purpose is the identification of
the main characteristics of cross-listed companies. This step is essential
because it serves of foundation of the part dealing with the efficiency
analysis.
In the third place, this research tackles the theme related to
the on-going revolution in the stock exchanges industry. This research tries to
outline the impacts and the implications on foreign cross-listing.
Finally, this research combines the statements made in the
previous parts and the outputs given by the efficiency test. Hence, the
interpretation of the results helps to draw the conclusion and the future of
foreign cross-listing.
I. Theoretical Approach of the Foreign Cross-Listing
I.1. Preamble
Definition of the foreign cross-listing:
In this research, a company is considered as foreign
cross-listed, if and only if its own shares are officially listed on one
or several foreign stock exchanges, in addition to the stock exchange
of its incorporation country.
By the term officially listed, we consider cross-listing
initiated on the behalf of the company.
Nowadays, foreign cross-listing may complete the hierarchy of
financing sources, the Pecking Order Theory developed by S. Myers and N. Majluf
in 1984.
#1: Successive Process of Global Financingl

Domestic Capital
Market Operations
International
Bond Issue
Foreign Equity
Issue
Foreign Equity
Listing
1
R. Nyvltova, 2006, "The Effects of Cross-Border Listings on the
Development of Emerging Markets: the Case of Czech Republic0
Holders
Stock Exchange
Barcllys ADR 1::
NYSE
AXA
ADR 1:1 11
Tel 'talia
ADR
1:10110
Sanof I ADR 2:1
Depositary Receipts System
Trust
arcla Barclays
tock
Stock
Tel Italie
tock
Stock
Sanof I
tock Stock
AXA
toc Stock
Bank
I.2. Different Methods of Foreign Cross-Listing
In addition to the simple and direct listing through shares,
the financial engineering for corporate finance has developed complementary
ways to perform a foreign cross-listing.
I.2.a. Depositary Receipts (DRs)
Depositary receipts (DRs) are an indirect mean to list foreign
shares. DRs are tradable certificates issued by a "sponsoring bank" (or
"depositary bank"), representing the ownership of stocks in the capital of a
foreign company and compliant with the local financial markets laws. This
product replicates an underlying stock of a company, which is in fact held by a
trust vehicle in a foreign bank. A DR may represent a fraction of a stock, a
single stock, or several stocks. For instance, foreign companies aiming at a
listing in the United States or the United Kingdom may respectively use
"American Depositary Receipts" or "Global Depositary Receipts". In a lesser
extent, there are also "European Depositary Receipts", "International
Depositary Receipts" in Brussels, "Dutch Depositary Receipts" in Amsterdam,
"Swedish Depositary Receipts", "Singapore Depositary Receipts" and so on.
The sponsoring bank provides all the services regarding the
registration, the agency services, the broker trading, the conversion of
dividends into the DR holder's currency, and so on. As a consequence of the
utilisation of a trust vehicle, DR holders are not considered as shareholders
of the company and do not have voting rights; but they may instruct the DR
depositary bank how to vote the stocks underlying their DRs.
There are four types of DR (I, II, III, unsponsored), each one
corresponding to different classes. A sponsored level I DR trades
over-the-counter (OTC) and implies the minimal requirements for companies (e.g.
neither obligation to publish quarterly/annual reports nor to meet the U.S.
GAAP). Level II DR (no capital is issued), is different from level III DR (new
capital is issued), but both have the highest disclosure and fulfilling
requirements. At these two levels, companies with DRs listed in the United
States must annually fill forms (registration statements and financial
statements) for the American S.E.C. and fully meet U.S. GAAP.
Most of time, DRs are issued according to the will of a
company to be listed on a specific market with the aim to become accessible to
new investors and thus to attract additional pool of capital. However, a bank
may also issue unsponsored DRs, that is to say not realized on the behalf of
the company but of an investor. Nowadays, there are no formal requirements to
seek companies' authorisation to issue unsponsored DRs, since such operation is
completely passive, i.e. presents no risks, no future implications, no costs
for the company.
Today DR is the most used method for a listing abroad, in
particular in the United States and in the United Kingdom. According to the
Bank of New York, issues of DRs exceed US$50.0bn in 2007 vs. US$44.5bn in 2006,
which had already set a record high2. Most of DRs issued in 2007 had
been realized on the Nyse, Nasdaq, Nyse Alternext (former Amex) and L.S.E; with
two third of issuers originating from the BRIC countries (Brazil, Russia,
India, China).
I.2.b. Dual-Listed Companies (DLCs)
A dual-listing (DL), also referred as Siamese twin, is the
result of a merger between companies incorporated in different countries. These
two companies agree to unify their forces (cash flows, operational activities),
but to keep separated their identities (assets, shareholdings). In this case,
there are contractual agreements between the two companies to share the cash
flows from each other's assets. Alternatively, the two companies may transfer
all their assets to a holding company which redistributes the dividends. The
shareholders of the two companies have the same rights in terms of votes and
dividends, "in line with
2
These figures include IPOs and capital increases, but no issues
from mergers and acquisitions
the relative 'weights' of the two companies established at the
time of the creation of the DLC"3.
Under this type of organisation, there is a unique management or
an identical management elected on both board.
DLC Structure Type 1 (case of Rio Tinto Ltd and Rio Tinto
Plc)
Shareholders of the Dutch Entity
Assets (operations)
Rio Tinto Ltd listed on Sydney
Dividends
Voting rights
Cash
flows
Shareholders of the English Entity
Dividends
Assets (operations)
Rio tinto Plc Listed on the L.S.E
Voting rights
DLC Structure Type 2 (case of Unilever N.V. and Unilever
Plc)
Shareholders of the Dutch Entity
Holding Company
Dividends
Unilever N.V listed on Amsterdam
Dividends Dividends
Voting rights
Cash flows Operations
Assets
Shareholders of the English Entity
Dividends
Unilever Plc Listed on the L.S.E
Voting rights
3 Reserve Bank of Australia Bulletin, 2002,
"Dual-listed Companies"
First of all, it is important to notice that a dual-listing is
different from a cross- listing, since the shares on each stock exchange are
not from the same company. Whereas a dual-listing implies the quasi-merger of
two companies, a cross-listing results into the secondary listing on a foreign
stock exchange. However, the overall philosophy is the same and that is why
during the creation of the sample in part II. The Geography of the Foreign
Cross-Listing, dual-listings will be considered as cross-listings. However, in
the part dealing with the liquidity and the volumes matters (see IV. Is the
Foreign Cross-Listing Efficient ?), DLCs are not taken into consideration since
their shares are different and therefore not tradable on the both stock
exchanges (e.g. impossibility to perform arbitrages, i.e. buy a stocks on the
ASX and sell it on the L.S.E).
At the moment, two of the most relevant cases of dual-listing
are BHP Billiton Plc/BHP Billiton Ltd (U.K., listed on L.S.E/Australia, listed
on ASX) and Unilever Plc/Unilever N.V (U.K., listed on L.S.E/The Netherlands,
listed on Euronext Amsterdam).
All actual dual-listed companies (as of December 2008):
4 ThomsonReuters (Canada/U.K., 2008)
4 Mondi (South Africa/U.K., 2007)
4 Anheuser-Busch InBev (Belgium/Brazil, 2004)
4 Carnival Corporation (U.K./U.S., 2003)
4 Investec Bank (South Africa/U.K., 2002)
4 BHP Billiton (Australia/U.K., 2001)
4 Rio Tinto (Australia/U.K., 1995)
4 Reed Elsevier (U.K./The Netherlands, 1993)
4 Unilever (U.K./The Netherlands, 1930)
Former dual-listed companies (as of December, 2008):
4 Royal Dutch Shell (U.K./The Netherlands, 1907-2005)
4 Brambles Industries (Australia/U.K., 2001-2006)
4 Fortis (Belgium/The Netherlands, 1990-2001)
4 Allied Zurich (now ZFS) (U.K./Switzerland, 1998-2000)
4 Dexia (Belgium/France, 1996-2000)
4 Nordbanken/Merita (now Nordea) (Sweden/Finland, 1997-2000)
4 ABB Group (Sweden/Switzerland, 1988-1999)
4 Smith Kline Beecham (now Glaxo) (U.K./U.S., 1989-1996)
According to the managements of former DLCs, the main reasons
evoked to justify the withdrawal of the DLC structure is the willingness to
eliminate the premium/discount between the two companies, although there is
theoretically no possibility of arbitrage since the two companies offer
equivalent dividend and voting right to their respective shareholders. However,
some examples had shown significant gap between the two stocks values.
Several studies have already been done about this subject (L.
Rosenthal and C. Young4 in 1990, K. Froot and E. Dabora5
in 1999), showing that "significant mispricing in three DLCs (Royal Dutch
Shell, Unilever, and Smithkline Beecham) has existed over a long period of
time. Both studies conclude that fundamental factors (such as currency risk,
governance structures, legal contracts, liquidity, and taxation) are not
sufficient to explain the magnitude of the price deviations". K. Froot and E.
Dabora5 stated that "the relative prices of the twin stocks are
correlated with the stock indices of the markets on which each of the twins has
its main listing. For example, if the FTSE 100 rises relative to the AEX index
(the Dutch stock market index) the stock price of Reed International PLC
generally tends to rise relative to the stock price of Elsevier NV. A potential
explanation is that local market sentiment affects the relative prices of the
shares of the DLC parent companies".
4
L. Rosenthal and C. Young, 1990, "The seemingly anomalous price
behavior of Royal Dutch/Shell and Unilever N.V./PLC"
5 K. Froot and E. Dabora, 1999, "How are stock prices
affected by the location of trade?"
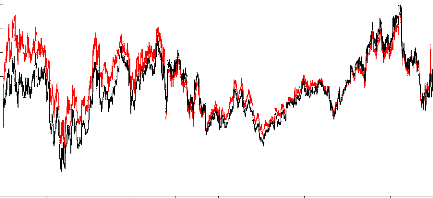
#2: Evolutions of the stocks Rio Tinto Pic (London) and
Rio
Tinto Ltd (Sydney)
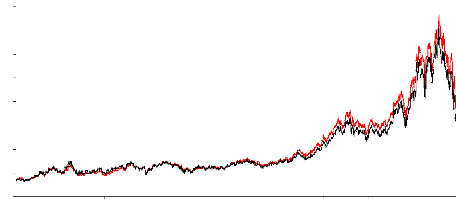
Both shares price in £, by using the dai ly currency
conversion rate A$/£
70
60
50
40
30
20
10
0
80
1998 1999 2000 2001 2002 2003 2004 2005 2006 2007 2008
Sydney London
Source: ThomsonReuters Datastream, from the 07/10/1998 to
the 07/10/2008
#3: Premium / Discount (Rio Tinto Pic vs. Rio Tinto Ltd)
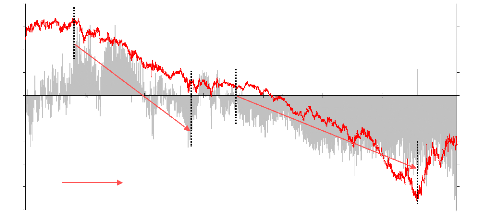
20%
Premium / Discount
min (29/09/2008) -29.88%
max (31/03/2000) 15.31%
average -3.65%
Gross tendance FTSE vs. ASX
15%
10%
5%
0%
-5%
-10%
-15%
-20%
-25%
30
10
-10
-30
-50
-70
-90
-110
-130
-150
1998 199922000 2001 2002 2003 2004 2005 2006
2007 2008
|
% Premium / % Discount (LHS) Variations FTSE vs. ASX (RHS)
|
|
Source: ThomsonReuters Datastream, from the 07/10/1998 to
the 07/10/2008 Premium / discount calculated by using the daily currency
conversion rate A$/£
#4: Evolutions of the stocks Royal Dutch N. V (Amsterdam)
and
Shell Plc (London)
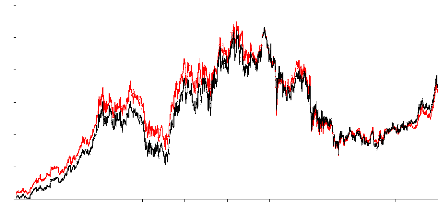
40 Both shares price in €, by us ing the daily currency
conversion rate £/€
35
30
25
20
15
10
1995 1996 1997 1998 1999 2000 2001 2002 2003 2004 2005
Royal Dutch N.V Shell Plc
Source: ThomsonReuters Datastream, from the 19/07/1995 to
the 19/07/2005, i.e. date of the complete unification of the two companies and
the creation of Royal Dutch Shell
#5: Premium / Discount (Shell Plc vs. Royal Dutch N. V)
-10%
-15%
-20%
-25%
10%
-5%
5%
0%
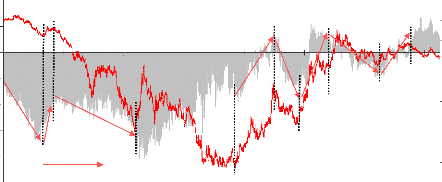
Gross tendance FTSE vs. AEX
Premium / Discount
min (03/02/1999) -20.48%
max (27/02/2003) 6.74%
average -5.62%
20
0
-20
-40
-60
-80
-100
-120
-140
-160
1995 1996 1998 1999 2001 2002 2003 2005

% Premium / % Discount (LHS) Variations FTSE vs. AEX (RHS)
Source: ThomsonReuters Datastream, from the 19/07/1995 to
the 19/07/2005 Premium / discount calculated by using the daily currency
conversion rate £/€
Both shares price in €, by us ing the daily currency
conversion rate £/€
#6: Evolutions of the stocks Unilever N. V (Amsterdam)
and
Unilever Plc (London)
26 24 22 20 18 16 14 12
10
1998 1999 2000 2001 2002 2003 2004 2005 2006 2007 2008
Unilever N.V Unilever Plc
Source: ThomsonReuters Datastream, from the 07/10/1998 to
the 07/10/2008
#7: Premium / Discount (Unilever Plc vs. Unilever N.V)
- 25%
- 10%
- 15%
- 20%
10%
-5%
5%
0%
Gross tendance FTSE vs. AEX
Premium / Discount
min (03/02/1999) -29.54% max (27/02/2003) 5.85%
average
-4.60%
20
0
- 10
- 20
- 30
- 40
- 50
10
1998 2000 2001 2002 2004 2005 2007 2008
|
% Premium / % Discount (LHS) Variations FTSE vs. AEX (RHS)
|
Source: ThomsonReuters Datastream, from the 07/10/1998 to the
07/10/2008 Premium / discount calculated by using the daily currency conversion
rate £/€
Note: In order to offset the forex variation between two stocks
listed in different currencies, we have used the day-after-day spot conversion
rate.
The analysis of the three exhibits #3, #5, #7 entitled
"Premium / Discount" and representing the cases Royal Dutch Shell, Rio Tinto
and Unilever, confirms the statement made by K. Froot and E. Dabora (see
quotation page 10). During a substantial period of time (several months or
years), the premium/discount evolution of the DLC evolves in the same way as
the difference of variation between the two stock exchanges of quotation. The
more a stock exchange outperforms the second one, the more the premium for the
stock listed on the first one increases (or the discount decreases).
The most striking case concerns Rio Tinto. During an 8-years
period of time (1998-2008), the premium of the stock listed on the L.S.E
reached a maximum of circa 15% and progressively decreased to become a discount
of circa 23% on July 2008. This decrease was quite progressive and regular over
the time. These graphs illustrate the correlation between the premium/discount
and the difference of evolution between the two stock exchanges. Over the
10-years period, the correlation between the two variables is quite strong and
reaches the value of 0.82.
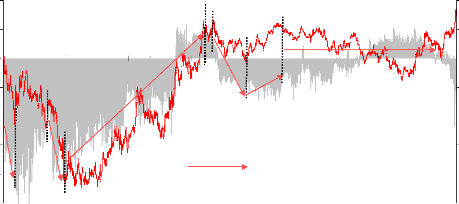
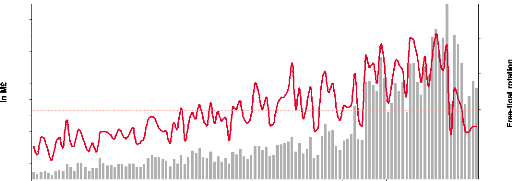
#8: 10-Years Evolution of Rio Tinto Pic Daily Free-Fioat
Rotation (London)
550
2.0%
500
450
1.6%
400
350
200
150
100
0.4%
50
0
0.0%
1.2%
300
250
10Y free-float rotation = 0.79
0.8%
1998 1999 2000 2001 2002 2003 2004 2005 2006 2007 2008

Monthly average daily volumes (LHS) % of the free-float (RHS)
Source: ThomsonReuters Datastream
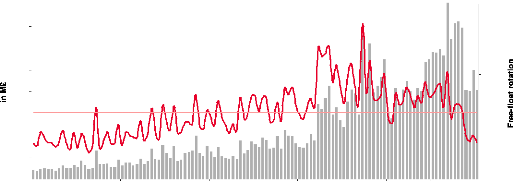
#9: 10-Years Evolution of Rio Tinto Ltd Daily Free-Float Rotation
(Sydney)
160
2.0%
0.0%
80
140
1.6%
120
100
1.2%
10Y free-float rotation = 0.76
60
40
0.8%
0.4%
20
0
1998 1999 2000 2001 2002 2003 2004 2005 2006 2007 2008
|
Monthly average daily volumes (LHS) % of the free-float (RHS)
|
Source: ThomsonReuters Datastream
As we may notice after the analysis of the two exhibits #8 and
#9, the 10-year daily free-float rotations are almost the same (0.79 vs. 0.76)
and follow the same tendency over the time. Hence, we may reject the hypothesis
that the difference of liquidity between the two stocks could have an influence
on the premium/discount variation.
Since 2002, we may notice the relative narrowing of the gap
between the two stocks, consequence of more efficient financial markets, a
growing deregulation and the fall of barriers between countries.
Through the analysis of former DLCs, we may note that since
the year 2000 a majority of DLCs have disappeared. In each case, the reasons
pleading for the total unification of the DLC were a greater liquidity thanks
to a unique stock traded and the increase of weight in benchmark index.
Moreover, companies' managements have to take into consideration that owning a
control stake in the capital of one of the two companies provides the control
of the whole DLC.
After this simplification of structure, the two listings become a
simple cross-listing.
I.2.c. Other Means
Instead of performing foreign cross-listings, companies may
decide to list locally one of their foreign subsidiaries. In 1997, Yahoo! made
such decision by listing Yahoo! Japan Corp on the Japanese market JASDAQ.
Another example was the Royal Dutch Shell and its subsidiary Shell Canada
(founded by Shell in 1911 and listed on the Toronto Stock Exchange until
2007).
However, this kind of operation is not considered as
cross-listings and will not be analyzed in this research.
I.3. Reasons Pleading for Foreign Cross-Listing
"[Dual listing] is an innovative concept that ratchet's up the
debate regarding the quality of the trading environment for securities - and
what is best for shareholders."
Jeffrey Sonnenfeld, Associate Dean, Yale School of Management
Cross-listing's rationales may be depicted into three main
motivations: business, corporate governance and financial. Generally, the
decision to initiate a foreign cross-listing results from a combination of
these three types of motivation.
I.3.a. Business Motivations
In a study surveying European managers about the benefits of
foreign listing6, managers were used to pointing out the visibility
and the notoriety as the main gains. While the visibility facilitates relations
with clients and suppliers, the notoriety helps the recognition of a brand in
foreign market.
Moreover, in some cases the question of prestige regarding the
listing place may be taken into consideration. Indeed for some companies, being
listed in financial centers like New York or London has become a mean to
distinguish themselves from their competitors. Such notion had also been
confirmed by the study of F. Bancel and C. Mittoo6.
6 F. Bancel and C. Mittoo, 2001, "European Managerial
Perceptions of the Net Benefits of Foreign Stock Listings"
I.3.b. Corporate Governance Motivations
Regarding corporate governance matters, there are several reasons
pleading in favor of foreign cross-listing.
Firstly, one of the most evoked elements by managers is the
gain in recognition, since both media and financial analyst coverage increase
after a foreign cross- listing. The more a stock is covered by analysts, the
more it draws the attention from the market and investors.
Secondly, a foreign cross-listing may be useful for companies
based in countries providing low domestic regulatory standards. By being listed
in a major financial place and by adopting higher accounting/governance
standards, the company sends positive signals to the market by providing more
reliable and more qualitative information to investors.
Thirdly, the management may be attracted to broaden, to
diversify and to internationalize the company shareholder basis. A foreign
cross-listing allows the company to access to a greater range of institutional
and individual investors. Nowadays, international markets remain in a certain
way relatively segmented, domestic investors keeping a strong motivation
(legal, fiscal and cultural) to invest in domestic stocks. This is notably the
case in the United States where some pension funds, one of the most important
types of investors, have limitations for their foreign investments (e.g. can
only hold dollar denominated instruments or have a threshold for foreign stocks
corresponding to a percentage of their total assets) and thus have a limited
access to international markets. By being directly listed on the local American
stock exchanges, foreign companies may get round this problem.
Moreover, in 1987 R. Merton7 explained that investors
are usually inclined to invest in companies they know, that is to say in
domestic shares.
Fourthly, there is a matter of quality investor's right.
Indeed, for investors one of
the most fundamental determinants is the
protection of their rights, evidence
7 R. Merton, 1987, "A Simple Model of Capital Market
Equilibrium with Incomplete Information"
showed by W. Reese and M. Weinbach8. Furthermore,
R. La Porta, F. Lopez de Silanes, A. Shleifer and R. Vishny(9 and
10) arrived at the conclusion that "the legal system is the primary
determinant for external financing in a country" and "the common-law system
provides better quality protection for investors than civil-law systems".
Nowadays, the common law system is widespread in countries with British
heritage like the United Kingdom, the United States, South Africa, Canada,
Australia and so on.
Fifthly, foreign cross-listing may also be a mean to
facilitate merger and acquisition operations (M&A) with foreign companies,
notably by providing the possibility to pay the target by the mean of share
exchange. Such evidence had been pointed out by P. Tolmunen and S.
Torstila11, through the study of "196 European firms cross-listed in
the U.S. showing that cross-listed firms are significantly more active than
matching pair firms in U.S. acquisitions. Cross-listed firms are also somewhat
more likely to use equity payment, particularly in the year of cross-listing.
The act of cross-listing, however, does not in itself increase the likelihood
of U.S. acquisitions for any given company: rather, cross-listed firms are
likely acquirers both after and before the cross-listing. After cross- listing,
however, the proportion of aggregate M&A volume financed with equity
increases, as cross-listed shares are used to finance large acquisitions".
After an important M&A operation with shares exchange, the
buyer often asks for the admission of its shares on the target's main listing
places. The goal is to remain close to the target's main clients, suppliers,
investors, banks and authorities. This point is more public relationships than
pure financial preoccupations.
Furthermore, foreign cross-listings consecutive to M&A
operations allow to comply with an element thereby called in this research
"national sensibility" or simply "economic patriotism". Sometimes, it appears
to be unthinkable and politically inconceivable that a national champion
completely disappears after being acquired by a foreign company. For the buyer,
becoming cross-listed on the stock exchange of the target's incorporation
country allows to maintain a part of the target's identity and may facilitate
the transaction with local investors and authorities.
8 W. Reese and M. Weinbach, 1999, "Protection of
Minority Shareholder Interests, Cross-listing in the United States, and
Subsequent Equity Offerings"
9 R. La Porta, F. Lopez-de-Silanes, A. Shleifer and R.
Vishny, 1998, "Law and Finance, Journal of Political Economy"
10 R. La Porta, F. Lopez-de-Silanes, A. Shleifer and
R. Vishny, 1997, "Legal Determinants of External Finance"
11
P. Tolmunen and S. Torstila, 2002, "Cross-Listings and M&A
Activity: Transatlantic Evidence"
There are different cases of M&A operations:
4 Hostile takeover: e.g. in 2006 Mittal Steel and its
successful takeover bid on Arcelor. The new group ArcelorMittal had been
admitted for listing on Euronext Paris, Euronext Brussels, BME Madrid and
Bourse de Luxembourg, in addition to Mittal's listing places Euronext Amsterdam
and the Nyse (further details are given in part IV.5. ArcelorMittal's Case
Study).
4 Merger: e.g. in 2007 Unibail-Rodamco which had been created
by the merger between the French Unibail and the Dutch Rodamco. Since, the new
created company Unibail-Rodamco is cross-listed in both countries and is a
constituent of the two national reference indexes (CAC 40 and AEX).
4 Merger through a dual-listing: InBev, one of the world
leading brewers resulting from the combination (2004) of the Belgian InterBrew
and the Brazilian Ambev. As a result, InBev is now listed on Euronext Brussels,
whereas Ambev remains listed on the Brazilian Bovespa. In 2008, InBev launched
a successful bid on the biggest American brewer Anheuser-Busch, and will
consider a new listing in Anheuser-Busch's home country, i.e. the Nyse.
4 Spin-off: in 2008, Suez Environnement has been cross-listed
on Euronext Paris and on Euronext Brussels, i.e. the two main listing places of
its mother company, GDF-Suez.
Finally, we may consider that two different types of foreign
cross-listings may occur:
4 Active cross-listing, where the foreign cross-listing
operation results from the management's decision.
4 Passive cross-listing, where the foreign cross-listing
operation results from a M&A operation.
I.3.c. Financial Motivations
Nowadays, the growing globalisation and accessibility to
financial markets all around the world make the geography less and less
relevant: restrictions for international capital movements disappear, trading
costs decrease, stocks exchanges merge or enter into alliances, and so on. The
purpose of a foreign cross-listing may be the presence in a wider, more
efficient and more innovative financial market than its incorporation country
one. We may give the example of Russian and Indian companies which are listed
in their domestic financial place, but also often in London or in New York.
Influences on the shares
First of all, a foreign cross-listing increases the trading
volumes and therefore improves the overall liquidity. In efficient markets,
greater liquidity should be translated into lower cost of capital, since
liquidity is valued by investors. Y. Amihud and H. Mendelson12
stated that "the theory of corporate finance has been based on the idea that a
company's market value is determined mainly by just two variables: the
company's expected after-tax operating cash flows or earnings, and the risk
associated with producing them." The two authors also argued that "there is
another important factor affecting a company's value: the liquidity of its own
securities, debt as well as equity". For instance, since 2008 more and more
companies initially listed on the Londoner fast growing market AIM (Alternative
Investment Market) have initiated cross-listings on Euronext Alternext in order
to offset the lack of liquidity on their primary stock exchange and to benefit
from a second European market in the Eurozone, the world's second main
currency. This was the goal of IPOs of British companies Proventec and Accsys:
"European investors are not comfortable dealing in the AIM market. There aren't
many market makers handling our shares, there aren't many market makers
handling most AIM shares 11.3 we do not want to knock AIM but want to provide
better liquidity for our European investors", Proventec's CEO
said13.
12
Y. Amihud and H. Mendelson, 2008, "Liquidity, the Value of the
Firm, and Corporate Finance", Journal Applied Corporate Finance
13 See Appendix 2: Article by Jon Mainwaring, The
Independent published on Sunday, 10 February 2008, "AIM companies bid for dual
listings on Euronext to boost liquidity"
Then, the reduction of transaction costs should also improve
the volumes and the liquidity, by encouraging investors to perform more
buy/sell operations. However, in his study14 published in 2001, J.
Hamet highlighted that cross-listings may affect the equilibrium of the
markets. Indeed, Hamet's rationale suggests that trades in each listing place
may risk to become more limited, not facilitating the pricing discovery
process.
Moreover, in part I.3.b. Corporate Governance Motivations, we
have already dealt with the influence of the shareholding diversification for
the corporate governance. However, according to R. Merton, it is also possible
to establish the positive impact of the shareholder basis widening on the stock
price. R. Merton15 stated "when the shareholder base broadens,
risks' sharing improves, bringing about a positive impact on stock prices. [..]
Smaller shareholder base is associated with lower firm value".
Finally, we may imagine that a foreign cross-listing in
markets having different time zones may reduce the volatility of the stock. In
this perspective, P. Lowengrub and M. Melvin16 arrived at the
conclusion that pricing errors are reduced because "it facilitates the process
of assessing a stock's value at the beginning of the trading session. At the
opening of the trading, prices are less volatile for shares that traded
overnight on another exchange than for those that did not".
Influences on the cost of capital
Through a foreign cross-listing, there are different ways to
influence a company's financing.
Firstly, we may consider a positive influence on the cost of
capital thanks to a better access to capital markets. Indeed, empirical
studies17 showed that the cost of equity generally declines after a
foreign cross-listing. This decline may be explained by the access to easier
and more competitive financing conditions
14 J. Hamet, 2001, "La cotation des titres d'une
entreprise française sur un marché étranger et ses
conséquences pour l'actionnaire", PUF
15 R. Merton, 1987, "A simple Model of Capital Market
Equilibrium with Incomplete Information", Journal of Finance 72, No.3
16 P. Lowengrub and M. Melvin, 2006, "Before and
After International Cross-Listings: An Intraday Examination of Volume and
Volatility"
17
A. Karolyi, 1998; R. Stulz, 1999; V. Errunza and D. Miller,
2000
(loans, issuance of shares, equity-linked or bonds
instruments), but also by the elements previously given in part I.3.b Corporate
Governance Motivations, i.e. a decrease of transaction costs for investors, a
higher reliability and quality of information provided to investors, as well as
a better investor protection. For instance, a higher reliability and quality of
information may reduce the investor's cost for researching information and the
risk related to a company, therefore allowing the company to obtain lower cost
of funding, R. Stulz18.
Secondly, the increase of the company's geographical customer
basis helps to lower the company's beta R (see Appendix 1) which
impacts downwards the cost of capital, R. Stulz18, P. Martin and H.
Rey19, D. Lombardo and M. Pagano20.
Influences on the valuation
As a matter of fact, it is well established that the cost of
funding has an influence on the company's valuation.
In its study, L. Zingales21 measured the
difference between market value and book value, with the conclusion that
"shares of foreign companies listed both in the company's home market and on a
U.S. stock market traditionally trade at a higher valuation as a percentage of
book value than domestic peers that aren't cross-listed. A cross-listed company
traded at 150% of book value and a similar company from the same country listed
only on their home market traded at 120% of book value, the valuation premium
would be 30 percentage points. [..] The premium for listing on both U.S. and
foreign markets averaged 51 percentage points from 1997 to 2001. It dropped to
31 percentage points between 2002 and 2005". As a consequence, we may deduct
that investors would pay more for a company listed in the United States, mainly
for the reasons given previously in this research.
The influence of the corporate governance on company's
valuation had already been highlighted by the work of P. Hostak, E. Karaoglu,
T. Lys and Y. Yang22, who noticed that "compared to foreign firms
that maintained their ADRs, foreign firms which voluntarily delisted have
weaker corporate governance, had a less negative
18 R. Stulz, 1999, "Globalization of Equity Markets
and the Cost of Capital"
19 P. Martin and H. Rey, 1999, "Financial Integration
and Asset Returns"
20 D. Lombardo and M. Pagano, 1999, "Law and Equity
Markets: A Simple Model"
21 L. Zingales, 2006, "Is the U.S. capital market
losing its competitive edge?"
22
P. Hostak,, E. Karaoglu, T. Lys and Y. Yang, 2007, "An
Examination of the Impact of the SarbanesOxley Act on the Attractiveness of US
Capital Markets for Foreign Firms"
stock market reaction when SOX was passed, and suffered a
significant price decline in their home-markets when they announced their
intention to delist."
Over the years, some financial places have managed to become
the center of gravity for some sectors: Nasdaq has become a natural stock
exchange for investors and funds specialized in technology-IT-biotech, whereas
the places of London, Toronto and Sydney own a real expertise in Mining and Oil
& Gas sectors. Such evidence has already been showed by A. Blass and Y.
Yafeh23 with the demonstration that Dutch and Israeli companies
performing a listing in the United States are "young, fast growing,
overwhelmingly high-tech oriented and highquality innovative".
Furthermore, not being listed in a place specialized in its
sector, may contribute to a lower the liquidity, and therefore the company's
stock underperformance in comparison to its sector.
Being foreign cross-listed may also help the company to gain
in price-to-earnings ratio (P/E). Indeed, it is well established that the
difference of the average P/E between stock exchanges (see exhibit #10) may
offer substantial gap, and therefore lead to important difference in market
capitalisation for companies evolving in the same sector.
#10: Historical Average P/E of the World Main Stock
Exchanges
(Period 2000-2007)24
61.8 59.8
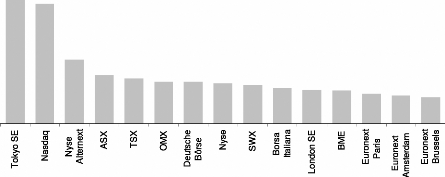
31.9
24.1 22.6 21.1 20.9 20.2 19.2 17.9 16.7 16.4 14.9 14.1 13.2
23 A. Blass and Y. Yafeh, 1999, "Vagabond Shoes
Longing to Stray: Why Foreign Firms List in the United States"
24
Sources: World Federation of Exchanges, Bloomberg,
ThomsonReuters Datastream
As we can see in the exhibit #10, there are major differences
of valuation between stock exchanges. For instance, the Nasdaq offers a 7-years
average P/E of 59.8 whereas the Nyse and Euronext Paris offer respectively 20.2
and 14.9. By taking advantage of this mispricing (low domestic P/E in
comparison to foreign P/E), a company may initiate a foreign cross-listing on a
stock exchange where its peers benefit from relative higher P/E.
#11: 2007 P/E Comparison of Foreign Companies Foreign
Cross-Listed
on American Stock Exchanges
Origin Country
|
Average P/E of Foreign
|
Average P/E on the Primary Premium/
|
|
Companies on the Nyse
|
Stock Exchange Discount
|
Latin America
|
13.1x
|
9.9x
|
|
|
|
India
|
11.7x
|
9.7x
|
20%
|
|
China Hong Kong
|
11.9x
|
8.4x
|
41%
|
|
Shanghai
|
19.2x
|
13.3x
|
44%
|
|
Canada
|
15.5x
|
11.2x
|
39%
|
|
U.K
|
10.4x
|
7.7x
|
34%
|
|
Western Europe
|
12.1x
|
10.6x
|
14%
|
|
Japan
|
11.7x
|
12.5x
|
(7%)
|
South Korea
|
7.4x
|
8.4x (12%)
|
|
Average P/E of Foreign
Companies on the
Nasdaq
|
|
Average NewTech's P/E on
the Tel Aviv
SE
|
|
Premium/
Discount
|
|
|
|
|
|
|
Israel* 15.1x 13.8x 9%
P/Es are calculated with 2007 net incomes and market
capitalisations as of the 06/11/2008
* Regarding Israeli companies, we compared those
cross-listed on the Nasdaq, due to their large presence on this stock
exchange
Sources: ThomsonReuters Datastream, Bloomberg
The exhibit #11 corroborates the statement previously enounced
concerning the
companies originating from MEDC25 but also from
emerging countries. However,
two notable exceptions exist with the cases of
Japanese and South Korean
25 More Economically Developed Countries (Western and
Northern Europe, Canada, the United States, Japan, South Korea, Australia and
New Zealand)
companies, consequence of the 1990s stagflation impact and
overvalued companies in comparison to their results.
By analyzing the premium/discount, it emerges that a foreign
cross-listing on the Nyse allows companies to gain on average 23% in P/E;
figure which is quite significant because it concerns companies with market
capitalisation in billion U.S. Dollars.
Other influences
Through a foreign cross-listing and the exercise of
stock-options, a company may dispose of a new mean to pay its employees in
foreign subsidiaries. This solution is more convenient, may be done at a lower
cost and enables the association of foreign employees in the capital.
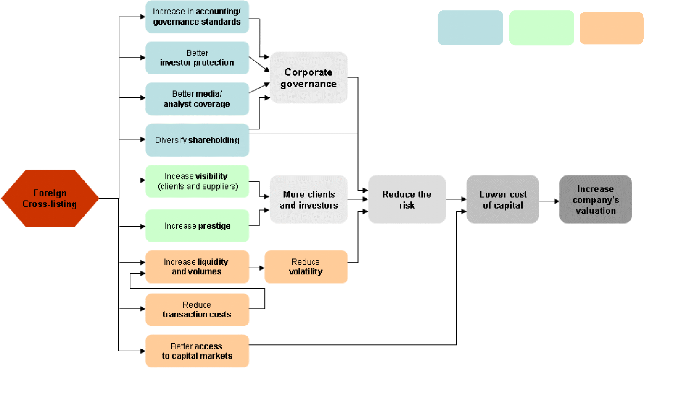
I.3.d. Main Impacts of the Foreign Cross-Listing
As we noticed, foreign cross-listing may theoretically have
many impacts, all resumed by the following diagram #12. In fine, the goal of a
foreign cross-listing is to influence the company's valuation for the benefit
of shareholders.
All connections and impacts (see next page, exhibit #12)
Corporate
Governance
Other minor rationales:
n M&A purposes
n National sensibility / economic patriotism
n Different trading time zones
Business
Financial
I.4. Different Geographical Origins Imply Different
Purposes
After the analysis of the reasons pleading for foreign
cross-listing, companies may be depicted into two main classes, each one
differentiated by its purposes.
The first class is mostly made up of companies originating
from the MEDC countries. These companies generally decide to perform one or
several foreign cross-listings in another MEDC country for business and/or
financial motivations, but also sometimes to comply with reasons of "national
sensibility" (further details in part I.3.b. Corporate Governance Motivations,
sub part M&A operations).
As regards the second class of cross-listed companies, we may
consider companies originating from the emerging countries, mostly from the
BRIC (Brazil, Russia, India and China), but also to a lesser extent from
Mexico, Turkey, South Korea, Taiwan, Indonesia and South America. The main
purposes are more oriented towards corporate governance matters (accounting
standards, investor's rights protection, better media/analyst coverage,
visibility to clients and suppliers), but also towards the access to easier and
more competitive financing conditions.
Conversely to the tendency in the MEDC countries, foreign
cross-listings still have an interest for companies from emerging countries. Up
to now, there is still a large number of foreign cross-listings with issuers
from emerging countries, consequence of not sufficiently developed local
financial markets and low domestic regulatory standards.
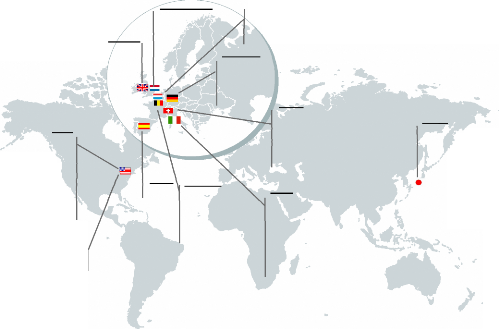
II. Geography of the Foreign Cross-Listing
II. 1. Methodology for the Creation of the Sample
II.1.a. Sources
Different sources had been used and cross-checked for the
creation of the sample, therefore allowing us to develop our foreign
cross-listing analysis.
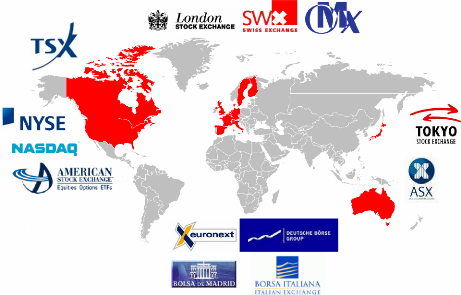
This analysis focus on 15 stock exchanges (4 North American,
11 Western European, 1 Japanese, 1 Australian) located in 15 developed
countries, and representing 85.31% of the world total trading value as of July
2008 YTD26, i.e. US$49,856,092 million27.
#13: Map of the Stock Exchanges Selected for the Analysis
26 YTD means Year-to-date, as of July 2008
27
Calculated with data from the World Federation of Exchanges
#14: Stock Exchanges Share of Worldwide Volumes July 2008 YTD
|
Share inTotal
|
Western
|
Share inTotal
|
|
Share inTotal
|
|
Americas
|
Trading Value
|
Europe
|
Trading Value
|
Asia-Oceania
|
Trading Value
|
|
|
|
|
|
|
|
Nyse
|
35.16%
|
L.S.E
|
7.81%
|
Tokyo SE
|
6.04%
|
|
Nasdaq
|
14.69%
|
Deutsche Bôrse
|
4.36%
|
ASX
|
1.49%
|
|
Nyse Alternext
|
0.66%
|
Euronext
|
5.10%
|
|
|
|
TSX
|
1.90%
|
Paris
|
|
|
|
|
|
Amsterdam
|
|
|
|
|
|
Brussels
|
|
|
|
|
|
SWX
|
1.76%
|
|
|
|
|
OMX
|
1.56%
|
|
|
|
|
Borsa Italiana
|
1.88%
|
|
|
|
|
BME
|
2.89%
|
|
|
Source: World Federation of Exchanges
In a first step, we used stock exchanges' websites in order to
get the complete lists of all foreign companies listed on each places.
4 Nyse (New York Stock Exchange)
4 Nasdaq
4 Nyse Alternext, former Amex (American Stock Exchange)
4 TSX and TSX Venture (Toronto Stock Exchange)
4 Euronext-Alternext Paris, Amsterdam, Brussels
4 L.S.E-AIM
4 Deutsche Biirse
4 SWX/VTX (Swiss Stock Exchange)
4 OMX Nordic Exchange (Stockholm, Copenhagen and Helsinki)
4 Borsa Italiana
4 BME (Bolsas y Mercados Espafioles)
4 ASX (Australian Stock Exchange)
4 TSE (Tokyo Stock Exchange)
After a precise analysis and cross-check with several tools
like Bloomberg and ThomsonReuters Datastream, we had arrived to a final sample
composed of 1,347 foreign cross-listing cases.
However it is important to notice that the figure 1,347
includes cases where a company owns multiple foreign cross-listings. The
company ArcelorMittal is one of these cases with listings on Euronext Paris,
Euronext Brussels, Euronext Amsterdam, Bourse du Luxembourg, BME Madrid and on
the Nyse.
Afterwards, as regards of the analysis of data such as the
performances, the volumes, the sales or the net incomes, the sample had been
reduced to companies providing daily trading information with tools like
Bloomberg and ThomsonReuters Datastream.
II.1.b. Statements and Assumptions Regarding the
Analysis
In this analysis,
4 If a company is listed on different stock exchanges belonging
to the same country, e.g. Nyse/Nasdaq or Frankfurt/Xetra, we had only
considered it once.
4 If a company owns on the same stock exchange different
kinds of financial instruments (e.g. class A and class B shares, different
kinds of ADR, shares and ADR), we had only considered it once. For instance,
this was the case of the Japanese companies Torray Industries and Fujitsu
listed on the L.S.E.
4 In the sample, we consider DLCs (Dual-Listed Companies).
4 As regards listings in Germany (Frankfurt and XETRA), the
quasi totality of listed companies in the world are proposed to the trading by
the operator Deutsche Biirse, i.e. a total of 11,355 German and foreign
companies. However, in this research we had only considered companies having
initiated by themselves foreign cross-listings in Germany.
The following cases had been excluded from the sample,
4 ETF (Exchange-Traded Funds) or index trackers, e.g. Lyxor
ETFs, iShares, PowerShares, and so on
4 Companies which are not listed in their (or at least one of
their) incorporation country(ies)
4 OTC (Over-the-Counter) traded shares
4 Non-sponsored Depositary Receipts (DRs)
Stock Exchange
TSX 34 2173 12 1 2
SWX 60 4 16 2 12 20 6 251 7 1 7 135 6
141 392 36,0%
OMX 3 3 1 676 7 0 7 682
1,0%
BME 1 1 1 1 151 1 5 29 34 192
17,7%
Borsa Italiana 1 6 17 12 1 1 3 286 41 1
42 328 12,8%
Tokyo SE 8 1 1 3 2 1 1 1 2271 18 2
20 2295 0,9%
ASX 8 10 2024 18 15 33 2056
1,6%
Nyse 2869
Nasdaq 2895
Nyse Alternext Amex) 759
Euronext Amsterdam 2 2 142 4 7 2 9 1 2 29
6 35 196 17,9%
Euronext Brussels 4 187 6 1 11 8
19 237 8,0%
Euronext Paris 15 8
Deutsche Börse 3 1 2 1 5 1307 3 2 1 2 2 1
23 7 30 1336 2,2%
L.S.E 31
Origin
Sc
U.S Canada NL Belgium France Germany U.K Swiss Spain
Italy Japan Australia
andinavia
36
42
76
62
4 3 3 5 1 3 7 10 72 61 133 3200 4,2%
6 1 9 9 26 5 4 5 5 19 5 170 148 318 3620
8,8%
7 3 9 1810 5 4 17
9
673 3 11 1 0 2 1 50 15 65 756 8,6%
2 1 65 2 67 862 7,8%
36
26
Total from
MEDC
Countries
154 156 310 2333 13,3%
75 18 93 2369 3,9%
Total from
Emerging
Countries
Total
Cross-
Listings
# of local
companie
s listed
% of foreign cross- listings
3,5%
2,4% 3,9%
10 55 79 873 474 1347
1,1% 6,3% 9,0% 100%
11.2. Presentation of the Results

Total Listings
|
166
|
224
|
55
|
17
|
66
|
61
|
89
|
11
|
25
|
15
|
Degree of cross-listing
|
2,6%
|
10,3%
|
38,7%
|
9,1%
|
9,8%
|
4,7%
|
4,9%
|
4,4%
|
3,7%
|
9,9%
|
Weight / total
|
19,0%
|
25,7%
|
6,3%
|
1,9%
|
7,6%
|
7,0%
|
10,2%
|
1,3%
|
2,9%
|
1,7%
|
|

#15: Geographic Distribution of Foreign Cross-Listings from the
MEDC Countries28
#16: Geographic Distribution of Foreign Cross-Listings from
non-MEDC Countries

Origin
Stock Exchange
Nyse Nasdaq
Nyse Alternext (Amex)
TSX
Euronext Amsterdam Euronext Brussels
Euronext Paris
Deutsche Börse
L.S.E SWX OMX BME Borsa Italiana
Tokyo SE
ASX
Total Listings
Lux.
Greece
|
Ireland
|
Austria
|
Lichtens
Portugal
tein
|
Russia
|
Turkey
|
Eastern
Europe
|
China
|
India
|
South
Korea
|
Taiwan
|
Pakistan
|
Indonesi
a
|
Singap.
|
New
Zealand
|
Africa /
Middle
East
|
Israel
|
South
Am.
|
1
|
3
|
4
|
|
1
|
|
5
|
1
|
1
|
20
|
10
|
8
|
5
|
|
2
|
|
1
|
6
|
3
|
77
|
1
|
|
3
|
|
|
|
|
|
|
|
1
|
1
|
1
|
|
|
1
|
|
5
|
42
|
6
|
|
|
|
|
|
|
|
|
|
1
|
|
|
|
|
|
|
|
|
1
|
|
|
|
|
|
|
|
|
|
|
4
|
|
|
|
|
|
|
2
|
9
|
|
3
|
4
|
|
|
|
|
|
|
|
|
|
2
|
|
|
|
|
|
|
|
|
|
4
|
|
|
|
|
|
|
|
|
|
|
|
|
|
|
|
|
1
|
3
|
|
5
|
|
|
|
|
|
|
|
|
|
|
|
|
|
|
|
|
9
|
|
1
|
|
|
4
|
|
|
|
3
|
|
|
|
|
|
|
|
|
|
|
|
|
|
2
|
5
|
1
|
|
1
|
|
24
|
9
|
12
|
7
|
22
|
13
|
9
|
3
|
1
|
1
|
|
42
|
4
|
|
1
|
|
|
1
|
|
2
|
|
|
|
|
|
|
|
|
|
|
|
2
|
|
|
|
|
|
|
|
|
|
|
|
|
|
|
|
|
|
|
|
|
|
29
|
1
|
|
|
|
|
|
|
|
|
|
|
|
|
|
|
|
|
|
|
|
|
|
|
|
|
|
|
|
|
|
|
1
|
|
|
1
|
|
|
|
|
|
|
|
|
|
|
|
|
|
|
|
|
|
|
|
|
1
|
12
|
2
|
|
|
19
|
8
|
12
|
1
|
2
|
2
|
32
|
10
|
13
|
32
|
35
|
23
|
15
|
3
|
4
|
3
|
15
|
76
|
53
|
116
|
|
II.3. Empirical Interpretation of the Results
II.3.a. Geographic Distribution
This study focuses on companies which are foreign
cross-listed on the main world financial places located in 15 countries: the
United States, Canada, Australia, Japan, The United Kingdom, France, Germany,
the Netherlands, Belgium, Switzerland, Northern Europe (Sweden, Finland and
Denmark), Italy and Spain.
This analysis records a total of 1,347 foreign cross-listing
cases. Among these 1,347 foreign cross-listings, 873 (64.8%) come from the main
MEDC28 countries, whereas the rest comes from Eastern Europe,
Russia, Turkey, China, India, Taiwan, South Korea, Pakistan, Indonesia,
Singapore, New Zealand, Israel, South America and Africa.
As we could anticipate, the most attractive places are the
American stock exchanges (Nyse, Nyse Alternext and Nasdaq), the L.S.E and to a
lesser extent the Swiss Stock Exchange, with respectively 518, 310 and 141
cross-listings of foreign companies. This supremacy is probably linked to the
strong degree of internationalisation of these stock exchanges (see following
exhibit #17), the predominant influence of three of the strongest currency in
the world (US Dollar, British Pound and Swiss Franc), but also the weight in
the world financial system of Wall Street, the City and the Swiss banking
industry.
#17: Weight of Foreign Companies on Each Main Stock
Exchange29
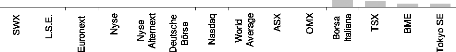
21.7%
19.6% 18.2% 17.6%
12.1% 11.5%
7.0%
4.1% 3.1% 2.0% 1.8% 1.1% 1.0%
24.4%
Source: World Federation of Exchanges
28 More Economically Developed Countries (Germany,
France, U.K, Switzerland, Italy, Spain, Netherlands, Belgium, Scandinavia,
Canada, the United States, Japan and Australia)
29 Excluding investment funds and Calculated in terms
of number of companies
The exhibit #18 provides a global overview of the interest in
foreign cross-listin by local companies.
#18: Number of National Companies Cross-Listed Abroad
Total Cross-
Listings Abroad
Degree of
cross-listing 43
Total Cross-
Listings Abroad
Degree of
cross-listing 43
|
U.S
|
Canada
|
France
|
Japan
|
Australia
|
|
Worldwide
|
Spain
|
Italy
|
|
224
|
|
79
3.9%
Belgium
|
Swiss
|
873
4.7%
Scandinavia
|
|
10.3%
|
|
U.K
|
|
89
4.9%
|
66
|
55
|
17
|
11
4.4%
|
25
|
15
|
10
3.5%
|
|
38.7%
|
9.1%
|
|
9.9%
|
|
The Canada and the United States present both the greater
number of cross- listings abroad, with respectively 224 and 166 cases, that is
to say 25.7% and 19.0% of the total sample. However, after a more precise
analysis of the degree of cross-listings31, it appears that Canadian
companies are much more favorable for foreign cross-listings, since 10.3% of
companies listed on the TSX and TSX Venture have another listing abroad vs.
only 2.6% for American ones. In the past, Canadian companies have been
historically cross-listed in the United States, whereas the reverse is not
completely true: 77.7% of Canadian foreign cross- listings are performed in the
United States vs. only 20.5% for American companies in Canada. Worldwide, the
degree of cross-listing represents 4.7% of all national listings.
According to the results, it emerges that companies from the
Euro Zone32 are the most eager to perform foreign cross-listings
(Euro Zone average at 8.2%), even if result are relatively disparate (from 3.5%
up to 38.7%). The other countries reach a maximum of 4.9% (one notable
exception, Canada which is at the same level as France and Spain, i.e. circa
10%). Moreover, the Euro Zone companies appear more likely to perform a second
listing inside the Euro Zone (77.2% of cases),
30 Number of cross-listings performed by national
companies / Number of national companies listed
31 # of cross-listings abroad performed by national companies /
Total # of national companies listed on the national stock exchange
32 The Netherlands, France, Spain, Belgium, Germany
and Italy
whereas at the European Union scale the figure decreases to
64.2%. This result is not surprising since we may point up the beginning of a
unified European market materialized by a unique currency, a common top
authority (the European Commission) and the total abolition of borders.
#19: Distribution of French Cross-listed Companies
Peugeot Saint Gobain
Frankfurt
Eurotunnel
EADS Lagardère Sanofi
Saint Gobain Total
Tokyo
Alcatel-Lucent
Nyse
BNP Paribas
*****
Societe Generale *
***
Swiss
Alcatel-Lucent GDF Suez
Axa Sanofi
BNP Paribas Scor
Danone Saint Gobain
France Telecom Total
LVMH Vivendi
Spain
Brussels
~ ~~ ~ ~ ~
Milan
EADS

Alcatel-Lucent
Axa
CGG Veritas
France
Telecom
Sanofi (ADR)
STMicroelectronics
Total
Thomson
Veolia
(ADR)
Alcatel-Lucent
GDF Suez Peugeot
Saint Gobain
Total Vranken-Pommery
Nasdaq
* Dassault Systemes
** Ilog
*** Wavecom
Alcatel-Lucent LVMH
AXA PPR
BNP Paribas Renault
Carrefour Sanofi
Crédit Agricole Societe Generale Danone
STMicroelectronics
France Telecom Vivendi
GDF suez Total
L'Oréal
Amsterdam
Alcatel-Lucent Saint Gobain
Air France-KLM STMicroelectronics EADS
Unibail-Rodamco
Gemalto
Luxembourg GDF Suez
London
Sources: Companies
* The delisting of Dassault Systemes from the Nasdaq in 2008
is in progress
** In 2008,the American IBM launched a takeover on
Ilog
*** In December 2008, the Canadian Sierra Wireless launched
a takeover on Wavecom
**** Societe Generale has announced its delisting from Tokyo
for the end of 2008 ***** BNP Paribas has announced its delisting from Tokyo
during the year 2009
II.3.b. Sector
A closer look at the exhibits #15 and #16 highlights the
correlation between the foreign cross-listings and the dynamism of cross-border
mergers/acquisitions at the European scale (e.g. connections between
France/Italia, France/Netherlands, U.K./Netherlands and
Germany/Switzerland).
As noticed in part I.3.c Financial Motivations, the findings
also verify the attractiveness of specialized financial places for some
sectors. The case of the Toronto Stock Exchange (TSX) is particularly eloquent
(see exhibit #20); among all the foreign cross-listings on the TSX, 87% are
performed by companies operating in the Mining or Oil & Gas sectors. The
analysis of the typical Canadian company listed on the TSX shows that more
Mining and Oil & Gas companies are listed on the TSX than on any other
financial place in the world (Mining and Oil & Gas represent 402 of the 612
Canadian companies listed on the TSX). This result is the consequence of the
major influences of these sectors within the Canadian economy.
#20: Weight of Companies Operating in
he Mining and Oit
& Gas sectors in the TSX
|
Canadian
Companies
on the TSX
|
Foreign
Cross-Listings
on the TSX
|
Mining
|
267
|
87
|
Oil & Gas
|
135
|
12
|
Sum
|
402
|
99
|
% of all Canadian companies on the TSX
|
66%
|
|
|
% of cross-listed companies on the TSX
|
|
87%
|
|
|
This tendency may also be verified with the
technology-IT-biotech companies foreign cross-listed on the Nasdaq, with 77% of
Australian cross-listed companies operating in the Pharmaceutical or
Biotechnology sector.
Another example: among the 41 Israeli cross-listed companies
on the Nasdaq, 40 are operating in the Pharmaceutical, Biotech or IT sectors.
In comparison, there are only 3 Israeli foreign cross-listings on the Nyse and
4 on the L.S.E.
Moreover, we may notice that a major player within a sector
has an influence on the foreign cross-listings of its peers by attracting them
in its primary listing place. The rationale for such operation is the
following: when a financial place and its local investors are familiar with a
sector thanks to the presence of a local important player, it may be natural
for competitors to approach these same investors and therefore to raise
capital.
For instance, the analysis of British companies foreign
cross-listed on Euronext Paris shows that these companies own an important
subsidiary operating in the French market or have a French important
competitor. Among the 11 British companies cross-listed on Euronext Paris
4 HSBC owns the former French bank CCF since 2005
4 Kesa owns Darty, the second largest business unit of the group
(after Comet)
4 Kingfisher owns Castorama, the second largest French retailer
of home improvement tools and supply
4 Diageo is the main competitor of Pernod-Ricard, the world's
second largest player in the beverage sector
4 BP is one of the main competitors of the French major Total
4 Hammerson and Segro are competitors of world biggest real
estate company, the French-Dutch Unibail-Rodamco
As regards the 42 foreign companies cross-listed in Italy
4 AXA, Allianz, Aegon, Fortis, ING are competitors of the
3rd European insurer, Generali
4 Total is one of the main European competitors of the major
Eni
4 BNP Paribas and Credit Agricole are foreign cross-listed in
Italy since their important acquisition of Italian banks, respectively BNL
and
Ca riparma/FruilAdria
4 LVMH and PPR made important Italian acquisitions such as
Fendi, Gucci, Bottega Veneta
II.3.c. Size and Growth
As anticipated in part 111.1. Decreasing Advantages and
Increasing Concerns ?, a focus on companies' size shows that foreign
cross-listings are in the very great majority performed by large companies,
with 76.4% of the sample presenting a market capitalisation greater than US$1bn
(as of October 2008). The main reason behind this tendency is the cost related
to a foreign listing which is a financial border between small and large
companies.
According to the results, foreign cross-listed companies present
on average sales of US$31.2bn and a market capitalisation of US$26.8bn.
#21: Average Sales and Market Capitalisation of
Companies
Composing the Sample
Total Sales
(mUS$)
|
|
Market Cap.
(mUS$)
|
|
|
|
|
Average 31238 26793
Median 9640 8274
Source: ThomsonReuters Datastream
#22: Breakdown of the Sample by Market Capitalisation
5.3%
9.9%
8.5%
6.6%
3.9%
9.1%
13.5%
14.4%
28.8%
76.4%
More than $100bn
Between $75bn - $100bn
Between $50bn -
$75bn
Between $20bn - $50bn
Between $10bn - $20bn
Between $1bn -
$10bn
Between $500m - $1 bn
Between $100m - $500m
below $100m
Source: ThomsonReuters Datastream
#23: Average Sales and Market Capitalisations by Stock
Exchange (in mUS$)
Sales Mkt Cap Sales Mkt Cap Sales Mkt Cap
28522 27819 6516 3263 194 420
Milan
|
Swiss
|
Frankfurt
|
Paris
|
|
Sales Mkt Cap Sales Mkt Cap Sales Mkt Cap Sales Mkt Cap
63801 54269 57650 45209 44832 52508 42048
39410
Sales Mkt Cap Sales Mkt Cap Sales Mkt Cap
25928 18203 22425 19514 16992 22125
Sales Mkt Cap Sales Mkt Cap
58493 63088 3618 4157
Source:
ThomsonReuters Datastream
After a more detailed look at the data, it emerges major
differences of company profile between stock exchanges.
First of all, the analysis of the average size brings to
light that places like Paris, Frankfurt, Milan, Zurich or Tokyo mainly attract
very large multinationals (i.e. most of these companies belong to their
national reference index), whereas London and New York have a broader scope by
attracting more medium-sized companies as well as emerging countries companies.
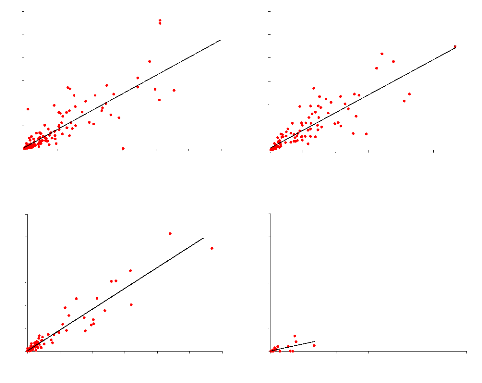
This point is reinforced by the analysis of the dot distribution in the four
point clouds in exhibits #24.
Furthermore, it is worth to notice the major difference of
size and sales between the two main American stock exchanges, since foreign
cross-listed companies on the Nasdaq are on average far away smaller than those
on the Nyse. This may be explained by the different roles played by each stock
exchange: the Nyse is mainly targeted by multinational companies, well
established and operating in traditional activities, whereas the Nasdaq
welcomes more fast growing companies (see exhibit #25).
#24: Correlation between Net Incomes 2007 and Market
Capitalisations (mUS$)
Net Incomes 07 Net Incomes 07
R2 = 0.7612
Market Cap.
0 50000 100000 150000 200000 250000 300000
Nyse
Net Incomes 07
0 50000 100000 150000 200000 250000 300000
Europe*
Net Incomes 07
0 50000 100000 150000 200000 250000 300000
L.S.E
0 50000 100000 150000 200000 250000 300000
Nasdaq
30000
25000
30000
R2 = 0.7475
Market Cap.
25000
20000
15000
10000
5000
0
R2 = 0.9052
Market Cap.
30000
25000
20000
15000
10000
5000
0
30000
25000
20000
15000
10000
R2 = 0.464
Market Cap.
5000
0
20000
15000
10000
5000
0
Source: ThomsonReuters Datastream R2 is the
correlation in linear regression
Most striking, is the strong correlation between the net
incomes 2007 and market capitalisations for companies foreign cross-listed on
the L.S.E, on the Nyse and in Europe, with respectively R2 of 0.91,
0.76 and 0.75. A contrario, foreign crosslisted companies on the Nasdaq
generally offer a weak correlation with R2 dropping to 0.46. This
confirms the presence on the latter of smaller and fast-growing companies.
However, there is no proven correlation between the Price
Earnings Ratio (P/E) and the sales growth CAGR (Compound Annual Growth Rate)
for the period 2004- 2007 (see appendix 1).
* Europe includes main European markets for Foreign
cross-listing, i.e. France, Germany, Switzerland and Italy
#25: Sales Growth CAGR during the period 2004-2007
Euro Zone U.K Canada U.S
Origin Place
Foreign Listing Place
Japan Emerging
Countries

|
|
|
Average
|
|
|
Nyse
|
+9.3%
|
+6.3%
|
+24.4%
|
-
|
+10.5%
|
+30.8%
|
Nasdaq
|
+19.7%
|
+10.8%
|
+33.9%
|
|
-+1.9%
|
+14.6%
|
L.S.E
|
+10.9%
|
-
|
+38.7%
|
+7.1%
|
+7.1%
|
+17.7%
|
Euronext Paris
|
+4.6%
|
+9.1%
|
n.a
|
+8.3%
|
n.a
|
+33.0%
|
|
n.a: no enough data available Source: ThomsonReuters
Datastream
Note:
As regards Canadian foreign cross-listed companies, the
figures mostly concerns companies operating in the sector of Mining and Oil
& Gas; that explains the impressive double digit sales growth over the last
few years.
II.3.d. Cultural Similarities
The overall results bring to light the strong influence of
cultural similarities in the choice of the cross-listing place. Indeed,
companies performing foreign cross- listings are particularly inclined to list
in countries culturally similar to their origin country. We may note the
influence of elements such as a common language, a common culture, a common
history, and so on. Such statement has already been evoked by the work of M.
Pagano, A. Rbell and J. Zechner34, and a precise look at the results
of the exhibits #15 and #16 in part 11.2. Presentation of the Results
corroborates such idea.
First of all, a striking figure is the weight of foreign
cross-listings performed between Anglo-Saxons35, which represents
35.6% of all 1,347 foreign cross- listings. Another example is the
attractiveness of Euronext Paris for Belgian companies; Euronext Paris
gathering 53% of all the 17 Belgian foreign cross- listings. On the other side,
French and Luxembourgian companies represent 62%
34 M. Pagano, A. Rdell, and J. Zechner, 1999, "The
Geography of Equity Listing: Why Do European Companies List Abroad?"
35 United States, Canada, United Kingdom, Ireland,
Australia, New Zealand and South Africa
of all foreign cross-listings on Euronext Brussels. Although
many Latin American companies (77 over 116, i.e. 66.4%) chose an American stock
exchange as secondary listing place, many (25%) also chose the Spanish stock
exchange BME.
The notion of common history has also to be taken into
consideration. The most convincing examples are the foreign cross-listings of
companies from emerging countries. For instance, Euronext Paris has managed to
attract companies originating from the former French Colonial Empire (three
Moroccan and one Gabonese companies), while the L.S.E has numerous companies
from the former- British Empire (22 Indian companies, 12 South African, 7
Egyptian, 3 Zimbabwean, 2 Nigerian, 1 Kenyan, 1 Jordanian and 6 from the
UAE).
One of the most relevant examples is the case of the
insurance company Old Mutual with shares listed in London, Johannesburg,
Malawi, Namibia and Zimbabwe. Originally founded in South Africa with
subsidiaries in the whole south part of Africa, the group is henceforth based
in London.
Beyond any geographical reasons, the culture appears to be
important in the choice of the second listing place. It may be explained by the
fact that American investors should have more ease to understand English
companies than French ones in terms of corporate governance, accounting data,
and so on. Moreover, the American and the Canadian markets, as well as the
Australian and the New Zealander ones, are very linked.
In addition to cultural similarities, the exhibits #15 and
#16 illustrate the strong economical relations between countries. In this
perspective, Japanese, Israeli, Chinese and Canadian companies tend to
cross-list in the United States instead of in Europe; European companies tend
to foreign cross-list inside Europe; African companies in Europe; New Zealander
companies in Australia.
11.4. Going Further in the Empirical 1nterpretation
Ideally, it would have been interesting to have historical
data for the number and geographical distribution of foreign cross-listings, in
order to analyze the trends over a long period of time and to notice which
countries have gain in attractiveness and vice versa.
The present data are only a "photograph" at a specific moment of
the foreign cross-listing phenomenon.
III. Environment and Current Evolutions
III.1. Decreasing Advantages and Increasing Concerns ?
During the 1980s-1990s, but also to a lesser extent during
the 1970s, foreign cross-listing had been an important phenomenon, helped by
the internationalisation of companies and the liberalisation of financial
markets. Such operations had been performed by numerous of companies with the
objective to access to the main financial places. This was particularly the
cases of many major French and European companies, which had increasingly
listed abroad, and more especially in the United States.
First of all, the main impediment regarding a foreign
cross-listing results from its cost. We may point up two types of cost: direct
and indirect. Direct costs correspond to expenses that prepare the listing
operation (mainly listing charges and fees for advisors), whereas indirect
costs include commitments for the company to abide by the local laws.
Nowadays, most of costs regarding a foreign cross-listing
stem from the obligation to comply with the different accounting norms (e.g. US
GAAP, IFRS). For instance, the costs of keeping an ADR compliant with the S.E.0
regulation have become increasingly annoying and demotivating, even for the
biggest European companies. This non-negligible element may thus become a
"financial border" between small and large companies, these last ones being the
only ones that could afford such expenses.
In part II.3.c. Size and Growth, we tried to verify and to
confirm this element by analyzing the main characteristics of foreign
cross-listed companies (e.g. market capitalisation, sales, presence in main
national/international index, and so on).
Secondly, one of the main reasons for a foreign
cross-delisting is the low level of daily traded shares. This point may be
illustrated by the decision of Air France-KLM in January 2008 to apply for a
complete cross-delisting of its ordinary shares and ADRs from the Nyse. Reasons
given by Air France-KLM's management regarding this decision are the
following:
"The rationale for delisting and deregistration is principally
based on the fact that
Air France-KLM is primarily listed on Euronext Paris,
which is now part of NYSE-
Euronext, where the average trading volume accounted for more
than 95% of trading over the last twelve months, making the additional costs
and expenses associated with dual registration not cost-justified. Air
France-KLM remains committed to developing its contacts with American
investors, who represent an important part of the Group's shareholding
structure." 36
Thirdly, there are also risks of regulation modification in
the countries where the company is cross-listed. One of the most relevant
examples is the enactment (2002) of the Public Company Accounting Reform and
Investor Protection Act (also known as the Sarbanes-Oxley Act or SOX) which has
initiated the withdrawal from the quotation in the United States of numerous
European companies. These companies were discouraged by the new penalizing
rules and had to perform a double accounting (US GAAP and IFRS norms) which is
quite consuming in financial and in human resources.
Moreover, it is important to notice that the Sarbanes-Oxley
Act has introduced a new juridical risk for the companies' managements which
may lead to a 20-years jail sentence. P. Hostak, E. Karaoglu, T. Lys and Y.
Yang37 noticed that "the passage of the Sarbanes-Oxley Act (SOX)
coincided with an increase in voluntary delistings of foreign firms traded as
American Depository Receipts (ADRs) from US stock exchanges. [...] these
delistings were motivated by firms' costs of complying with SOX or by managers'
or controlling shareholders' (MCOs) loss of control rents that resulted from
corporate governance mandates of SOX."
In addition, we may consider legal risks related to
regulators and to class actions from shareholders in countries where the
company is cross-listed. This was the case of Siemens in 2008 which because of
its listing on the Nyse had to paid a $800m fine to settle a probe by U.S.
Justice Department following the offense of the Foreign Corrupt Practices Act
about corruption, but also EADS, Societe Generale and Vivendi which had been
suited by class actions in the United States. Translation from French: "In the
case of an ADR [...] the question has to be considered for companies organizing
presentations for potential investors in the United States; a particular
precaution is important concerning earnings forecasts which may lead to
posterior appeals if the company is unable to reach its guidance and if the
stock falls significantly. In order to reduce European companies' commitments
in terms of financial information, a harmonisation between American
36 Source: Air France-KLM, the 18th January 2008
37 P. Hostak,, E. Karaoglu, T. Lys and Y. Yang, 2007,
"An Examination of the Impact of the SarbanesOxley Act on the Attractiveness of
US Capital Markets for Foreign Firms"
(US GAAP) and international (IFRS) norms appears to be the best
solution in midterm."38
Finally, it is also worth to notice that being cross-listed in
different countries considerably complicates procedures related to mergers and
acquisitions.
Obviously, foreign cross-listing provides undeniable
benefits, but in some cases these benefits may appear to be weak regarding the
drawbacks previously listed. This point could be verified by surveying managers
about the costs and benefits of foreign cross-listing. In this perspective, F.
Bancel and C. Mittoo performed a survey in 2001 and came to the conclusion that
despite "a majority of managers (60%) perceive that benefits outweigh the costs
of foreign listing, about 30% also view the net benefits to be negative.
Perceived net benefits are positively related to the increase in the total
trading volume after foreign listing, the financial disclosure levels of the
firm, and the dual listing on both the US and European foreign exchanges.
Without the influence of these factors, the perceived net benefits are
negative"39. However, it is essential to pay attention to the
study's date of publication: 2001. Since this publication, we have now to take
into consideration that financial markets have evolved and some conclusions,
true in 2001, may have become no more topical. However, this study still gives
us a good overview of what feelings managers have for foreign
cross-listings.
111.2. A Major Tendency Has Emerged
Conversely to the globalisation of the financial markets, the
last few years have seen emerging an important wave of foreign
cross-delistings. Over the years, benefits of maintaining a foreign quotation
have declined, so much so that foreign cross-listings have sometimes begun to
appear as a constraint. Nowadays, foreign cross-delistings seem particularly to
concern European companies cross-listed in the United States, consequence of
the American financial markets loss of attractiveness but also the appearance
of more demanding requirements in terms of communication, accounting
publications and legal requirements. As we previously noticed in part 111.1.
Decreasing Advantages and Increasing Concerns ?, all these commitments generate
important costs and may lead to the withdrawal
38 See Appendix 2: Article Agefi 28/05/2008, "Les
procédures judiciaires américaines visent aussi les
sociétés cotées à Paris"
39 F. Bancel and C. Mittoo, June 2001, "European
Financial Management"
from the United States with annual savings estimated to
€7m per year. Considering the cost of a delisting from the United States
(est. of €3m) or France (est. of €2m), a cross-delisting is rapidly
amortized. By this way, companies accept to take the risk to become less
visible for analysts, investors, clients and suppliers.
Moreover, institutional investors are now used to buying and
to selling directly their shares on the most liquid place, which is most of
time the company's market place of incorporation. This point is analyzed in
part IV.3.b. Current Tendency: the "Fading Listing".
Nowadays, a cross-delisting mainly results from the following
events:
4 M&A operations (e.g. acquisition/takeover)
4 Management's decision (e.g. liquidity/cost/efficiencies
issues)
4 Radiation of shares by authorities
#26: Cases of Recent Cross-Delistings
Company
|
Country
|
Dates
|
Delisting from Company
|
Country
|
Dates
|
Delisting from
|
|
|
|
|
|
|
|
Volvo
|
Sweden
|
2001
|
Tokyo SE
|
Akzo Nobel
|
Netherlands
|
2007
|
Nasdaq
|
|
|
2003
|
Euronext Brussels
|
Telenor
|
Norway
|
2007
|
Nasdaq
|
|
|
2003
|
Frankfurt
|
Arcadis N.V.
|
Netherlands
|
2007
|
Nasdaq
|
|
|
2004
|
L.S.E
|
Scor
|
France
|
2007
|
Nyse
|
|
|
2007
|
Nasdaq
|
Swisscom
|
Switzerland
|
2007
|
Nyse
|
LVMH
|
France
|
2002
|
Nasdaq Adecco
|
Switzerland
|
2007
|
Nyse
|
|
|
2003
|
Euronext Brussels
|
BG Group Plc
|
U.K
|
2007
|
Nyse
|
Nokia
|
Finland
|
2003
|
L.S.E
|
Bayer
|
Germany
|
2007
|
Nyse
|
|
|
2004
|
Euronext Paris
|
|
|
2008
|
Tokyo SE
|
|
|
2007
|
OMX Stockholm
|
Boeing
|
U.S
|
2008
|
Tokyo SE
|
Lafarge
|
France
|
2004
|
L.S.E Ducati Motor
|
Italy
|
2008
|
Nyse
|
|
|
2004
|
Frankfurt
|
Societe Generale
|
France
|
2008
|
Tokyo SE
|
|
|
2007
|
Nyse Dassault Syst.
|
France
|
2008
|
Nasdaq
|
Bombardier
|
Canada
|
2004
|
Euronext Brussels
|
Altria Group
|
U.S
|
2008
|
Euronext Paris
|
|
|
2005
|
Frankfurt
|
Telefonica
|
Spain
|
2008
|
Euronext Paris
|
ABB
|
Switzerland
|
2005
|
L.S.E
|
|
2008
|
Frankfurt
|
|
|
2005
|
Frankfurt
|
BP Plc
|
U.K
|
2008
|
Nyse Arca & Chicago
|
Euro Disney
|
France
|
2005
|
L.S.E
|
|
|
2008
|
Toronto SX
|
|
|
2005
|
Euronext Brussels
|
|
|
2008
|
Tokyo SE
|
K Line
|
Japan
|
2005
|
Euronext Brussels
|
|
|
2009
|
Swiss SX
|
|
|
2005
|
Frankfurt Boeing
|
U.S
|
2008
|
Tokyo SE
|
Vivendi
|
France
|
2006
|
Nyse
|
Bosch
|
Germany
|
2008
|
Tokyo SE
|
Pioneer
|
Japan
|
2006
|
Nyse Barclays Plc
|
U.K
|
2008
|
Tokyo SE
|
|
|
2006
|
Euronext Amsterdam
|
KPN
|
Netherlands
|
2008
|
Nyse
|
|
|
2006
|
Osaka SE
|
|
|
2008
|
L.S.E
|
Ahold
|
Netherlands
|
2007
|
Nyse
|
|
|
2008
|
Frankfurt
|
BASF
|
Germany
|
2007
|
Nyse Ericsson
|
Sweden
|
2008
|
L.S.E
|
Fiat
|
Italy
|
2007
|
Nyse
|
AnheuserBush*
|
U.S
|
2008
|
L.S.E
|
E.ON
|
Germany
|
2007
|
Nyse Alcatel-Lucent
|
France
|
2008
|
Tokyo SE
|
Technip
|
France
|
2007
|
Nyse
|
ING Groep
|
Netherlands
|
2009
|
Euronext Paris
|
Danone
|
France
|
2007
|
Nyse
|
|
|
2009
|
Frankfurt
|
British Airways
|
U.K
|
2007
|
Nyse
|
|
|
2009
|
Zurich
|
Suez
|
France
|
2007
|
Nyse BNP Paribas
|
France
|
2009
|
Tokyo SE
|
|
* Anheuser-Busch has announced its willingness to delist
from the L.S.E on April 2008, whereas the takeover bid by InBev has been
announced in July 2008
Here are some cross-delisting reasons given by companies'
managements:
Lafarge, delisting from the L.S.E and Frankfurt (2004) and from
the Nyse (2007)40:
4 Lafarge notes recent changes, in particular the merger of the
New York Stock Exchange and Euronext.
4 Lafarge is listed on Euronext, where the average trading
volume has accounted for close to 99 % of trading in its securities.
4 Lafarge trading volumes on the L.S.E, Frankfurt and Nyse
through ADR, has remained at a low threshold since 2002, accounting
respectively for around 1.4%, 0.2% and 1% of total traded shares.
Ahold, delisting from the Nyse (2007)30:
4 Improve cost-effectiveness by reducing complexity.
4 The majority of Ahold shares held by U.S.-domiciled investors
are acquired through Euronext Amsterdam.
4 The average daily trading volume in the United States over the
last twelve months has been less than five percent of the total worldwide
volume.
Societe Generale, delisting from the Tokyo Stock Exchange
(end-2008)30:
4 Weakness of volumes traded.
4 The impact for Japanese investors will be limited since they
are used to buyin Societe Generale shares on Euronext Paris.
ING, delisting from Euronext Paris, Frankfurt and Zurich
(2009)30:
4 The low volume of shares traded on the aforementioned
exchanges. In the twelve months up to 1 November 2008, trading on the
Frankfurt, Paris and Swiss exchanges amounted to a combined 0.3% of the total
daily trading volume in ING shares. This share of volume has steadily been
diminishing over the last years.
4 Technological and regulatory developments now give
investors ample opportunity to trade shares on exchanges outside their country
of residence. This reason for having a broad range of listings is now no longer
relevant.
4 Maintaining a listing brings costs with it. Concentrating
trading on a limited number of exchanges aligns with ING's ongoing focus on
cost efficiency.
After analysis of the exhibit #26, it is essential to notice
that the cross-delisting
phenomenon impacts all main stock exchanges in the
MEDC countries. This
40 Source: Companies, see announcements on company's
website
phenomenon is verified at the European Union scale, at the
European scale, at the European-American scale, at the
Japanese-European-American scale.
For few years, one of the most striking tendencies is the
withdrawal of European companies from American stock exchanges; tendency which
has been spectacularly increasing these last years and reached its paroxysm in
2007. According to a study41 of the Committee on Capital Markets
Regulation (CCMR), "from 1997 to 2006, the foreign delisting rate from the NYSE
averaged 5.3%. When in 2007 the rate spiked to 15.1% (representing delistings
by 68 foreign companies)". The CCMR has analyzed the "nationality and market
valuations of the delisting companies and found that delisting companies were
overwhelmingly from Western Europe. Of the 53 companies that delisted not due
to an acquisition, 43 were from Western Europe (8 each from the UK and France
and 7 from Germany) and 4 were from Australia. Only 5 of the 53 delisting
companies were from emerging market countries Chile (1), Brazil (1), Hong
Kong/China (2) and Israel
(1)."
Furthermore, we may now admit that this tendency is not
linked to the market downturn resulting from the Subprimes Crisis (which began
in July 2007 and reached its highs in September 2008 with the Lehman Brothers'
fall), since numerous of cross-delistings were performed during the bullish
period 2006- Mid2007. Afterwards, most of cross-delisted companies continue to
be present in the United States capital markets through an over-the-counter
listing (OTC).
"Some years ago Akzo Nobel was a front runner in the process
of simplifying its European listings on stock exchanges. With today's global
capital markets functioning well, and in light of changed U.S. legislation
regarding delisting, we now want to finalize this process, which will result in
a single listing in Amsterdam. With a simplified structure in place we expect
to generate cost savings of around EUR 7 million per annum", R. Frohn, Akzo
Nobel's CFO said42.
Furthermore, another striking materialisation of this
phenomenon is the decrease of foreign listings on the Tokyo Stock Exchange
(TSE). Between 1991 and 1998, foreign cross-listings had tumbled from 127 to
25, consequence of falling volumes since Japan's asset bubble burst in early
1990s, but also of the international capital markets deregulation which has
made easier for investors to trade shares outside their home exchange.
41
Committee on Capital Markets Regulation (CCMR,
http://www.capmktsreg.org),
2007, "Non-U.S. Company Delisting from Nyse soared in 2007"
42
Source company
III.3. A New Deal in the Stock Exchanges Industry
III.3.a. Mergers between Stock Exchanges
Few years ago began an important movement of concentration
between stock exchanges operators, giving birth to leaders with activities in
several countries or continents. The most representative example was the merger
between the American Nyse and the European Euronext, forming the world leading
stock exchange in terms of market capitalisation, volumes and number of listed
companies. At the same time, were performed several other major operations such
as L.S.E-Borsa Italiana, Deutsche Biirse-SWX and NASDAQ-OMX.
One of the main purposes of these operations was to create ?a
truly global marketplace with great breadth of product and geographic reach
that will benefit all investors, issuers, and our shareholders and
stakeholders"43. As the competition between stock exchanges has
steadily increased, mergers allow to reduce costs, to optimize resources and to
boost client numbers. For instance, rapidly after the merger L.S.E-Borsa
Italiana which saw the English operator taking the control of the Italian one,
360 of the main Italian stocks joined the L.S.E's trading platform TradElect,
therefore creating the biggest pool of liquidity in Europe.
And which could be the next step ? By going further in this
perspective, why not proposing to clients a 24h-continuous trading with
companies listed on three market places, e.g. Tokyo Stock Exchange, Euronext
Paris and Nyse ?
New moves had been performed with the purchase by Nyse of a
5% stake in the capital of the Indian National Stock Exchange (2007), but also
a 20% stake in the Qatar Exchange (2009).
As a consequence of these merger and acquisition operations,
the AmericanScandinavian group Nasdaq-OMX has announced it will introduce a new
plan in order to simplify and to promote multiple listings on its different
stock exchanges (Nasdaq, OMX Stockholm, OMX Copenhagen, OMX Helsinki, OMX
Iceland, Tallinn Stock Exchange, Riga Stock Exchange, Vilnius Stock Exchange,
Armenian Stock Exchange). At the same time, the group plans to launch a new
platform in London with the goal to compete against the L.S.E.
43 John Thain, CEO of Nyse Euronext at the moment of
the declaration
III.3.b. Strategic Partnerships between Stock
Exchanges
Following the concentration movement described previously,
stock exchanges are also signing partnerships in order to facilitate
collaborations in various domains like the trading, the listings, the services
and the technology. Recently, Nyse Euronext and the Tokyo Stock Exchange have
entered into "strategic alliance"44, paving the way for an eventual
merger. Nyse Euronext has also made some moves towards the Doha Securities
Market and other stock exchanges in the Philippines and in Malaysia. Meanwhile,
Deutsche Biirse signed agreements with the Korean Stock Exchange (2007) and the
Chinese Tianjin Exchange (2007).
After two partnerships with the Nasdaq and the L.S.E during
the year 2007, the Tel-Aviv Stock Exchange (TASE) signed in 2008 an equivalent
partnership with Place de Paris. The main goal was to "promote foreign
cross-listing which would facilitate the intervention of foreign investor on
each place. Up to now, about 60 had chosen to be dual-listed on TASE and
abroad"45. By signing partnerships with the main stock exchanges,
the TASE aims at attracting companies through a foreign cross-listing in
Tel-Aviv. In this perspective, agreements between authorities of both countries
have been signed in order to facilitate the regulation recognition of both
countries.
III.3.c. New Actors Are Arriving...
Regarding the stock exchanges industry, tomorrow's key issues
are represented by new alternative trading platforms (also known as
"darkpools") such as Turquoise, Chi-X and Bats Trading.
Recently, thanks to the amendment of the Markets in Financial
Instruments Directive (MiFID) and the developments of new technologies applied
to the finance, the competition between traditional and alternative trading
platforms has considerably increased. The main materialisations of this new
directive are the launches of new MTFs (Multi-Trading Facilities) as a serious
alternative to traditional stock exchanges such as the L.S.E, Deutsche Biirse
or Euronext.
One of these MTFs is the pan-European platform Turquoise,
created by 9 banks (Societe Generale, BNP Paribas, Citigroup, Goldman Sachs,
Merrill Lynch, Morgan
44
Article: NYSE Group and Tokyo Stock Exchange Enter Strategic
Alliance - Sign Letter of Intent for Mutual Cooperation and Development. Tokyo
Stock Exchange website
45
See Appendix: Article Agefi 28/05/2008, "La Bourse de Tel-Aviv
veut attirer les investisseurs français" (traduction: "The Tel-Aviv
Stock Exchange wants to attract French Investors")
Stanley, Deutsche Bank, UBS and Credit Suisse) and launched
in August 2008. At the time of its launch, the platform announced the goal to
gather 5% of European shares volumes before the end-2008 (vs. a mid-term 12%
market share) and predicted that traditional stock exchanges would pass below
the 50% market share46. Henceforth, on that platform are available
1,267 different company shares from 15 major European countries.
As regards Chi-X launched in 2007, this platform managed to
reach ahead of schedule its guidance, i.e. a gathering 15% market share in
volumes on the French CAC 40, on the German DAX 30 and on the Dutch AEX 25, and
in the meantime 20% market share in volumes on the British FTSE 100. Now,
Chi-X's management aim at expanding the activities to secondary European
countries such as Spain, Ireland, Greece and several Eastern European countries
like Slovakia. The contributions of these MTFs are principally the drop of
trading costs, but also a greater liquidity and efficiency, essential elements
for investors. Besides, according to a study of ITG Posit, "trading costs have
fallen by 43% in the United Kingdom since the development of dark pools". In
response to these new competitors, traditional operators are also developing
alternative trading facilities. Nasdaq OMX is going to launch the Nasdaq OMX
Europe, whereas the L.S.E (formerly in association with Lehman Brothers) is
going to launch Baikal47. In September 2008, Nyse Euronext launched
SmartPool for European blue chips.
Fragmentation of Exchanges in Europe (as of May 2009)
|
FTSE 100
|
DAX 30
|
CAC 40
|
AEX 25
|
SU 30
|
Average
|
Chi-X
|
18.6%
|
15.3%
|
16.5%
|
17.0%
|
6.3%
|
14.7%
|
Turquoise
|
5.7%
|
2.6%
|
3.4%
|
2.9%
|
2.9%
|
3.5%
|
Bats Trading
|
3.7%
|
3.6%
|
3.1%
|
2.9%
|
0.2%
|
2.7%
|
Traditional stock exchanges
|
71.8%
|
77.7%
|
76.3%
|
76.7%
|
90.7%
|
78.6%
|
|
Source: TAG
Concerning the foreign cross-listing, the question could be
the following: what is the relevance of keeping or doing cross-listings in
Europe, whereas anyhow the darkpools are proposing your shares to a large panel
of investors in several countries ? And how long before the creation of
alternative trading platforms at the European and North American scale, i.e.
the zone which concentrates most of foreign cross-listings ?
46 See Appendix: Article Les Echos 20/08/08. Eli
Lederman - General Director of Turquoise
47
As a consequence of the Lehman Brothers fall in September 2008,
L.S.E has announced continuing to develop the project
IV. Is the Foreign Cross-Listing Efficient ?
IV.1. Empirical Determination of the Efficiency
The current globalisation of financial markets implies a
greater mobility of capital, an easier access to the main financing markets,
the emergence of new trading facilities and a standardisation of the corporate
governances.
After the analysis over the last years of the reasons given
by companies announcing a foreign cross-delisting, it emerges that the notion
of "efficiency" is most of time associated with "significant trading
volumes".
|
#27: Recent Foreign Cross-Delistings
|
Rationales behind the delisting (sources
company)
|
Company
|
Country
|
Dates
|
Delisting from
|
Low trading
volumes
|
Costs
|
Administrative
complexity
|
Deregulation of
capital markets
|
|
|
|
|
|
|
|
|
Volvo
|
Sweden
|
2001
|
Tokyo SE
|
|
|
|
|
|
|
2003
|
Euronext Brussels
|
|
|
|
|
|
|
2003
|
Frankfurt
|
|
|
|
|
|
|
2004
|
L.S.E
|
|
|
|
|
|
|
2007
|
Nasdaq
|
|
|
|
|
LVM H
|
France
|
2002
|
Nasdaq
|
|
|
|
|
|
|
2003
|
Euronext Brussels
|
|
|
|
|
Nokia
|
Finland
|
2003
|
L.S.E
|
|
|
|
|
|
|
2004
|
Euronext Paris
|
|
|
|
|
|
|
2007
|
OMX Stockholm
|
|
|
|
|
Lafarge
|
France
|
2004
|
L.S.E
|
|
|
|
|
|
|
2004
|
Frankfurt
|
|
|
|
|
|
|
2007
|
Nyse
|
|
|
|
|
Bombardier
|
Canada
|
2004
|
Euronext Brussels
|
|
|
|
|
|
|
2005
|
Frankfurt
|
|
|
|
|
ABB
|
Switzerland
|
2005
|
L.S.E
|
|
|
|
|
|
|
2005
|
Frankfurt
|
|
|
|
|
Euro Disney
|
France
|
2005
|
L.S.E
|
|
|
|
|
|
|
2005
|
Euronext Brussels
|
|
|
|
|
K Line
|
Japan
|
2005
|
Euronext Brussels
|
|
|
|
|
|
|
2005
|
Frankfurt
|
|
|
|
|
Vivendi
|
France
|
2006
|
Nyse
|
|
|
|
|
RSA Insurance
|
U.K
|
2006
|
Nyse
|
-
|
-
|
-
|
-
|
Pioneer
|
Japan
|
2006
|
Nyse
|
|
|
|
|
|
|
2006
|
Euronext Amsterdam
|
|
|
|
|
|
|
2006
|
Osaka SE
|
|
|
|
|
Ahold
|
Netherlands
|
2007
|
Nyse
|
|
|
|
|
BASF
|
Germany
|
2007
|
Nyse
|
|
|
|
|
Fiat
|
Italy
|
2007
|
Nyse
|
|
|
|
|
E.ON
|
Germany
|
2007
|
Nyse
|
|
|
|
|
Technip
|
France
|
2007
|
Nyse
|
|
|
|
|
Danone
|
France
|
2007
|
Nyse
|
|
|
|
|
British Airways
|
U.K
|
2007
|
Nyse
|
|
|
|
|
Suez
|
France
|
2007
|
Nyse
|
|
|
|
|
Akzo Nobel
|
Netherlands
|
2007
|
Nasdaq
|
|
|
|
|
Telenor
|
Norway
|
2007
|
Nasdaq
|
|
|
|
|
Arcadis N.V.
|
Netherlands
|
2007
|
Nasdaq
|
|
|
|
|
Scor
|
France
|
2007
|
Nyse
|
|
|
|
|
Swisscom
|
Switzerland
|
2007
|
Nyse
|
|
|
|
|
Adecco
|
Switzerland
|
2007
|
Nyse
|
|
|
|
|
BG Group PLC
|
U.K
|
2007
|
Nyse
|
|
|
|
|
|
(following, on the next page)
(following of the previous page)
|
|
Rationales behind the delisting (sources
company)
|
Company
|
Country
|
Dates
|
Delisting from
|
Low trading
volumes
|
Costs
|
Administrative
complexity
|
Deregulation of
capital markets
|
|
|
|
|
|
|
|
|
Bayer
|
Germany
|
2007
|
Nyse
|
|
|
|
|
|
|
2008
|
Tokyo SE
|
|
|
|
|
Boeing
|
U.S
|
2008
|
Tokyo SE
|
|
|
|
|
Ducati Motor
|
Italy
|
2008
|
Nyse
|
|
|
|
|
Societe Generale
|
France
|
2008
|
Tokyo SE
|
|
|
|
|
Dassault Syst.
|
France
|
2008
|
Nasdaq
|
-
|
-
|
-
|
-
|
Altria Group
|
U.S
|
2008
|
Euronext Paris
|
|
|
|
|
Telefonica
|
Spain
|
2008
|
Euronext Paris
|
|
|
|
|
|
|
2008
|
Frankfurt
|
|
|
|
|
BP Plc
|
U.K
|
2008
|
Nyse Arca & Chicago
|
-
|
-
|
-
|
-
|
|
|
2008
|
Toronto SX
|
|
|
|
|
|
|
2008
|
Tokyo SE
|
|
|
|
|
|
|
2009
|
Swiss SX
|
-
|
-
|
-
|
-
|
Boeing
|
U.S
|
2008
|
Tokyo SE
|
|
|
|
|
Bosch
|
Germany
|
2008
|
Tokyo SE
|
-
|
-
|
-
|
-
|
Barclays Plc
|
U.K
|
2008
|
Tokyo SE
|
|
|
|
|
KPN
|
Netherlands
|
2008
|
Nyse
|
|
|
|
|
|
|
2008
|
L.S.E
|
|
|
|
|
|
|
2008
|
Frankfurt
|
|
|
|
|
Ericsson
|
Sweden
|
2008
|
L.S.E
|
|
|
|
|
AnheuserBush*
|
U.S
|
2008
|
L.S.E
|
|
|
|
|
Alcatel-Lucent
|
France
|
2008
|
Tokyo SE
|
|
|
|
|
ING Groep
|
Netherlands
|
2009
|
Euronext Paris
|
|
|
|
|
|
|
2009
|
Frankfurt
|
|
|
|
|
|
|
2009
|
Zurich
|
|
|
|
|
BNP Paribas
|
France
|
2009
|
Tokyo SE
|
|
|
|
|
|
85.5% 51.6% 12.9% 24.2%
* delisting announcement was made on March 2008, whereas the
takeover by InBev was announced in June 2008 Sources: Companies
The previous exhibit #27 underpins that in the very great
majority of foreign cross-delisting cases, companies' management are used to
pointing out the low trading volumes (85.5%). As regards the second most evoked
rationale, the costs (51.6%) stem from the low trading volumes since the
management highlight the weak relevance to pay such costs for insignificant
trading volumes. Managers estimate that volumes on foreign stock exchanges no
longer justify a broad range of foreign cross-listings. The findings deriving
from the previous analysis allow us to determine the operational definition of
the efficiency.
Operational definition of an efficient foreign cross-listing
In this research, we consider a foreign cross-listing as
efficient, from the moment that the volumes and the liquidity on the foreign
listing place are "significant" in comparison to those on the primary listing
place.
In this research, "significant" implies a free-float rotation
higher than 0.1% and volumes accounting for more than 5% of the total
volumes.
However a question remains without answer. Do the notions of
volume and liquidity overshadow all the advantages provided by foreign
cross-listings and enounced in part 1.3. Reasons Pleading for Foreign
Cross-Listing ? According to the companies' managements, the answer is in the
very great majority 'yes". Undeniably, nowadays it appears that some
advantages, true in the past, have become operationally negligible or no more
relevant.
As regards the reduction of volatility and transaction costs
that may provide a foreign cross-listing, the on-going evolution initiated by
new trading platforms (see part 111.3. A New Deal in the World of Stock
Exchanges 1ndustry) helps to improve all two points. Indeed, the increasing
competition between traditional and alternative trading platforms improves the
trading effectiveness, reduces the volatility by making shares accessible for a
largest panel of investors, and lowers the transaction costs. Foreign
cross-listings are not anymore the only one solution to improve these
points.
Furthermore, the idea that a foreign cross-listing allows to
access to new investors and to broaden shareholders basis remains true, but the
contrary is not necessarily true. As we have already noticed, nothing is more
mobile than the capital, which may easily and rapidly move from one financial
place to another one. Hence, by taking into consideration this fact, not being
cross-listed does not prevent companies from accessing foreign investors
because investors are more and more mobile. Nowadays, roles have been reversed,
i.e. it is not anymore the company that reaches investors, but investors that
reach the company. To some extent, this situation is more convenient.
Concerning the business motivations (visibility, notoriety,
relations with clients/suppliers) and the corporate governance motivations
(gain in media and analyst coverage, facilitate M&A operations with foreign
companies), it is quite difficult to materialize and to quantify their
advantages. But we may consider that from the companies' management point of
view, these elements are secondary considerations in the decision of the
foreign cross-listing.
Differences Between Stock Exchanges
Since we have noted that the notions of liquidity and volumes
are the most important elements in the management's decision for a foreign
cross-delisting, it may be relevant to compare the liquidity by main stock
exchanges.
#28: Rationales Behind the Delisting
Low trading Costs Administrative Deregulation
of
volumes complexity capital markets
Cases in which the
rationale is evoked
|
84.2% 42.1%
|
12.3% 21.1%
|
Sources: Companies
|
|
|
|
As stated B. Kadlec and J. McConnell48, some
financial markets like New York and London provide a better liquidity thanks to
a greater competition between actors which implies a fall of transaction costs
and an increase of the trading activity.
#29: 2007 Liquidity49 on each Stock Exchange
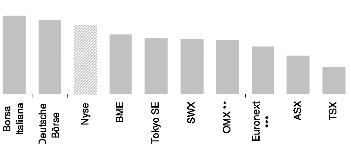
0.86% 0.82% 0.76%
0.65% 0.61% 0.60% 0.59%
0.52%
0.42%
0.30%
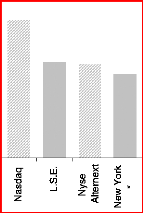
1.52%
1.06% 1.04%
0.92%
Sources: World Federation of Exchanges, ThomsonReuters
Datastream
* includes the Nyse, the Nasdaq and the Nyse
Alternext
** includes the Copenhagen, Helsinki, Iceland, Stockholm,
Tallinn, Riga and Vilnius Stock Exchanges *** includes Euronext Paris, Euronext
Amsterdam, Euronext Brussels, Euronext Lisbon
According to the exhibit #29, the Nasdaq appears to be by far
the most efficient stock exchange in terms of liquidity, followed by the L.S.E
and the Nyse Alternext. Regarding Borsa Italiana, it is important to mitigate
its figures and its honorable 0.86% by regarding the relatively "weak" total
market capitalisation of the Italian place in comparison to the Italian GDP.
48 B. Kadlec and J. McConnell, 1994, "The Effect of
Market Segmentation and Illiquidity on Asset Prices Evidence from Exchange
Listings"
49 Average Daily Turnover in US$ / Total Market
Capitalisation in US$
IV.2. Liquidity Analysis
As we noticed in the previous part, companies' managements
are used to considering a foreign cross-listing as a success from the moment
that there are sufficient volumes and liquidity. Henceforth the notion of
"efficiency" had been defined and we are going to test this point thanks to the
sample we had retrieved in the chapter II. The Geography of Foreign
Cross-Listings. For this reason, we are focusing the analysis on the market
activity of foreign cross-listed companies, in terms of volume and liquidity on
each listing place.
To materialize the notion of liquidity, we will use the
free-float rotation.
Free-float rotation formula:
6-Months Average of Daily Volumes (in shares)
Free-Float Rotation (FFR) =
% of the Free-Float x Number of shares in the Capital
|
|
#30: Free-Float Rotation of Foreign Cross-Listings Composing the
Sample
|
FFR
on the Primary
Stock Exchange
|
Average
|
0.618%
|
Median
|
0.479%
|
Nyse
|
0.624%
|
Nasdaq
|
0.363%
|
Nyse Alternext
|
0.256%
|
L.S.E
|
0.574%
|
Paris
|
0.902%
|
Frankfurt
|
0.774%
|
Swiss
|
0.619%
|
Amsterdam
|
0.644%
|
Madrid
|
0.821%
|
OMX
|
0.626%
|
Milan
|
0.816%
|
Australia
|
0.587%
|
Tokyo
|
0.879%
|
|
FFR
on the Foreign
Stock Exchange
|
Delta*
(in %)
|
Average
|
0.261%
|
57.8%
|
Median
|
0.042%
|
91.2%
|
Nyse
|
0.43053%
|
31.0%
|
Nasdaq
|
0.60798%
|
-67.4%
|
Nyse Alternext
|
0.35539%
|
-38.8%
|
L.S.E
|
0.06946%
|
87.9%
|
Paris
|
0.05549%
|
93.8%
|
Frankfurt
|
0.00795%
|
99.0%
|
Swiss
|
0.00113%
|
99.8%
|
Amsterdam
|
0.17350%
|
73.1%
|
Madrid
|
0.03515%
|
95.7%
|
OMX
|
A 1 1 /VICO/
|
0/1 A0/
|
|
urr-.-r I..,
|
Milan
|
0.06762%
|
91.7%
|
Australia
|
0.14253%
|
75.7%
|
Tokyo
|
0.00014%
|
100.0%
|
|


*Delta = (FFR on the Primary Stock Exchange - FFR on the
Foreign Stock Exchange) / FFR on the Primary Stock Exchange
Source: ThomsonReuters Datastream

Not relevant because not enough data
Note: in the exhibit #30, the column FFR on the Foreign Stock
Exchange represents the average free-float rotation of foreign companies
cross-listed on these places, whereas the other column FFR on the Primary Stock
Exchange represents the free-float rotation of the same companies on their
primary listing place.
Interpretation of the figures:
As we may notice, only foreign cross-listings in the United
States provide significant volumes in comparison to those on the primary
listing places. Most striking is the overall greater liquidity of foreign
companies foreign cross-listed on the Nasdaq (delta of -67.4%), thereby
becoming most of time the primary trading place. We may notice the same
phenomenon on Nyse Alternext with a delta reaching -38.8%.
A contrario, the liquidity of foreign shares in Tokyo remains
very poor and negligible with a delta of almost 100%. Although European
countries provide better liquidity level than in Japan for foreign shares
(L.S.E delta at 87.9%, OMX delta at 82.4%, Paris delta at 93.8%), it remains at
weak levels in comparison to those performed on the American markets.
However, according to the results we have two intermediate
cases: Amsterdam and Australia. The first one, Amsterdam, presents higher
liquidity for foreign shares thanks to the strong presence of Dutch origin
multi-national companies such as the Belgian-Dutch Fortis and Galapagos, the
French-Dutch UnibailRodamco and AirFrance-KLM, the
French-Dutch-Luxembourgian-Spanish ArcelorMittal, the Anglo-Dutch Royal Dutch
Shell, Logica, Unilever and Reed Elsevier), the Swedish-Dutch LBI
International, and so on.
As regards Australia, two factors have to be taken into
consideration. Firstly, the large presence of Anglo-Australian companies
operating in the basic resources sector. Secondly, the role hold by the
Australian Stock Exchange as the most attractive place in the Oceania region,
thus becoming the main trading market of numerous New Zealand companies.
#31: Free-Float Rotation of Cross-Listings in Europe
Extra-European Cross-Lisitngs: * Intra-European
Cross-Lisitngs: **
FFR of non-European FFR of European
companies companies
L.S.E
|
0.070%
|
0.071%
|
Paris
|
0.019%
|
0.057%
|
Frankfurt
|
0.026%
|
0.012%
|
Swiss
|
0.001%
|
0.001%
|
Madrid
|
0.002%
|
0.035%
|
Milan
|
n.a.
|
0.001%
|
OMX
|
n.a.
|
n.a.
|
|
Source: ThomsonReuters Datastream
* Intra-European Cross-Listings: European companies
performing cross-listings in Europe
** Extra-European Cross-Listings: non-European companies
performing cross-listings in Europe
A more precise look at the liquidity in Europe brings to
light that both intraEuropean and extra-European cross-listings provide poor
liquidity, reinforcing the idea of the on-going integration of European capital
markets and the fall of borders for the capital movement.
However, after analyzing a crop of important cross-border
merger operations (such as SAS, Alcatel-Lucent, Carnival, Dexia, ABB,
AstraZeneca, Nyse Euronext, G4S, STMicroelectonics, AirFrance-KLM, Reed
Elsevier, BHP Billiton, Rio Tinto, Unibail-Rodamco, Nordea Bank, Inbev,
ThomsonReuters, EADS, and so on), it emerges an average free-float rotation of
0.768%, as well as a significant delta of 59.67%. Hence, we may admit that in
case of foreign cross-listings resulting from merger operations, it generally
complies with our efficiency definition.
#32: Breakdowns of the Free-Float Rotations
On the Secondary Stock Exchange On the Primary Stock Exchange

2.6%
12.8%
81.8%
33.0%
33.4%
11.3%
4.3%
More than 2%
Between 1% - 2%
Between 0.5% - 1%
Between
0.1% - 0.5%
Between 0.01% - 0.1%
Between 0.001% - 0.01%
Below
0.001%
More than 2%
Between 1% - 2%
Between 0.5% - 1%
Between 0.1% - 0.5%
Between 0.01% - 0.1% 60.9% Between 0.001% - 0.01%
Below 0.001% 2.6%
1.8%
3.9%
10.3%
23.1%
12.1%
22.7%
26.1%
Source: ThomsonReuters Datastream
The two previous exhibits #32 illustrate and reinforce the
idea that the liquidity is generally better on the primary stock exchange;
81.8% of cases presenting FFRs at substantial level, i.e. higher than 0.1%. A
contrario, the majority of second cross-listings offer poor performances, since
60.9% of cases provide a liquidity level below 0.1%.
To conclude with this part dealing with the liquidity, it
emerges that most of foreign cross-listings are inefficient. According to a
liquidity matter, only 39.1% of cases comply with the liquidity condition in
the efficiency definition, and a closer look at the results shows that outside
the United States this number drops to 12.3%.
Finally, only specific cases of foreign cross-listings present
good results:
4 Foreign cross-listings resulting from merger operations
between companies originally listed in two different countries
4 A majority of foreign cross-listings in the United States
IV.3. Volumes Analysis
IV.3.a. Analysis of the Efficiency
Following the definition of Efficiency, we will now test the
second part dealing with the volumes.
#33: Volumes Comparison Between Primary
and Secondary Stock
Exchanges
Average share in the total volumes
Cross-listed companies Primary Foreign
Stock Exchange Stock Exchange
US companies (listed on Nyse)
(listed on Nasdaq)
British companies
99.78% 0.11%
99.02% 0.55%
73.41% 20.17%
French companies 89.68% 3.89%
German companies 96.92% 1.14%
Swiss companies 91.62% 4.52%
Australian companies
|
66.69% 33.31%
|
|
Japanese companies 96.48% 3.52%
Source: ThomsonReuters Datastream
As we may notice, the results lead to major differences between
countries.
First of all, as regards American companies the trading
activities of their foreign cross-listings appears to be very limited,
representing on average a share of 0.11% (Nyse Companies) and 0.55% (Nasdaq
companies) in the total of volumes. Although foreign cross-listings performed
by American companies represent almost 20% of all foreign cross-listings, they
provide poor efficiency. The very great majority of volumes are traded on the
Nyse and on the Nasdaq.
As regards British companies, two different kinds of cases occur
and explain such levels of foreign trading activities.
On the one hand, for several decades many British companies
have initiated cross- border mergers, paving the way to the creation of
British-based multinational companies such as AstraZeneca (British-Swedish),
BHP Billiton and Rio Tinto (British-Australian), Carnival and GlaxoSmithKline
(British-American), Eurasian Natural Resources Corp (British-Kazakh), G4S
(British-Danish), HSBC Plc (BritishChinese), Anglo American Plc, Old Mutual and
SABMiller (British-South African), Royal Dutch Shell, Reed Elsevier and
Unilever (British-Dutch), and so on. Nowadays, 20% to 50% of these groups'
volumes are traded on a secondary stock exchange, establishing an average of
20.17% whatever the foreign stock exchanges.
On the other hand, British companies are widely cross-listed
in the United States, and more especially on the Nyse. According to the exhibit
#34, cross-listings of British companies in the United States represent on
average a share of 10.6% in total trading volume.
#34: Some Cases of British Companies Volumes Breakdown
Com pany Stock % of Com pany Stock % of
Exchange Volumes* Exchange
Volumes*
Barclays
|
London 91.9% Royal Dutch Shell London 32.6%
New York 7.9% New York 8.5%
|
|
London 94.8% Rio Tinto Australian 19.8%
Nyse Alternext 5.1% New York 14.4%
BAT
Carnival
|
London 49.5%
New York 50.5%
|
|
SABMiller
|
London 73.2%
Johannesburg 26.8%
|
|
Amsterdam 58.8%
Old Mutual
|
London 71.7%
Johannesburg 28.0%
|
|
London 67.5%
Anglo American Johannesburg 26.2%
Nasdaq 6.3%
London 65.6%
London 63.3%
Reed Elsevier Amsterdam 34.8%
New York 1.8%
BHP Billiton
|
London 43.4%
Australian 33.8%
Johannesburg 8.3%
New York 14.3%
|
|
G4S
London 82.7% Shire London 59.6%
Copenhagen 17.3% Nasdaq 40.4%
HSBC New York 11.3%
Hong Kong 30.3%
London 58.3%
GlaxoSmithKline
|
London 82.0%
New York 17.8%
|
|
London 31.1%
Unilever Amsterdam 62.0%
New York 6.9%
!Source: ThomsonReuters Datastream as of November
2008 see
* Percentages calculated with the 6-months average daily
volumes
The average volumes of English and French companies traded on
the Nyse represents respectively 10.62% and 15.46% of the total volumes; 73.52%
of cases complying with the volume part of the efficiency definition.
However, the findings given in the exhibit #33, provide a
general overview by countries but also allow a limited interpretation. For
these reasons, we have analyzed the precise distribution of results; keeping in
mind that an efficient foreign cross-listing implies volumes greater than 5% of
the total volumes.
#35: Volumes Distribution Hold by Secondary Foreign-Listings
Considering All Stock Exchanges Except U.K. and Australian Stock
Exchanges
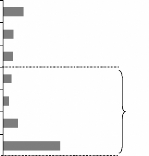
16.3%
8.4%
7.9%
6.5%
4.6%
67.5%
11.7%
44.7%
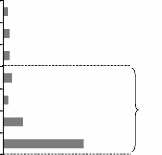
3.7%
5.0%
5.0%
6.6%
4.1%
86.3%
14.9%
60.6%
More than 20%
Between 10% - 20%
Between 5% -
10%
Between 2% - 5%
Between 1% - 2%
Between 0.1% - 1%
Below 0.1%
More th an 20%
Between 10% - 20%
Between 5% -
10%
Between 2% - 5%
Between 1% - 2%
Between 0.1% - 1%
Below 0.1%
Source: ThomsonReuters Datastream
As we noticed in the exhibit #33, foreign cross-listings
performed by British and Australian companies distinguish themselves from the
other ones. By eliminating these foreign cross-listing cases, we may have a
more precise overview of the situation in other countries (see exhibit #35).
#36: Volumes Distribution:
Focus on the Basic Resources and
Mining Sectors
Volumes
As secondary Stock
Exchange
|
|
On the Primary Stock
Exchange
|
|
|
|
|
TSX & TSX Venture
L.S.E
|
38.0%
20.8%
|
62.0%
79.2%
|
ASX
|
32.8%
|
67.2%
|
|
Cases >5% of total volumes 78.26% i.e. 90
cases
Source: ThomsonReuters Datastream
The exhibit #36 is quite interesting, since it offers a
closer look at the foreign cross-listing phenomenon in the Basic Resources and
Mining sectors. The places of Toronto, London and Sydney had been chosen due to
their important influences on these two sectors.
As we may notice, these foreign cross-listings provide very
good volumes, with figures between 20.8% and 38.0% of the total distribution.
But above all, the most striking fact is the figure of 78.26%, corresponding to
the percentage of cases meeting the volume efficiency condition.
As regards the volume analysis, the findings lead to similar
conclusions to those stated in the previous liquidity part, that is to say the
majority of foreign cross- listings are inefficient. Indeed, it emerges that
only 32.5% of cases meet the volume efficiency condition, figures falling to
13.7% without taking into consideration U.K. and Australian companies.
Nevertheless, some specific cases may provide good results. These cases are
listed below:
4 Foreign cross-listings resulting from mergers operations
between companies originally listed in two different countries
4 A majority of foreign cross-listings in the United States
4 Foreign cross-listings in a financial place specialized in the
company's sector
IV.3.b. Current Tendency: the "Fading Listing"
According to a study of the Banque de France made at the end
of December 2007, 38.5% of the companies composing the French index CAC
4050 was owned by nonresidents investors. However, the trading
activity analysis of the same crop of companies highlights the predominant
share of 96.8%51 held by Euronext Paris, clearly demonstrating that
the very great majority of investors are used to buying and to selling their
shares on the company's main trading market.
Furthermore, a more detailed look at the evolution of volume
distribution in cases of efficient foreign cross-listings reinforces this
notion of investors' preference for the most liquid trading place.
The following exhibits #38 illustrate this tendency applied
to bi-national companies, materialized by steadily diminishing volumes on the
secondary listing places during the years following the merger (see most
representative cases of ABB, AstraZeneca, InBev, SABMiller and Anglo
American).
By this way, after a certain period of time the most liquid
place overrides the other ones, leading to the marginalisation of the secondary
foreign cross-listings. Hence, an efficient foreign cross-listing in year T,
may become no longer efficient in year T+8 (e.g. see cases of Aventis, SAS,
AngloGold Ashanti and Altadis). In this research, this new notion will be
called the "Fading Listing". After a merger operation, the fading listing seems
to be verified whatever the company's origin country and the secondary stock
exchange. The average CAGR52 fading listing calculated thanks to the
examples presented in the exhibits #38 reaches -19.01%, suggesting that after a
merger operation the share in the total volumes held by the secondary listing
places losses on average -19.01% per year.
The case of the Anglo-South African SABMiller is probably the
most interesting case (see figures in exhibit #38). In 1999 the group SAB
(South African Breweries, and later renamed SABMiller after the purchase of the
U.S. based company Miller Brewing in 2002) initiated a listing on the L.S.E. At
this time, the share in volumes traded in London accounted for 32%, the rest
being traded in Johannesburg. Nine years later, the influence is reversed since
London henceforth accounts for 73% of the total volumes. During these years,
the overall greater liquidity of the British stock exchange had played the role
of catalyst by attracting
50 Are considered 36 companies belonging to the CAC
40, i.e. except those which have their head offices outside France like EADS,
ArcelorMittal, Dexia and STMicroelectronics
51
6-months average, source: ThomsonReuters Datastream
52 Compound Annual Growth Rate (CAGR), for more
details see Appendix 1
more and more investors. This example confirms the preference
of investors for the most liquid places.
However, it is important to have a closer look at the foreign
cross-listings in the United States. Indeed the exhibit #37, clearly suggests
that a foreign cross-listing in the United States is generally not impacted by
the fading listing phenomenon. As we may notice, companies resulting from
merger operations with an American company naturally have a significant share
of their trading activity performed in New York; share which is even used to
gaining in weight over the years (GlaxoSmithKline 18% in 2008 vs. 12% in 2000),
Alcatel-Lucent (32% in 2008 vs. 24% in January 2007). But such levels may also
concern companies not resulting of a merger operation such as the German
companies SAP (24% in 2008 vs. 10% in 2000) and Infineon AG (17% in 2008 vs.
5.8% in 2004), the British Diageo (22% in 2008 vs. 8% in 2000). Therefore,
after a foreign cross-listing in the United States, we may state that the
American listing gains in importance in the company's total trading
activity.
#37: Evolutions of the Share in Total Volumes of Foreign
Cross-Listings
in New York (Period 2000-2008)
|
British
Companies
|
French
Companies
|
German
Companies
|
Japanese
Companies
|
New York
Examples
|
|
|
|
|
|
+44%
|
+37%
|
+373%
|
|
32%
Alcatel-Lucent
|
24%
SAP
|
25%
Nidec
|
% max of volumes traded in New York
Company
|
|
Source: ThomsonReuters Datastream
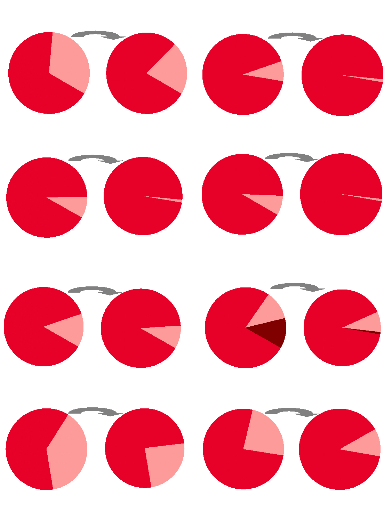
AstraZeneca
As of after the merger, i.e. 01/2000 As of 11/2008
TeliaSonera
As of after the merger, i.e. 01/2003 As of 11/2008
Source: ThomsonReuters Datastream
66
#38: Shares of Volume Evolutions
ABB
Aventis
As of 01/2000 As of 11/2008
As of after the merger, i.e. 01/1999 As of 1/2004
Nyse Euronext
Euronext
Brussels
0.04%
Amsterdam
0.03%
Brussels
0.1%
As of before the merger w ith Nyse,
i.e. 5/2007
As of after the creation of Euronext,
i.e. 08/2001
As of after the merger, i.e. 05/2007 As of 11/2008
Amsterdam
-89%
Paris
99%
Paris
8%
9%
Paris
91% Amsterdam
Amsterdam
1%
New York
92%
Paris
-88%
New York
99% Paris
1%
Stockholm
Frankfurt
-88%
-34%
Paris
92%
Zurich
79%
Frankfurt
1%
Zurich
68%
Stockholm
32%
Stockholm
21%
Frankfurt
8% Paris
99%
Unibail-Rodamco
As of after the merger, i.e. 11/2007 As of 11/2008
EADS
As of after the merger, i.e. 01/2001 As of 11/2008
Amsterdam
-31%
Frankfurt
12%
Paris
87%
Paris
90%
Paris
76%
Spain
12%
Amsterdam
13%
Paris
91% Amsterdam
9%
Frankfurt -25%
Madrid -92%
Frankfurt
9% Spain
1%
London
62%
Stockholm
38%
Stockholm
-37%
London
76%
Stockholm
24%
Stockholm
76%
Helsinki
24%
Helsinki
-54%
Stockholm
89%
Helsinki
11%
Fortis
As of after the merger, i.e. 01/1992 As of 11/2008

Amsterdam
90%
Brussels
10%
Amsterdam
-13%
Amsterdam
78%
Brussels
22%
As of 01/2002 As of 11/2008

Copenhagen
26%
Stockholm
41%
Oslo
33%
Oslo -91%
Oslo
Stockholm 3%
68%
Copenhagen
29%
Anglo American AngloGold Ashanti
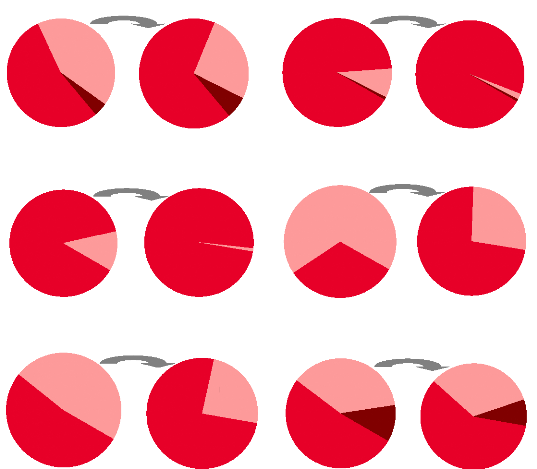
As of after the merger, i.e. 01/1 999 As of 11/2008
As of after the merger, i.e. 06/2004 As of 11/2008
Altadis
As of after the merger, i.e. 05/2000 As of 2/2008
SABMiller
As of after the IPO on L.S.E, i.e. 12/1999 As of 11/2008
Royal Dutch Shell
InBev
Paris
0.89%
Paris
0.59%
Nasdaq
4%
Johannesburg
-38%
Sydney -75%
Paris -34%
London
68%
Sydney
2%
London
54%
Johannesburg
42%
Johannesburg
26%
Johannesburg
91% Sydney
8%
Johannesburg
97%
Nasdaq
6%
Paris -94%
London
73%
London
32%
Madrid
88% Paris
12%
Madrid
99% Paris
0.7%
Johannesburg
68%
Johannesburg
-60%
Johannesburg
27%
As of after the merger, i.e. 04/2004 As of 11/2008
As of after the merger, i.e. 07/2005 As of 11/2008
Brazil
48%
Brazil -48%
Brazil
25%
London
38%
London -13%
London
33%
New York
8%
New York
11%
Belgium
75%
Belgium
52%
Amsterdam
51%
Amsterdam
59%
Source: ThomsonReuters Datastream
#39: Evolutions of the Share in Total Volumes of Foreign
Cross-Listings in
Financial Places Specialized in the Basic Resources and
Mining Sectors
(Period 2006-2008)
As Secondary Stock Share of Volume % of
Positive
Exchange Variation Variations *
|
|
|
|
|
|
|
|
|
TSX & TSX Venture L.S.E
|
|
|
+12.9%
+42.2%
|
|
|
|
38%
33%
|
|
ASX
|
|
|
+45.2%
|
|
|
|
57%
|
|
|
Source: ThomsonReuters Datastream
* Percentage of foreign cross-listing cases presenting an
increase of the weight of TSX, L.S.E or ASX in the total volumes
A first glance at the exhibit #39 would let suggest that
foreign cross-listings in specialized financial places are efficient thanks to
positive variations of the share in total volumes during the period 2006-2008.
The listing fading seems not to be verified for these cases of foreign
cross-listings, with shares in volume variation reaching +12.9% in Toronto,
+42.2% in London and +45.2% in Sydney.
However, this presumption has to be mitigated since the
tendency is not as clear as the one showed in the cases of foreign
cross-listings in the United States. Indeed, the findings are not totally
convincing, since the percentage of cases with positive variations is
relatively mixed for all three listing places, but above all a majority of
negative variations on the Toronto and the London stock exchanges. Only the
cases presenting negative shares of volumes variation suffer from the fading
listing phenomenon.
IV.4. Future of the Foreign Cross-Listing
As regards the analysis of the liquidity and the volumes, the
majority of foreign cross-listings (circa 60%) does not meet the efficiency
definition and may be considered as inefficient. Among the 40% efficient
foreign cross-listings, we may be doubtful about their durability and thus,
about their future. According to the tendency we have emphasized in part
IV.3.b. Current Tendency: the "Fading Listing", we have the confirmation of
investors preference for the most liquid trading place. This last evolution
leads to disparity between listing places, where the most liquid place
irremediably increases its share in total volumes at the expense of the
secondary listing places.
The foreign cross--listing, an "endangered specie" ?
Efficient foreign cross-listings may be depicted into 3
classes: those resulting from merger/acquisition operations, those performed in
the United States, and finally those performed in a financial place specialized
in the company's sector.
As we demonstrated in part IV.3.b. Current Tendency: the
"Fading Listing", the notion of fading listing lets us suggest that efficient
foreign cross-listings resulting from mergers/acquisition operations, but also
those performed in financial places specialized in the company's sector, do not
provide convincing findings and therefore have theoretically no future within
the current context of financial markets.
As regards the efficient foreign cross-listings belonging to
the last class, i.e. those performed in the United States, they present good
results and thus have the best likelihood to "survive". However, our part
111.2. A Major Tendency Has Emerged outlines that American stock exchanges have
strongly been impacted by a set of withdrawals performed by foreign companies;
tendency which has been spectacularly increasing during the last few years and
reached its paroxysm in 2007. This tendency mainly concerns European companies
and, according to a study53 of the Committee on Capital Markets
Regulation (CCMR), "from 1997 to 2006, the foreign delisting rate from the NYSE
averaged 5.3%. When in 2007 the rate spiked to 15.1% (representing delistings
by 68 foreign companies)". Such alarming delisting rate, should theoretically
lead to the rapid "extinction" of foreign cross-listings in the United States.
In this perspective, there remain the cases of foreign cross-listings in the
United States performed by companies originating
53
Committee on Capital Markets Regulation (CCMR,
http://www.capmktsreg.org),
2007, "Non-U.S. Company Delisting from Nyse soared in 2007"
from emerging countries; but it would not be an heresy to
announce that these cases should have the same destiny as the European ones.
However such evolution should happen in the long-term, i.e. as soon as
financial places in emerging countries would be enough developed.
By taking into consideration the previous points, within a
long-term perspective could we conclude that the foreign cross-listing should
finally completely disappear ? Obviously, the answer about the future of
foreign cross-listing is not as simple as seem to suggest our previous
assumptions. First of all, it is important to notice that before every
assumption we have made in this chapter, we have used the term "theoretically".
Indeed, we may not provide any Manichean answer nor doing any radical
announcement such as "in X years, Y% of foreign cross- listings should have
disappeared", since another factors beyond those concerning the liquidity and
the volumes have to be taken into consideration. Finally, it would be rather
difficult to povide precise figures about a tendency which will spread over
several years.
Furthermore, some elements are pleading for the
sustainability of foreign cross- listing in the long-term.
First of all, merger/acquisition deals will ever exist. For
many decades, the number of this type of operation has strongly surged, leading
to the creation of multinational companies with multi foreign cross-listings.
As long as merger/acquisition operations between companies will exist, there
will be foreign cross-listings.
Secondly, we have to take into consideration the political
matters we have named "national sensibility" or simply "economic patriotism"
(see part I.3.b. Corporate Governance Motivations). Nowadays, we could say that
this point is another main obstacle to the complete "extinction" of foreign
cross-listings. As we state in the analysis of ArcelorMittal (see following
part IV.5. ArcelorMittal's Case Study), it is inconceivable that this company
leave the Belgian, the Luxembourgian or the Spanish stock exchanges, even if
there are no financial rationales behind such poor traded volumes.
However, may be the on-going revolutions in the stock
exchanges industry (see part III.3. A New Deal in the Stock Exchanges Industry)
and the development of new technologies applied to the finance will have the
last word. Finally, the only one event which could lead to the definitive end
to foreign cross-listings would be the creation of a unique worldwide stock
exchange. But it is currently impossible to predict that such situation would
ever happen.
IV.5. ArcelorMittal Case Study
Nowadays, ArcelorMittal is cross-listed on 5 European stock
exchanges, but also in the United States through ADR:
4 Euronext Amsterdam
4 Euronext Brussels
4 Euronext Paris
4 Bourse de Luxembour
4 BME Madrid
4 Nyse
According to ArcelorMittal, the multiple foreign cross-listings
allow the company
4 To have an access to the capital markets
4 To benefit from an more attractive financial profile towards
investors
4 To benefit from better liquidity for its shares
ArcelorMittal's five foreign cross-listings are the result of
successive merger and acquisition operations:
Initially, Mittal Steel was a Dutch company listed on
Euronext Amsterdam and on the Nyse, whereas Arcelor was an European company
with headquarters in Luxembourg. Arcelor's multi cross-listings were the result
of a previous merger (2002) between Usinor (listed on Euronext Paris), Arbed
(listed on Bourse de Luxembourg and on Euronext Brussels) and Aceralia (listed
on BME Madrid).
Following the Mittal's successful takeover bid on Arcelor in
2006, the newly formed group ArcelorMittal had required the admission of its
ordinary shares on Mittal's former listing places: Euronext Amsterdam and
Nyse.
Nowadays, in terms of traded volumes for the ArcelorMittal's
shares, Paris, Amsterdam and New York are the most important places,
respectively representing during the last 6-months 40.29%, 30.08% and
29.22%54 of the total volumes.
Volumes traded on Brussels, Luxembourg and Madrid are very
limited; each one gathering below 0.5% of the total volumes.
54
Sources: ThomsonReuters Datastream

#40: Distribution of the 6-Months Average Daily Volumes
Nyse
29.22%
Amsterdam
30.08%
Paris
40.29%
Madrid,
Brussels,
Luxembourg
below 0.5%
Source: ThomsonReuters Datastream, as of 28/10/2008
#41: Evolutions of the 6-months Average Volume
Distribution
between each Listing Places

23.48%
|
|
22.15%
|
36.58%
|
|
39.92%
|
38.88%
|
|
36.98%
|
April 2007 Oct. 2007
|
|
0.48%
|
|
0.28%
|
24.63%
|
|
33.48%
|
|
41.36%
|
|
|
April 2008 Oct. 2008

Jan. 2007
80%
60%
40%
20%
0%
35.27%
40.31%
21.45%
100%
2.87%
1.02%
0.92%
Paris Amsterdam Nyse Brussels Madrid Luxembourg


Source: ThomsonReuters Datastream as of 28/10/2008
Note: Brussels and Luxembourg accounts respectively for
0.12% and 0.0023% of the total volumes in October 2008.
#42: Free Float-Rotation and Variations of Share in the total
Volumes
between each Listing Places (Period 01/2007-10/2008)
|
Free-Float Rotation Variation of Volumes
Share
|
Amsterdam
|
0.47% -25.4%
|
|
Paris
|
0.63% +87.8%
|
|
Brussels
|
0.00%
|
+250.3%
|
|
Madrid
|
0.01%
|
-90.3%
|
|
Luxembourg
|
0.00%
|
-96.6%
|
|
New York
|
0.42%
|
-17.1%
|
|
|
Source: ThomsonReuters Datastream as of 28/10/2008
Since the merger of 2006, it is worth to notice the growing
weight hold by Paris in the total volumes at the expense of the other places,
more especially Euronext Amsterdam, the Nyse and BME Madrid (N.B: regarding its
negligible weight of 0.12% in the total volumes, we do not consider Euronext
Brussels and its +250.3%). This example illustrates the tendency enounced in
part IV.3.b. Current Tendency: the "Fading Listing", i.e. over the years more
and more investors tend to buy and to sell their shares on the most liquid
place.
#43: Breakdown of Institutional Investors in ArcelorMittal
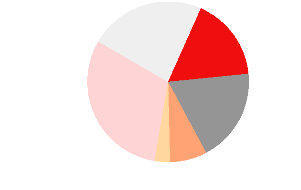
U.K
23%
France
17%
North America
31%
Rest of Europe
19%
Belgium : 0.4% Spain : 0.2% Luxembourg : 0.1%
Rest of the World
3%
Netherlands
7%
Source: Thomson Financial
The liquidity attracting the liquidity, that is why the great
majority of investors prefer to trade the shares of a company on the main
trading market, which are, in the case of ArcelorMittal Paris and Amsterdam.
Since the merger between Nyse Group and Euronext (Paris, Amsterdam, Brussels
and Luxembourg) has probably facilitated the investments of American investors
directly on Euronext Paris.
According to the definition of an efficient foreign
cross-listing given in part IV.1. Empirical Determination of the Efficiency,
only three listing places present volumes above 5%: Paris, Amsterdam and New
York. Hence, there are no financial rationales of keeping the cross-listings in
Madrid, Brussels and Luxembourg, but the relevance concerning a complete
cross-delisting from these three last places is apparently not a topical
subject. Indeed as we stated in part I.3.b. Corporate Governance Motivations,
we have to take into consideration factors of "national sensibility" since the
company is the result of mergers of several national entities from Netherlands,
France, Spain, Luxembourg and Belgium. Hence, such delisting operations would
not be unfeasible in the future, but would be complicated by the fact of taking
into consideration the realpolitik, i.e. the governments' requirements.
Finally, even if the volumes in Amsterdam and in New York
continue to decrease, their figures are quite significant to remain above 5% in
a mid-term perspective. The question of delisting from these places is not
topical, but could become in the future if the tendency is confirmed.
#44: 25-Days Volatility of ArcelorMittal on its Different
Listing Places
2.0 1.8 1.6 1.4 1.2 1.0 0.8 0.6
|
|
|
|
0.4
0.2
|
|
|
|
Jan-07 Mar-07 May-07 Jul-07 Sep-07 Nov-07 Jan-08 Mar-08 May-08
Jul-08 Sep-08 Nov-08 Brussels Madrid Luxembourg New York Amsterdam Paris
Source: ThomsonReuters Datastream as of 28/10/2008
V. Conclusion
As we have noticed in this research, the phenomenon related
to the foreign cross- listing has so far concerned a heterogeneous range of
companies. Did the smallest cross-listed company the German company Paion (2007
sales of $7.5m) and the biggest one the American major ExxonMobile (2007 sales
of $403bn) have the same purposes when they decided to perform such operation ?
The answer is probably negative.
Therefore, foreign cross-listing's rationales may be depicted
into three main classes of motivations: business, corporate governance and
financial. Generally, the decision to initiate a foreign cross-listing results
from a combination of motivations belonging to the three classes. But we may
admit one undisputable characteristic that has always qualified foreign
cross-listed companies: their international presence. In this perspective, the
rationale behind the foreign cross- listing is often to serve the company's
international development.
However, at first sight it seems not so easy to draw a
precise conclusion about the future of the foreign cross-listing since we may
not provide any Manichean answer. Indeed, this research has highlighted that
different major tendencies are currently occurring and impacting foreign
cross-listings.
On the one hand, the benefits of maintaining a foreign
cross-listing have declined over the years and sometimes this kind of operation
has begun to appear more as a constraint for companies. Nowadays, the main
constraints reside in the costs to comply with the different regulations rules
(accounting, communication, and so on), but also in the risks related to the
regulation/juridical frames, of which the enactment of the Sarbanes-Oxley Act
(2002) is the most probative example. On the other hand, thanks to the
internationalisation and the liberalisation of financial markets, investments
have gained in mobility and investors are now used to buying and to selling
their shares on the most liquid place, thus leading to the creation of
important discrepancies in terms of volumes and liquidity between the different
listing places. As a consequence, the past few years have seen spectacularly
increasing a foreign cross-delisting phenomenon, which had reached its paroxysm
during the year 2007. According to the analysis of the rationales given by a
large sample of companies announcing their foreign cross-delisting, it emerges
that the very great majority point out the low trading volumes (85.5% of cases)
and estimate that such volumes on foreign listing places no longer justify a
foreign cross-listing. To a lesser extent, it also appears rationales such as
the
costs (51.6% of cases, but rationale directly implied by the
low trading volumes), the administrative complexity (12.9% of cases) and the
deregulation of capital markets (24.2% of cases).
By considering that the company's management are the best
judge to return a verdict about a foreign cross-listing, we have expressed the
operational definition that should characterize an efficient foreign
cross-listing:
In this research, we consider a foreign cross-listing as
efficient, from the moment that the volumes and the liquidity on the foreign
listing place are "significant" in comparison to those on the primary listing
place.
In this research, "significant" implies a free-float rotation
higher than 0.1% and volumes accounting for more than 5% of the total
volumes.
In this research, the implementation of the statistical
efficiency analysis with a sample of 1347 cases of foreign cross-listings leads
to interesting interpretations, all highlighting that only three specific cases
of foreign cross-listing present good results in terms of liquidity and
volumes:
4 Foreign cross-listings resulting from merger operations
between companies originally listed in two different countries (e.g.
STMicroelectronics, UnibailRodamco, Royal Dutch Shell, ABB, Anglo American,
Alcatel-Lucent, Carnival, and so on)
4 Foreign cross-listings in a United States (e.g. on the
Nyse/Nasdaq and to a lesser extent on the Amex)
4 Foreign cross-listings in the financial place specialized
in the company's sector (e.g. London, Toronto, Sydney for the Mining and Oil
& Gas sectors, or the Nasdaq for the newtechs/IT/biotech sectors)
Thanks to the statistical efficiency analysis, it emerges that
circa 60% of foreign cross-listings appear to be operationally inefficient.
However, a more detailed look at the evolution of the volumes
distribution in case of efficient foreign cross-listing reinforces the notion
of investors' preference for the most liquid trading place. For instance, after
the analysis of the evolutions of a crop of merger operations, we have
developed the new notion of 'fading listing", which clearly materialises the
marginalisation of secondary foreign cross-listings. The liquidity attracting
the liquidity, the fading listing shows that after a certain period of time the
most liquid place overrides the other ones in terms of volumes and liquidity.
As a result of steadily declining volumes and liquidity, a foreign
cross-listing considered as efficient several years ago may become no longer
efficient and thus be prone to a future foreign
cross-delisting. But the analysis also shows that some notable exceptions may
occur with the foreign cross-listings in the United States.
However, it is worth to take into consideration that during
several years foreign cross-listings in the United States have been deeply
impacted by an impressive set of withdrawals performed by foreign companies,
most of time European. The main rationales behind this tendency seems to be the
loss of attractiveness of American financial markets, but also the recent
changes in the S.E.0 regulation with the enactment of the Sarbanes-Oxley
Act.
The industry of finance has always been in constant evolution.
The growing globalisation and accessibility to financial markets all around the
world makes geography less and less relevant. The on-going revolutions in the
stock exchanges industry, the new behaviors of investors, the disappearance of
restrictions for capital mobility, the development of new technologies applied
to the finance, and the simplification of companies' structures, and so on, are
some of the main reasons. In this context of financial markets, true notions
few years ago may rapidly become outdated or no longer topical. Nowadays, by
taking into consideration these different evolutions and tendencies it is not
easy to give precise figures and to draw a conclusion about the future of the
foreign cross- listing. Indeed, such topic tackles various notions related to
the finance, the efficiency, the technologies and the political environment,
and that is why there is no obvious answer. In a strict efficiency and
financial point of view, this research clearly demonstrates that foreign
cross-listings are not sustainable and would not have any future in our current
financial markets. However, such conclusion has to be mitigated by taking into
consideration the influence of the realpolitik, i.e. all political
considerations that are involved such as the economic patriotism. Moreover, we
may consider that as long as there will be at least two companies on earth, the
opportunities of merger & acquisition operation will ever exist, and thus
will result into new foreign cross-listings.
So theoretically, the foreign cross-listing should disappear
from our stock exchanges, but the facts have shown that such event should
probably not happen.
Bibliography
Books and Researches
R. Nyvltova, 2006, "The Effects of Cross-Border Listings on the
Development of Emerging Markets: the Case of Czech Republic"
Reserve Bank of Australia Bulletin, 2002, "Dual-listed
Companies"
L. Rosenthal and C. Young, 1990, "The seemingly anomalous price
behavior of Royal Dutch/Shell and Unilever N. V./PLC"
K. Froot and E. Dabora, 1999, "How are stock prices affected by
the location of trade?"
F. Bancel and C. Mittoo, 2001, "European Managerial Perceptions
of the Net Benefits of Foreign Stock Listings"
F. Bancel and C. Mittoo, June 2001, "European Financial
Management"
R. Merton,1987, "A Simple Model of Capital Market Equilibrium
with Incomplete Information"
W. Reese and M. Weinbach, 1999, "Protection of Minority
Shareholder Interests, Cross-listing in the United States, and Subsequent
Equity Offerings"
R. La Porta, F. Lopez-de-Silanes, A. Shleifer and R. Vishny,
1998, "Law and Finance, Journal of Political Economy"
R. La Porta, F. Lopez-de-Silanes, A. Shleifer and R. Vishny,
1997, "Legal Determinants of External Finance"
P. Tolmunen and S. Torstila, 2002, "Cross-Listings and M&A
Activity: Transatlantic Evidence"
Y. Amihud and H. Mendelson, 2008, "Liquidity, the Value of the
Firm, and Corporate Finance", Journal Applied Corporate Finance
J. Hamet, 2001, "La cotation des titres d'une entreprise
française sur un marché étranger et ses
conséquences pour l'actionnaire", PUF
R. Merton, 1987, "A simple Model of Capital Market Equilibrium
with Incomplete Information", Journal of Finance 72, No.3
P. Lowengrub and M. Melvin, 2006, "Before and After International
Cross-Listings: An Intraday Examination of Volume and Volatility"
R. Stulz, 1999, "Globalization of Equity Markets and the Cost of
Capital" P. Martin and H. Rey, 1999, "Financial Integration and Asset
Returns"
D. Lombardo and M. Pagano, 1999, "Law and Equity Markets: A
Simple Model"
M. Pagano, A. Rliell, and J. Zechner, 1999, "The Geography of
Equity Listing: Why Do European Companies List Abroad?"
L. Zingales, 2006, "Is the U.S. capital market losing its
competitive edge?"
P. Hostak,, E. Karaoglu, T. Lys and Y. Yang, 2007, "An
Examination of the Impact of the SarbanesOxley Act on the Attractiveness of US
Capital Markets for Foreign Firms"
A. Blass and Y. Yafeh, 1999, "Vagabond Shoes Longing to Stray:
Why Foreign Firms List in the United States"
P. Hostak,, E. Karaoglu, T. Lys and Y. Yang, 2007, "An
Examination of the Impact of the SarbanesOxley Act on the Attractiveness of US
Capital Markets for Foreign Firms"
B. Kadlec and J. McConnell, 1994, "The Effect of Market
Segmentation and Illiquidity on Asset Prices Evidence from Exchange
Listings"
Committee on Capital Markets Regulation, 2007, "Non-U.S. Company
Delisting from Nyse soared in 2007"
Other Sources
Financial Tools
4 Bloomberg
4 ThomsonReuters Datastream
4 Thomson Financial
Internet
4 World Exchanges (
http://www.world-exchanges.org)
4 Nyse: New York Stock Exchange (
http://www.nyse.com)
4 Nasdaq (
http://www.nasdaq.com)
4 Nyse Alternext, former American Stock Exchange (
http://www.amex.com)
4 TSX and TSX Venture: Toronto Stock Exchange (
http://www.tsx.com)
4 Euronext-Alternext Paris, Amsterdam, Brussels (
http://www.euronext.com)
4 L.S.E (
http://www.londonstockexchange.com)
4 Deutsche Biirse (
http://deutsche-boerse.com)
4 SWX: Swiss Stock Exchange (
http://www.swx.com)
4 OMX Nordic Exchange (
http://omxnordicexchange.com),
which includes Stockholm, Copenhagen and Helsinki.
4 Borsa Italiana (
http://www.borsaitaliana.it)
4 BME: Bolsas y Mercados Espafioles (
http://www.bolsasymercados.es)
4 ASX: Australian Stock Exchange (
http://www.asx.com.au)
4 TSE: Tokyo Stock Exchange (
http://www.tse.or.jp)
Press
4 Les Echos
4 La Tribune
4 L'Agefi
4 The Independent
Append ix 1
Beta Formula ((3)
CAGR (Compound Annual Growth Rate) Formula
|
CAGR(toitri) =
|
( V(tn) )
V(to)
|
1 / (tri - to)
- 1
|
Correlation between the Sales CAGR (2004-2008) and 2008 PIE
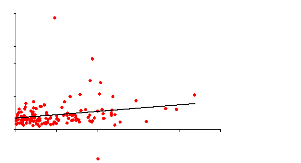
P/E 2008
R2 = 0,0631
0% 20% 40% 60% 80% 100%
Nyse
120
100
80
CAGR Sales 2004-2008
60
40
20
0
140
Source: ThomsonReuters Datastream
P/E 2008
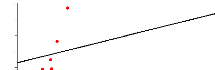
R2 = 0,0066
140
120
100
80
60

40

|
20
|
|
|
|
CAGR Sales 2004-2008
|
|
0
|
|
|
|
|
|
0% 20% 40% 60% 80% 100% 120%
Source: ThomsonReuters Datastream
Appendix 2: Articles
Source: Agefi 28/05/08 (France)
La Bourse de Tel-Aviv veut attirer les investisseurs
français
Le Tel-Aviv Stock Exchange promeut la double cotation.
Des avancées récentes facilitent l'intervention
d'investisseurs étrangers
par Violaine Le Gall
Après Londres et New York, le Tel-Aviv Stock Exchange
(Tase) vient se présenter Paris aux investisseurs français. La
Bourse israélienne affiche en effet des ambitions nouvelles à
l'international. Alors que les sociétés de l'Etat hébreu,
en particulier technologiques, ont longtemps opté pour une cotation
à l'étranger, le Tase cherche à encourager des doubles
cotations. A cet effet, il a conclu en 2007 des protocoles d'accord avec le
London Stock Exchange (LSE) et le Nasdaq. Ils visent à développer
des canaux de communication avec ces marchés et à faciliter la
négociation des actions de sociétés cotées en
Israël, et aux Etats-Unis ou au Royaume-Uni. Une soixantaine de
sociétés ont à ce jour choisi d'être cotées
au Tase et à l'étranger. Des équivalences de
réglementation facilitent en outre la double cotation. L'Israel
Securities Authority (ISA) et l'Autorité des Marchés Financiers
(AMF) ont ainsi conclu un accord en début d'année. Selon ses
termes, le prospectus d'une société, approuvé par une des
autorités, sera accepté, sous certaines conditions, par l'autre.
Pour promouvoi r son marché auprès des investisseurs
étrangers, le Tase fait valoir plusieurs arguments. D'abord, il a depuis
septembre dernier le statut de marché « développé
» octroyé par le Footsie. Du coup, les institutionnels qui ont
l'autorisation d'investir uniquement dans de telles Bourses, peuvent à
présent intervenir sur le Tase. Israël sera en outre bientôt
membre de l'OCDE.
Les sociétés cotées sont en outre en train
d'adapter leurs comptes aux normes IFRS. La Bourse de l'Etat hébreu a
par ailleurs conclu en janvier dernier un accord avec l'éditeur
informatique GL Trade. « Ceci permettra d'intégrer le Tase dans
les réseaux de GL Trade, ce qui offrira aux investisseurs
étrangers un meilleur accès à nos marchés
», explique Ester Levanon, directeur général du Tase.
Le système sera opérationnel à partir du second
semestre.
Le marché actions israélien a déjà
bénéficié ces dernières années d'une forte
croissance des investissements étrangers. Ils atteignent 4,5 milliards
de dollars depuis 2005. Le mois dernier, le volume quotidien traité
s'élevait à 612 millions de dollars sur les actions - 25 %
émanent d'investisseurs étrangers - et à 1,138 milliard
sur les produits de taux. La capitalisation du marché actions
représentait 218 milliards de dollars pour 651 sociétés
cotées.
Source: Agefi 28/05/08 (France)
Les procédures judiciaires américaines visent aussi
les sociétés cotées à Paris
La connaissance de certains principes et une communication
appropriée permettent d'amoindrir les conséquences des recours
d'actionnaires
La multiplication des poursuites intentées par des
investisseurs américains à l'encontre d'entreprises cotées
sur Euronext (Vivendi, Michelin ou plus récemment Société
Générale) a mis en lumière les enjeux importants auxquels
peuvent être confrontées celles- ci, notamment dans la
procédure d'action collective (class actions). « La
prise en compte de certaines spécificités juridiques en vigueur
outre-Atlantique constitue un moyen efficace de minimiser des risques aux
conséquences financières parfois très importantes
», souligne-t-on au cabinet Orrick Rambaud Martel qui a
organisé hier un colloque sur le sujet. Le caractère fastidieux
de la procédure a ainsi pour objectif de favoriser un accord à
l'amiable afin d'obtenir réparation du préjudice subi à
travers des dommages compensatoires et punitifs, ce dernier aspect étant
inconnu du droit français : 95 % des actions collectives
intentées depuis la loi de 1995 réformant les procédures
de litiges boursiers ont finalement été résolues avant le
procès. Ceci est d'autant plus important que le périmètre
de l'action collective atteint non seulement l'entreprise mais également
les parties liées comme les auditeurs ou les banquiers d'affaires.
Une société non cotée outre- Atlantique peut
être concernée par une action judiciaire aux Etats-Unis en cas
d'OPA, de restructuration ou de cession à des résidents
américains. Dans le cas d'une émission
d'ADR (certificats d'action), « la responsabilité
sera plus importante pour la société si elle sponsorise cette
opération, le transfert des risques se faisant vers les banquiers en cas
d'émission non-sponsorisée», précise le cabinet
d'avocat. La bonne appréhension de ces risques peut lui permettre non
seulement de mieux les gérer, mais parfois de les éviter. La
question se pose pour des sociétés qui organisent une
présentation aux Etats- Unis auprès d'investisseurs potentiels ;
une précaution particulière s'impose alors concernant les
prévisions de bénéfices, qui peuvent donner lieu à
des recours ultérieurs si la société se trouve dans
l'incapacité d'atteindre les objectifs annoncés et que le cours
de Bourse chute de façon importante. Afin d'alléger les
obligations des sociétés européennes en matière
d'information financière, une harmonisation entre les normes
américaines (US GAAP) et internationales (IFRS) apparaît bien
comme la meilleure solution à moyen terme.
Source: Les Echos 20/08/08 (France)
ELI LEDERMAN - DIRECTEUR GÉNÉRAL DE TURQUOISE :
« Nous espérons afficher 5 % des volumes européens avant la
fin de l'année »
Les premières heures de la plate-forme alternative n'ont
pas altéré l'optimisme des dirigeants de la plate-forme
Turquoise. Son directeur général, Eli Lederman, revient pour
« Les Echos » sur la montée en puissance de cette solution
concurrente des Bourses traditionnelles ainsi que sur ses objectifs.
Turquoise a démarré vendredi son
activité sur un nombre restreint de valeurs britanniques et allemandes.
Comment cela se passe-t-il ?
Tout se passe très bien. Nous sommes dans une phase
intermédiaire entre le test et la production. Le moment, pour tous les
acteurs, de vérifier que les systèmes fonctionnent. Quatorze de
nos membres se sont connectés vendredi et d'autres devraient les
rejoindre cette semaine. Ils devraient être au nombre de 50 en septembre.
Les premières valeurs françaises et néerlandaises seront
accessibles aujourd'hui et les premières valeurs tests pour les autres
marchés européens seront ajoutées d'ici à la fin de
la semaine.
Turquoise sera donc complètement
opérationnelle au 5 septembre ?
En réalité, toutes les valeurs seront disponibles
mais l'activité de tenue de marché ne décollera que
progressivement. Elle sera testée d'ici à la fin du mois et
durant les deux premières semaines de septembre. De fait, si
l'activité de la plate-forme devrait déjà être bien
rodée à la mi-septembre, nous prévoyons de faire notre
lancement formel et de donner le coup d'envoi à notre campagne marketing
et publicitaire à partir du 22 septembre.
Quels sont vos objectifs en termes de part de
marché pour Turquoise ?
Avant la fin de l'année, probablement dès les deux
premiers mois d'existence, nous pensons pouvoir afficher 5 % des volumes de
négociation sur les marchés européens. Le cap des 10 %
devrait ensuite nous permettre d'être en bonne position
financièrement.
Comment voyez-vous l'avenir pour les Bourses
traditionnelles ?
Pour moi, d'ici douze à dix-huit mois, les Bourses
traditionnelles devraient afficher des parts de marché
inférieures à 50 %. Nous sommes très compétitifs.
Les chiffres de Chi-X sont bons. Peut-être ferons-nous mieux. Certes, la
donne a quelque peu changé depuis que nous avons publié nos
tarifs. En particulier, EMCF, la filiale de Fortis qui assure les services de
compensation pour Chi-X, a annoncé des réductions tarifaires.
Mais il est probable que nous annoncerons de nouvelles baisses des coûts
dans le courant du mois de septembre.
Seule ombre au tableau, le marché italien reste
encore hors de portée pour vous. Pourquoi ?
Euro-CCP, qui assure les services de compensation pour nous,
s'était entendu sur un calendrier de lancement avec Monte Titoli, le
dépositaire central italien. Entre-temps, l'organisme italien, pris sur
d'autres projets plus importants, a fait savoir qu'il ne pouvait plus assurer
ces tests. Le dépositaire semble aujourd'hui penser qu'il sera en mesure
de le faire dès le mois d'octobre mais il ne s'est engagé sur
aucune date.
Monte Titoli appartient au groupe LSE.
Soupçonnez-vous une tentative de blocage ?
Je ne participe pas à leurs réunions. Ce que je
vois, c'est le résultat et il n'est pas bon pour Turquoise, pour ses
membres et pour les investisseurs en Europe. Plusieurs notes de recherche ont
démontré que les plates-formes alternatives, via
l'activité de tenue de marché, aboutissaient à des
meilleurs prix, autrement dit, apportaient une valeur ajoutée pour les
investisseurs. La volonté derrière la directive Marchés
d'instruments financiers (MIF) était de parvenir à un
marché européen ouvert.
Cette phase de développement étant sur le
point d'être achevée, le capital de Turquoise va-t-il
évoluer ? Allez-vous développer d'autres projets ?
Je pense effectivement que le capital de la plate-forme va
changer. Nous travaillons actuellement sur un plan, qui pourrait être
rendu public en septembre ou en octobre, prévoyant d'autoriser les
utilisateurs importants de Turquoise à en devenir actionnaires. Et nous
discutons déjà d'autres projets, comme la couverture de nouvelles
classes d'actifs ou de nouvelles zones géographiques.
Source: The Independent (U.K.)
http://www.independent.co.uk/news/business/news/aim-companies-bid-for-dual-listings-oneuronext-to-boost-liquidity-780363.html
AIM companies bid for dual listings on Euronext to boost
liquidity
By Jon Mainwaring Sunday, 10 February 2008
A flurry of companies on London's Alternative Investment Market
are seeking listings with Euronext in a bid to attract investors uncomfortable
with the junior market.
NYSE Euronext is involved in a major marketing effort to court
disgruntled AIM companies fed up with a lack of "liquidity" - or limited
trading in their stock - on the London exchange.
Euronext has set up a rival to AIM - which has until now been the
world's most successful exchange for new and fast growing companies - called
Alternext and is desperate to attract UK companies to it.
A spokesman for Euronext said: "We are getting more and more
requests for dual listings from AIM companies."
A dual listing is when a company raises capital and has shares
quoted on more than just its "home" market.
David Chestnutt, the chief executive of Proventec which revealed
plans last week to seek admission to Euronext, said: "European investors are
not comfortable dealing in the AIM market. There aren't many market makers
handling our shares, there aren't many market makers handling most AIM shares."
Mr Chestnutt maintained he did not want to knock AIM but said he wanted to
provide better liquidity for his European investors.
Proventec is the third AIM company to seek a dual listing in the
last five months.
William Paterson-Brown, the executive chairman of Accsys,
another AIM company, which listed its shares on Euronext in September, said the
dual listing gave access to European fund managers that are currently barred by
their rules from putting their investors' money into lightly regulated markets
such as AIM.
The AIM market's success has made it the subject of
controversy in the past because of its light regulation. Roel Campos, a
Commissioner at the US Securities and Exchange Commission, once said the junior
market "feels like a casino to me".
| 

