I.2.b. Dual-Listed Companies (DLCs)
A dual-listing (DL), also referred as Siamese twin, is the
result of a merger between companies incorporated in different countries. These
two companies agree to unify their forces (cash flows, operational activities),
but to keep separated their identities (assets, shareholdings). In this case,
there are contractual agreements between the two companies to share the cash
flows from each other's assets. Alternatively, the two companies may transfer
all their assets to a holding company which redistributes the dividends. The
shareholders of the two companies have the same rights in terms of votes and
dividends, "in line with
2
These figures include IPOs and capital increases, but no issues
from mergers and acquisitions
the relative 'weights' of the two companies established at the
time of the creation of the DLC"3.
Under this type of organisation, there is a unique management or
an identical management elected on both board.
DLC Structure Type 1 (case of Rio Tinto Ltd and Rio Tinto
Plc)
Shareholders of the Dutch Entity
Assets (operations)
Rio Tinto Ltd listed on Sydney
Dividends
Voting rights
Cash
flows
Shareholders of the English Entity
Dividends
Assets (operations)
Rio tinto Plc Listed on the L.S.E
Voting rights
DLC Structure Type 2 (case of Unilever N.V. and Unilever
Plc)
Shareholders of the Dutch Entity
Holding Company
Dividends
Unilever N.V listed on Amsterdam
Dividends Dividends
Voting rights
Cash flows Operations
Assets
Shareholders of the English Entity
Dividends
Unilever Plc Listed on the L.S.E
Voting rights
3 Reserve Bank of Australia Bulletin, 2002,
"Dual-listed Companies"
First of all, it is important to notice that a dual-listing is
different from a cross- listing, since the shares on each stock exchange are
not from the same company. Whereas a dual-listing implies the quasi-merger of
two companies, a cross-listing results into the secondary listing on a foreign
stock exchange. However, the overall philosophy is the same and that is why
during the creation of the sample in part II. The Geography of the Foreign
Cross-Listing, dual-listings will be considered as cross-listings. However, in
the part dealing with the liquidity and the volumes matters (see IV. Is the
Foreign Cross-Listing Efficient ?), DLCs are not taken into consideration since
their shares are different and therefore not tradable on the both stock
exchanges (e.g. impossibility to perform arbitrages, i.e. buy a stocks on the
ASX and sell it on the L.S.E).
At the moment, two of the most relevant cases of dual-listing
are BHP Billiton Plc/BHP Billiton Ltd (U.K., listed on L.S.E/Australia, listed
on ASX) and Unilever Plc/Unilever N.V (U.K., listed on L.S.E/The Netherlands,
listed on Euronext Amsterdam).
All actual dual-listed companies (as of December 2008):
4 ThomsonReuters (Canada/U.K., 2008)
4 Mondi (South Africa/U.K., 2007)
4 Anheuser-Busch InBev (Belgium/Brazil, 2004)
4 Carnival Corporation (U.K./U.S., 2003)
4 Investec Bank (South Africa/U.K., 2002)
4 BHP Billiton (Australia/U.K., 2001)
4 Rio Tinto (Australia/U.K., 1995)
4 Reed Elsevier (U.K./The Netherlands, 1993)
4 Unilever (U.K./The Netherlands, 1930)
Former dual-listed companies (as of December, 2008):
4 Royal Dutch Shell (U.K./The Netherlands, 1907-2005)
4 Brambles Industries (Australia/U.K., 2001-2006)
4 Fortis (Belgium/The Netherlands, 1990-2001)
4 Allied Zurich (now ZFS) (U.K./Switzerland, 1998-2000)
4 Dexia (Belgium/France, 1996-2000)
4 Nordbanken/Merita (now Nordea) (Sweden/Finland, 1997-2000)
4 ABB Group (Sweden/Switzerland, 1988-1999)
4 Smith Kline Beecham (now Glaxo) (U.K./U.S., 1989-1996)
According to the managements of former DLCs, the main reasons
evoked to justify the withdrawal of the DLC structure is the willingness to
eliminate the premium/discount between the two companies, although there is
theoretically no possibility of arbitrage since the two companies offer
equivalent dividend and voting right to their respective shareholders. However,
some examples had shown significant gap between the two stocks values.
Several studies have already been done about this subject (L.
Rosenthal and C. Young4 in 1990, K. Froot and E. Dabora5
in 1999), showing that "significant mispricing in three DLCs (Royal Dutch
Shell, Unilever, and Smithkline Beecham) has existed over a long period of
time. Both studies conclude that fundamental factors (such as currency risk,
governance structures, legal contracts, liquidity, and taxation) are not
sufficient to explain the magnitude of the price deviations". K. Froot and E.
Dabora5 stated that "the relative prices of the twin stocks are
correlated with the stock indices of the markets on which each of the twins has
its main listing. For example, if the FTSE 100 rises relative to the AEX index
(the Dutch stock market index) the stock price of Reed International PLC
generally tends to rise relative to the stock price of Elsevier NV. A potential
explanation is that local market sentiment affects the relative prices of the
shares of the DLC parent companies".
4
L. Rosenthal and C. Young, 1990, "The seemingly anomalous price
behavior of Royal Dutch/Shell and Unilever N.V./PLC"
5 K. Froot and E. Dabora, 1999, "How are stock prices
affected by the location of trade?"
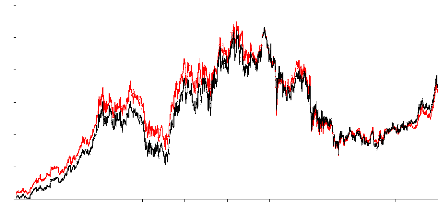
#2: Evolutions of the stocks Rio Tinto Pic (London) and
Rio
Tinto Ltd (Sydney)
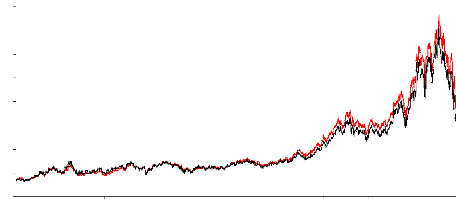
Both shares price in £, by using the dai ly currency
conversion rate A$/£
70
60
50
40
30
20
10
0
80
1998 1999 2000 2001 2002 2003 2004 2005 2006 2007 2008
Sydney London
Source: ThomsonReuters Datastream, from the 07/10/1998 to
the 07/10/2008
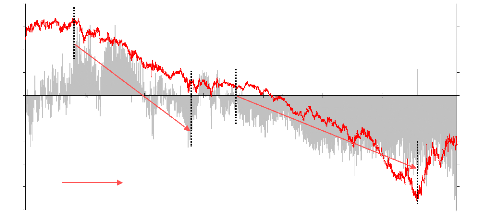
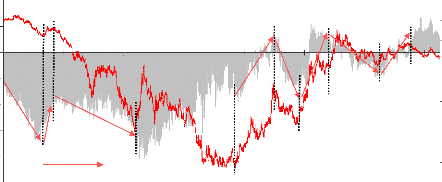
#3: Premium / Discount (Rio Tinto Pic vs. Rio Tinto Ltd)
20%
Premium / Discount
min (29/09/2008) -29.88%
max (31/03/2000) 15.31%
average -3.65%
Gross tendance FTSE vs. ASX
15%
10%
5%
0%
-5%
-10%
-15%
-20%
-25%
30
10
-10
-30
-50
-70
-90
-110
-130
-150
1998 199922000 2001 2002 2003 2004 2005 2006
2007 2008
|
% Premium / % Discount (LHS) Variations FTSE vs. ASX (RHS)
|
|
Source: ThomsonReuters Datastream, from the 07/10/1998 to
the 07/10/2008 Premium / discount calculated by using the daily currency
conversion rate A$/£
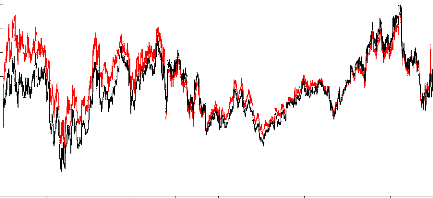
#4: Evolutions of the stocks Royal Dutch N. V (Amsterdam)
and
Shell Plc (London)
40 Both shares price in €, by us ing the daily currency
conversion rate £/€
35
30
25
20
15
10
1995 1996 1997 1998 1999 2000 2001 2002 2003 2004 2005
Royal Dutch N.V Shell Plc
Source: ThomsonReuters Datastream, from the 19/07/1995 to
the 19/07/2005, i.e. date of the complete unification of the two companies and
the creation of Royal Dutch Shell
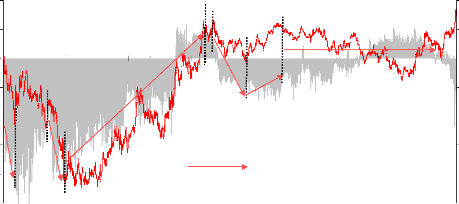
#5: Premium / Discount (Shell Plc vs. Royal Dutch N. V)
-10%
-15%
-20%
-25%
10%
-5%
5%
0%
Gross tendance FTSE vs. AEX
Premium / Discount
min (03/02/1999) -20.48%
max (27/02/2003) 6.74%
average -5.62%
20
0
-20
-40
-60
-80
-100
-120
-140
-160
1995 1996 1998 1999 2001 2002 2003 2005

% Premium / % Discount (LHS) Variations FTSE vs. AEX (RHS)
Source: ThomsonReuters Datastream, from the 19/07/1995 to
the 19/07/2005 Premium / discount calculated by using the daily currency
conversion rate £/€
Both shares price in €, by us ing the daily currency
conversion rate £/€
#6: Evolutions of the stocks Unilever N. V (Amsterdam)
and
Unilever Plc (London)
26 24 22 20 18 16 14 12
10
1998 1999 2000 2001 2002 2003 2004 2005 2006 2007 2008
Unilever N.V Unilever Plc
Source: ThomsonReuters Datastream, from the 07/10/1998 to
the 07/10/2008
#7: Premium / Discount (Unilever Plc vs. Unilever N.V)
- 25%
- 10%
- 15%
- 20%
10%
-5%
5%
0%
Gross tendance FTSE vs. AEX
Premium / Discount
min (03/02/1999) -29.54% max (27/02/2003) 5.85%
average
-4.60%
20
0
- 10
- 20
- 30
- 40
- 50
10
1998 2000 2001 2002 2004 2005 2007 2008
|
% Premium / % Discount (LHS) Variations FTSE vs. AEX (RHS)
|
Source: ThomsonReuters Datastream, from the 07/10/1998 to the
07/10/2008 Premium / discount calculated by using the daily currency conversion
rate £/€
Note: In order to offset the forex variation between two stocks
listed in different currencies, we have used the day-after-day spot conversion
rate.
The analysis of the three exhibits #3, #5, #7 entitled
"Premium / Discount" and representing the cases Royal Dutch Shell, Rio Tinto
and Unilever, confirms the statement made by K. Froot and E. Dabora (see
quotation page 10). During a substantial period of time (several months or
years), the premium/discount evolution of the DLC evolves in the same way as
the difference of variation between the two stock exchanges of quotation. The
more a stock exchange outperforms the second one, the more the premium for the
stock listed on the first one increases (or the discount decreases).
The most striking case concerns Rio Tinto. During an 8-years
period of time (1998-2008), the premium of the stock listed on the L.S.E
reached a maximum of circa 15% and progressively decreased to become a discount
of circa 23% on July 2008. This decrease was quite progressive and regular over
the time. These graphs illustrate the correlation between the premium/discount
and the difference of evolution between the two stock exchanges. Over the
10-years period, the correlation between the two variables is quite strong and
reaches the value of 0.82.
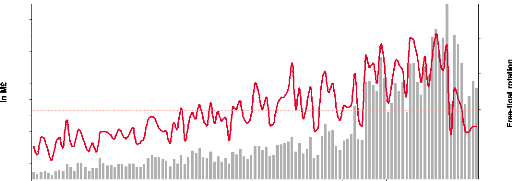
#8: 10-Years Evolution of Rio Tinto Pic Daily Free-Fioat
Rotation (London)
550
2.0%
500
450
1.6%
400
350
200
150
100
0.4%
50
0
0.0%
1.2%
300
250
10Y free-float rotation = 0.79
0.8%
1998 1999 2000 2001 2002 2003 2004 2005 2006 2007 2008

Monthly average daily volumes (LHS) % of the free-float (RHS)
Source: ThomsonReuters Datastream
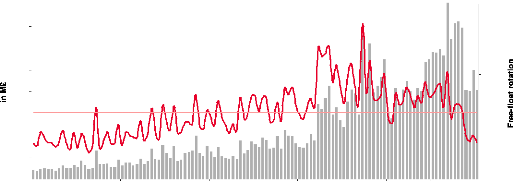
#9: 10-Years Evolution of Rio Tinto Ltd Daily Free-Float Rotation
(Sydney)
160
2.0%
0.0%
80
140
1.6%
120
100
1.2%
10Y free-float rotation = 0.76
60
40
0.8%
0.4%
20
0
1998 1999 2000 2001 2002 2003 2004 2005 2006 2007 2008
|
Monthly average daily volumes (LHS) % of the free-float (RHS)
|
Source: ThomsonReuters Datastream
As we may notice after the analysis of the two exhibits #8 and
#9, the 10-year daily free-float rotations are almost the same (0.79 vs. 0.76)
and follow the same tendency over the time. Hence, we may reject the hypothesis
that the difference of liquidity between the two stocks could have an influence
on the premium/discount variation.
Since 2002, we may notice the relative narrowing of the gap
between the two stocks, consequence of more efficient financial markets, a
growing deregulation and the fall of barriers between countries.
Through the analysis of former DLCs, we may note that since
the year 2000 a majority of DLCs have disappeared. In each case, the reasons
pleading for the total unification of the DLC were a greater liquidity thanks
to a unique stock traded and the increase of weight in benchmark index.
Moreover, companies' managements have to take into consideration that owning a
control stake in the capital of one of the two companies provides the control
of the whole DLC.
After this simplification of structure, the two listings become a
simple cross-listing.
| 

