ANNEXES
TEST DE CAUSALITE AU SENS DE
GRANGER
ANNEXEA0
Pairwise Granger Causality Tests Date: 02/25/09 Time: 11:19 Sam
ple: 1970 2006
Lags: 2
|
Null Hypothesis:
|
Obs
|
F-Statistic
|
Probability
|
|
LIDE does not Granger Cause LPOP
|
35
|
0.57487
|
0.56885
|
|
LPOP does not Granger Cause LIDE
|
|
0.83 140
|
0.44523
|
|
LIDE does not Granger Cause LPNBHBT
|
35
|
1.20440
|
0.31 396
|
|
LPNBHBT does not Granger Cause LIDE
|
|
0.65417
|
0.52713
|
|
LIDE does not Granger Cause LOUV
|
35
|
0.93977
|
0.00092
|
|
LOUV does not Granger Cause LIDE
|
|
0.82043
|
0.44988
|
|
LDEN does not Granger Cause LIDE
|
35
|
0.10018
|
0.90498
|
|
LIDE does not Granger Cause LDEN
|
|
0.09065
|
0.91 359
|
|
LCR does not Granger Cause LIDE
|
35
|
1.58851
|
0.22093
|
|
LIDE does not Granger Cause LCR
|
|
0.14722
|
0.00073
|
|
LANAL does not Granger Cause LIDE
|
35
|
3.77987
|
0.03435
|
|
LIDE does not Granger Cause LANAL
|
|
0.34693
|
0.70965
|
|
DS does not Granger Cause LIDE
|
35
|
1.12793
|
0.33705
|
|
LIDE does not Granger Cause DS
|
|
1.98444
|
0.00210
|
ANNEXE 1 : TEST DE NORMALITE SUR ENSEMBLE DES
VARIABLES
|
DS
|
LPOP
|
LPNBHBT
|
LOUV
|
LIDE
|
LDEN
|
LCR
|
|
Mean
|
0.419355
|
2.432598
|
6.376786
|
-0.702294
|
3.934295
|
4.720614
|
-1 .6987
|
|
Median
|
0.000000
|
2.397895
|
6.470800
|
-0.693 147
|
4.356709
|
4.699998
|
-1.6094
|
|
Maximum
|
1.000000
|
2.890372
|
7.363280
|
-0.356675
|
6.400257
|
4.879995
|
-1.2039
|
|
Minimum
|
0.000000
|
1.945910
|
5.111988
|
-1.139434
|
0.693147
|
4.579996
|
-2.5257
|
|
Std. Dev.
|
0.501610
|
0.313679
|
0.542277
|
0.205758
|
1.572589
|
0.112269
|
0.3634
|
|
Skewness
|
0.326860
|
-0.037987
|
-0.902414
|
-0.292044
|
-0.527454
|
0.159205
|
-0.7261
|
|
Kurtosis
|
1.106838
|
1.624918
|
3.200687
|
2.581052
|
2.203461
|
1.410792
|
2.4130
|
|
Jarque-Bera
|
5.181410
|
2.449804
|
4.259502
|
0.667375
|
2.256937
|
3.393167
|
3.1690
|
|
Probability
|
0.074967
|
0.293787
|
0.118867
|
0.716278
|
0.323528
|
0.183309
|
0.2050
|
|
Observations
|
31
|
31
|
31
|
31
|
31
|
31
|
31
|
|
LANAL
|
|
|
|
|
|
|
|
Mean
|
-2.010765
|
|
|
|
|
|
|
|
Median
|
-2.040221
|
|
|
|
|
|
|
|
Maximum
|
-0.820981
|
|
|
|
|
|
|
|
Minimum
|
-3.506558
|
|
|
|
|
|
|
|
Std. Dev.
|
0.785833
|
|
|
|
|
|
|
|
Skewness
|
-0.146548
|
|
|
|
|
|
|
|
Kurtosis
|
1.840012
|
|
|
|
|
|
|
|
Jarque-Bera
|
2.206859
|
|
|
|
|
|
|
|
Probability
|
0.331731
|
|
|
|
|
|
|
|
Observations
|
37
|
|
|
|
|
|
|
ANNEXE 2 : TEST DE LA TRACE DE JOHANSEN
Date: 02/25/09 Time: 10:51
Sam ple: 1970 2006
Included observations: 35
Test
assum ption:
No
determ inistic
trend in the
data
Series: LIDE LPOP LPNBHBT LOUV LDEN LCR LANAL DS Lags interval: 1
to 1
|
Eigenvalue
|
Likelihood
Ratio
|
5 Percent
Critical Value
|
1 Percent
Critical Value
|
Hypothesized
No. of CE(s)
|
|
0.983721
|
312.5192
|
141.20
|
152.32
|
None **
|
|
0.801818
|
168.3934
|
109.99
|
119.80
|
At most 1 **
|
|
0.638840
|
111.7434
|
82.49
|
90.45
|
At most 2 **
|
|
0.594830
|
76.09818
|
59.46
|
66.52
|
At most 3 **
|
|
0.467625
|
44.47747
|
39.89
|
45.58
|
At most 4 *
|
|
0.348052
|
22.41321
|
24.31
|
29.75
|
At most 5
|
|
0.184338
|
7.440540
|
12.53
|
16.31
|
At most 6
|
|
0.008793
|
0.309105
|
3.84
|
6.51
|
At most 7
|
*(**) denotes rejection of the hpothesis at 5% (1%)
level
LR. Test indicates 5 cointegrating equation(s) at 5%
significance level
TESTS SUR LES RESIDUS DU MODELE DE LONG
TERME.
ANNEXES 3 : TEST DE NORMALITE
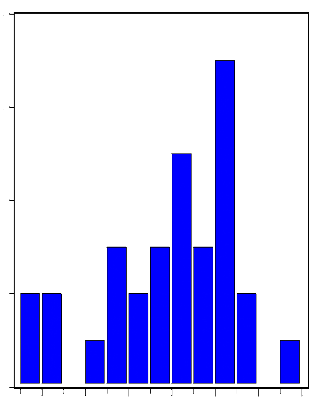
-1 .5 -1 .0 - 0.5 0.0 0.5 1 .0 1 .5
8
6
4
2
0
Series: RESID01
Sample 1970 2006
Observations 31
Mean -2.55E-15
Median 0.171695
Maximum 1.434842
Minimum -1.546716
Std. Dev. 0.781764
Skewness -0.486240
Kurtosis 2.442249
Jarque-Bera 1.623371
Probability 0.444109
Source : Résultats obtenu sur Eviews
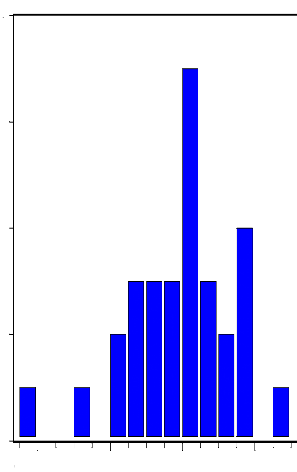
TESTS SUR LES RESIDUS DU MODELE DE COURT
TERME.
ANNEXES 4 : TEST DE NORMALITE
8
6
4
2
0
-8.0E-13 -4.0E-1 3 -1.3E-28 4.0E-1 3
Seies: RESID02
Sample 1971 2006
Observations 30
Mean -5.23E-15
Median 2.65E-14
Maximum 5.42E-13
Minimum -8.75E-13
Std. Dev. 2.96E-13
Skewness -0.722792
Kurtosis 4.014703
Jarque-Bera 3.899169
Probability 0.142333
Source : Résultats obtenu sur Eviews
TABLES DES MATIERES
|
AVERTISSEMENT
|
2
|
|
DEDICACE
|
.3
|
|
REMERCIEMENTS
|
4
|
|
SOMMAIRE
|
5
|
|
LISTE DES SIGLES ET ABRVIATIONS
|
. 6
|
|
LISTE DES GRAPHIQUES ET DES FIGURES
|
7
|
|
LISTE DES TABLEAUX
|
8
|
|
RESUME
|
..9
|
|
INTRODUCTION GENERALE
|
10
|
PREMIERE PARTIE : CADRE THEORIQUE ET CONCEPTUEL DE
L'ETUDE....15
|
CHAPITRE 1 : THEORIE DES IDE
|
16
|
|
SECTION 1- Définition et
déterminants théoriques de l'ide
|
17
|
|
A : Revue générales des théories sur les IDE
|
17
|
|
B : Définitions opérationnelles des Investissements
Directs Etrangers
|
21
|
|
C : La firme multinationale
|
23
|
|
D : La théorie O.L.I
|
.25
|
1-Les facteurs d'offre 26
2- Les facteurs de demande 26
|
SECTION 2- Les stratégies des ides
|
.29
|
|
A : La stratégie d'accès aux ressources du
sol et du sous-sol
|
29
|
|
B : La stratégie Horizontale...... ...... ... ......
|
.......... .....30
|
|
C : La stratégie verticale
|
32
|
| 

