ANNEXES
Tableau n°1 : Indices prix
à la consommation (Base 1995 = 100) et recettes fiscales en RDC de
1995 à 2011.
|
ANNEES
|
IPC
|
RECETTES FISCALE
(en million de CDF)
|
|
1995
|
100,00
|
15,79
|
|
1996
|
818,00
|
102,30
|
|
1997
|
2 441,90
|
321,97
|
|
1998
|
3 153,60
|
534,42
|
|
1999
|
12 138,21
|
1 794,18
|
|
2000
|
78 899,62
|
10 269,21
|
|
2001
|
421 684,96
|
61 466,92
|
|
2002
|
485 085,56
|
121 778,41
|
|
2003
|
509 971,00
|
165 507,74
|
|
2004
|
556 931,45
|
215 252,60
|
|
2005
|
645 072,50
|
335 702,48
|
|
2006
|
888 422,83
|
462 101,30
|
|
2007
|
851 110,72
|
604 746,10
|
|
2008
|
1 003 197,50
|
992 415,10
|
|
2009
|
1 466 886,86
|
1 191 811,90
|
|
2010
|
1 611 228,53
|
1 632 393,90
|
|
2011
|
1 859 866,03
|
2 108 002,60
|
Source : Rapport annuel de la Banque
Centrale du Congo/Direction de Kisangani de 1995 à 2011.
Tableau n° 2. Évolution des recettes
fiscales en RDCde 1995 à 2011
|
Année
|
Recettes fiscales
|
Indices
|
|
1995
|
15.79
|
100
|
|
1996
|
102.30
|
648
|
|
1997
|
321.97
|
2039
|
|
1998
|
534.42
|
3385
|
|
1999
|
1 794.18
|
11363
|
|
2000
|
10 269.21
|
65036
|
|
2001
|
61 466.92
|
389278
|
|
2002
|
121 778.41
|
771238
|
|
2003
|
165 507.74
|
1048181
|
|
2004
|
215 252.60
|
1363221
|
|
2005
|
335 702.48
|
2126045
|
|
2006
|
462 101.30
|
2926544
|
|
2007
|
604 746.10
|
3829931
|
|
2008
|
992 415.10
|
6285086
|
|
2009
|
1 191 811.90
|
7547890
|
|
2010
|
1 632 393.90
|
10338150
|
|
2011
|
2 108 002.60
|
13350238
|
Source : Rapport annuel de la Direction
Générale des Impôts en RDCde 1995 à 2011.
Tableau n°3. Estimation du
modèle
|
Dependent Variable: RECETTES
|
|
Method: Least Squares
|
|
Date: 07/15/13 Time: 04:39
|
|
Sample: 1995 2011
|
|
Included observations: 17
|
|
Variable
|
Coefficient
|
Std. Error
|
t-Statistic
|
Prob.
|
|
C
|
-159154.0
|
70896.72
|
-2.244871
|
0.0403
|
|
IPC
|
1.020470
|
0.083921
|
12.15994
|
0.0000
|
|
R-squared
|
0.907899
|
Mean dependent var
|
464953.9
|
|
Adjusted R-squared
|
0.901759
|
S.D. dependent var
|
643379.1
|
|
S.E. of regression
|
201657.4
|
Akaike info criterion
|
27.37666
|
|
Sum squared resid
|
6.10E+11
|
Schwarz criterion
|
27.47468
|
|
Log likelihood
|
-230.7016
|
F-statistic
|
147.8642
|
|
Durbin-Watson stat
|
0.665348
|
Prob(F-statistic)
|
0.000000
|
Source : Eviews 3.1, commande : LS RECETTES C IPC
Tableau n°4. Test de stationnarité des
recettes fiscales
|
ADF Test Statistic
|
5.930301
|
1% Critical Value*
|
-3.9635
|
|
|
5% Critical Value
|
-3.0818
|
|
|
10% Critical Value
|
-2.6829
|
|
*MacKinnon critical values for rejection of hypothesis of a unit
root.
|
|
|
|
|
|
|
|
|
|
|
|
Augmented Dickey-Fuller Test Equation
|
|
Dependent Variable: D(RECETTES)
|
|
Method: Least Squares
|
|
Date: 07/15/13 Time: 04:42
|
|
Sample(adjusted): 1997 2011
|
|
Included observations: 15 after adjusting endpoints
|
|
Variable
|
Coefficient
|
Std. Error
|
t-Statistic
|
Prob.
|
|
RECETTES(-1)
|
0.504908
|
0.085140
|
5.930301
|
0.0001
|
|
D(RECETTES(-1))
|
-0.815328
|
0.312643
|
-2.607855
|
0.0229
|
|
C
|
34151.95
|
18541.04
|
1.841965
|
0.0903
|
|
R-squared
|
0.901200
|
Mean dependent var
|
140526.7
|
|
Adjusted R-squared
|
0.884733
|
S.D. dependent var
|
163815.6
|
|
S.E. of regression
|
55616.94
|
Akaike info criterion
|
24.86722
|
|
Sum squared resid
|
3.71E+10
|
Schwarz criterion
|
25.00883
|
|
Log likelihood
|
-183.5041
|
F-statistic
|
54.72874
|
|
Durbin-Watson stat
|
2.102939
|
Prob(F-statistic)
|
0.000001
|
Source : Eviews 3.1, commande : ADF
RECETTES
Tableau n°5. Test de stationnarité des
IPC
|
ADF Test Statistic
|
1.540324
|
1% Critical Value*
|
-3.9635
|
|
|
5% Critical Value
|
-3.0818
|
|
|
10% Critical Value
|
-2.6829
|
|
*MacKinnon critical values for rejection of hypothesis of a unit
root.
|
|
|
|
|
|
|
|
|
|
|
|
Augmented Dickey-Fuller Test Equation
|
|
Dependent Variable: D(IPC)
|
|
Method: Least Squares
|
|
Date: 07/15/13 Time: 04:46
|
|
Sample(adjusted): 1997 2011
|
|
Included observations: 15 after adjusting endpoints
|
|
Variable
|
Coefficient
|
Std. Error
|
t-Statistic
|
Prob.
|
|
IPC(-1)
|
0.136801
|
0.088813
|
1.540324
|
0.1494
|
|
D(IPC(-1))
|
-0.179633
|
0.325977
|
-0.551061
|
0.5917
|
|
C
|
65372.35
|
54985.08
|
1.188911
|
0.2575
|
|
R-squared
|
0.175882
|
Mean dependent var
|
123936.5
|
|
Adjusted R-squared
|
0.038529
|
S.D. dependent var
|
143341.9
|
|
S.E. of regression
|
140553.3
|
Akaike info criterion
|
26.72142
|
|
Sum squared resid
|
2.37E+11
|
Schwarz criterion
|
26.86303
|
|
Log likelihood
|
-197.4106
|
F-statistic
|
1.280514
|
|
Durbin-Watson stat
|
2.135733
|
Prob(F-statistic)
|
0.313282
|
Source: Eviews 3.1, commande : ADF
IPC
Tableau n°6. Test de causalité
|
Pairwise Granger Causality Tests
|
|
Date: 07/15/13 Time: 04:49
|
|
Sample: 1995 2011
|
|
Lags: 1
|
|
Null Hypothesis:
|
Obs
|
F-Statistic
|
Probability
|
|
RECETTES does not Granger Cause IPC
|
16
|
2.49059
|
0.13854
|
|
IPC does not Granger Cause RECETTES
|
2.02674
|
0.17811
|
Source : Eviews 3.1, commande : LS RECETTES C IPC
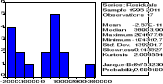
Figure n°5 : Test de Jarque Bera
Pour tout contact :
Téléphone : +(243) 99 30 25 145
et 81 53 61 612
E-mail :
ngbale2012fataki@gmail.com
et
jacquesrichardfataki@yahoo.fr

| 

