ANNEXES
Annexe 1 : Répartition du PIB (en millions de dollars us)
par secteur dans les pays de l'UEMOA de 2000 à 2008
|
PAYS
|
COMPOSANT
|
2000
|
2001
|
2002
|
2003
|
2004
|
2005
|
2006
|
2007
|
2008
|
|
Bénin
|
PIB
|
2359,124
|
2499,268
|
2807,652
|
3557,225
|
4050,864
|
4358,007
|
4705,08
|
5511,878
|
6642,999
|
|
Agriculture
|
34,9%
|
34,5%
|
33,8%
|
32,1%
|
32,3%
|
32,3%
|
32,4%
|
31,4%
|
32,5%
|
|
Industrie
|
12,9%
|
13,3%
|
13,6%
|
13,7%
|
13,3%
|
13,3%
|
13,0%
|
13,0%
|
12,6%
|
|
Services
|
44,6%
|
44,5%
|
44,6%
|
46,1%
|
45,9%
|
46,0%
|
46,3%
|
47,2%
|
46,7%
|
|
Burkina Faso
|
PIB
|
2617,082
|
2791,542
|
3238,527
|
4324,903
|
5028,985
|
5426,181
|
5770,831
|
6756,541
|
7949,051
|
|
Agriculture
|
30,9%
|
36,3%
|
32,9%
|
32,9%
|
31,0%
|
33,0%
|
32,0%
|
29,1%
|
28,9%
|
|
Industrie
|
20,0%
|
15,7%
|
19,7%
|
20,4%
|
19,6%
|
18,5%
|
18,9%
|
21,7%
|
21,9%
|
|
Services
|
43,9%
|
42,1%
|
40,5%
|
39,9%
|
41,4%
|
40,8%
|
41,3%
|
41,0%
|
41,3%
|
|
Côte
d'Ivoire
|
PIB
|
10681,54
|
10735,45
|
11493,88
|
13737,6
|
15701,38
|
16353,97
|
17369,04
|
19788,98
|
23406,21
|
|
Agriculture
|
23,8%
|
24,3%
|
25,7%
|
25,5%
|
22,9%
|
22,8%
|
22,9%
|
23,9%
|
23,2%
|
|
Industrie
|
26,3%
|
23,7%
|
22,9%
|
21,7%
|
22,7%
|
25,9%
|
25,9%
|
25,3%
|
25,7%
|
|
Services
|
45,9%
|
41,5%
|
41,0%
|
42,0%
|
41,7%
|
41,4%
|
41,7%
|
41,2%
|
41,5%
|
|
Guinée-Bissau
|
PIB
|
215,474
|
198,9887
|
203,6142
|
238,9249
|
269,8847
|
301,112
|
307,5377
|
357,2123
|
404,4169
|
|
Agriculture
|
57,4%
|
55,1%
|
56,4%
|
56,1%
|
58,9%
|
59,3%
|
57,5%
|
58,6%
|
58,4%
|
|
Industrie
|
12,0%
|
12,5%
|
12,9%
|
12,6%
|
11,7%
|
11,5%
|
12,4%
|
11,9%
|
11,9%
|
|
Services
|
28,2%
|
30,7%
|
29,1%
|
29,4%
|
27,8%
|
27,6%
|
28,8%
|
28,1%
|
28,2%
|
|
Mali
|
PIB
|
2655,439
|
3017,629
|
3189,056
|
4221,53
|
4982,27
|
5486,319
|
6122,647
|
7145,363
|
8599,358
|
|
Agriculture
|
33,5%
|
35,0%
|
29,9%
|
35,3%
|
34,2%
|
34,6%
|
33,2%
|
32,6%
|
33,8%
|
|
Industrie
|
19,3%
|
21,5%
|
25,4%
|
20,1%
|
21,6%
|
22,2%
|
22,0%
|
20,4%
|
18,3%
|
|
Services
|
39,6%
|
35,8%
|
35,7%
|
35,7%
|
34,8%
|
35,6%
|
35,7%
|
37,3%
|
37,6%
|
|
Niger
|
PIB
|
1666,176
|
1813,61
|
2065,358
|
2639,892
|
2897,006
|
3369,007
|
3646,726
|
4246,875
|
5210,073
|
|
Agriculture
|
36,7%
|
40,9%
|
41,9%
|
44,1%
|
40,2%
|
42,5%
|
42,9%
|
40,8%
|
43,3%
|
|
Industrie
|
12,5%
|
12,0%
|
11,5%
|
11,5%
|
11,9%
|
11,0%
|
11,3%
|
13,8%
|
13,3%
|
|
Services
|
45,6%
|
41,3%
|
39,8%
|
38,7%
|
41,1%
|
39,8%
|
39,4%
|
39,1%
|
37,7%
|
|
Sénégal
|
PIB
|
4679,605
|
4877,602
|
5333,862
|
6859,594
|
8031,344
|
8707,815
|
9358,335
|
11283,38
|
13287,5
|
|
Agriculture
|
16,9%
|
16,3%
|
13,6%
|
15,1%
|
13,7%
|
14,6%
|
13,0%
|
11,8%
|
13,1%
|
|
Industrie
|
20,5%
|
21,7%
|
22,3%
|
21,4%
|
21,7%
|
20,5%
|
20,1%
|
20,3%
|
20,3%
|
|
Services
|
50,8%
|
50,3%
|
51,8%
|
51,3%
|
52,1%
|
51,8%
|
53,4%
|
54,2%
|
53,1%
|
|
Togo
|
PIB
|
1294,136
|
1332,204
|
1472,404
|
1673,507
|
1935,432
|
2081,565
|
2197,207
|
2540,842
|
2877,338
|
|
Agriculture
|
34,9%
|
37,5%
|
38,0%
|
35,8%
|
36,3%
|
39,8%
|
37,6%
|
38,5%
|
38,6%
|
|
Industrie
|
18,2%
|
17,1%
|
18,1%
|
18,4%
|
17,2%
|
17,5%
|
16,3%
|
17,4%
|
17,1%
|
|
Services
|
39,5%
|
37,7%
|
36,4%
|
37,5%
|
37,8%
|
35,0%
|
38,1%
|
37,1%
|
36,7%
|
|
UEMOA
|
PIB
|
26168,57
|
27266,3
|
29804,35
|
37253,18
|
42897,17
|
46083,98
|
49477,41
|
57631,07
|
68376,95
|
|
Agriculture
|
33,6%
|
35,0%
|
34,0%
|
34,6%
|
33,7%
|
34,9%
|
33,9%
|
33,3%
|
34,0%
|
|
Industrie
|
17,7%
|
17,2%
|
18,3%
|
17,5%
|
17,5%
|
17,5%
|
17,5%
|
18,0%
|
17,6%
|
|
Services
|
40,9%
|
39,6%
|
38,9%
|
39,1%
|
39,1%
|
38,8%
|
39,5%
|
39,5%
|
39,3%
|
Source : CNUCED
58
Annexe 2 : Tableau de répartition des principales cultures
d'exportation (en milliers de tonnes) par produit dans l'UEMOA
|
Arachides
|
|
2000
|
2001
|
2002
|
2003
|
2004
|
2005
|
Moyenne
2000-2005
|
Pourcentage
|
|
Bénin
|
100,9
|
121,2
|
125,4
|
146,2
|
164,7
|
141,0
|
133,2
|
10,2%
|
|
Burkina-Faso
|
282,8
|
169,1
|
301,1
|
323,6
|
368,9
|
379,9
|
304,2
|
23,4%
|
|
Mali
|
158,4
|
-
|
174,6
|
120,8
|
290,0
|
212,0
|
159,3
|
12,2%
|
|
Niger
|
103,7
|
113,2
|
82,0
|
153,7
|
196,9
|
144,2
|
132,3
|
10,2%
|
|
Sénégal
|
1014,2
|
-
|
943,8
|
265,4
|
440,7
|
572,6
|
539,5
|
41,4%
|
|
Togo
|
26,0
|
33,0
|
35,7
|
38,2
|
36,2
|
36,5
|
34,3
|
2,6%
|
|
UEMOA
|
1686,0
|
436,5
|
1662,6
|
1047,9
|
1497,4
|
1486,2
|
1302,8
|
100,0%
|
|
Café
|
|
2000
|
2001
|
2002
|
2003
|
2004
|
2005
|
Moyenne
2000-2005
|
Pourcentage
|
|
Côte d'Ivoire
|
379,10
|
301,10
|
182,00
|
136,60
|
154,10
|
154,10
|
192,15
|
95,1%
|
|
Togo
|
15,20
|
16,90
|
17,80
|
3,80
|
5,30
|
4,80
|
9,83
|
4,9%
|
|
UEMOA
|
394,30
|
318,00
|
199,80
|
140,40
|
159,40
|
158,90
|
201,98
|
100,0%
|
|
Cacao
|
|
2000
|
2001
|
2002
|
2003
|
2004
|
2005
|
Moyenne
2000-2005
|
Pourcentage
|
|
Côte d'Ivoire
|
1412,40
|
1212,40
|
1264,70
|
1336,40
|
1406,20
|
1419,30
|
1341,90
|
99,5%
|
|
Togo
|
6,60
|
10,20
|
7,50
|
7,60
|
4,90
|
5,40
|
7,03
|
0,5%
|
|
UEMOA
|
1419,00
|
1222,60
|
1272,20
|
1344,00
|
1411,10
|
1424,70
|
1348,93
|
100,0%
|
|
Coton
|
|
2000
|
2001
|
2002
|
2003
|
2004
|
2005
|
Moyenne
2000-2005
|
Pourcentage
|
|
Bénin
|
362,20
|
336,60
|
416,40
|
337,30
|
330,00
|
348,80
|
355,22
|
19,8%
|
|
Burkina-Faso
|
270,00
|
275,80
|
378,50
|
409,10
|
461,10
|
563,00
|
392,92
|
21,9%
|
|
Côte d'Ivoire
|
398,70
|
287,00
|
393,00
|
396,10
|
300,00
|
344,00
|
353,13
|
19,6%
|
|
Mali
|
459,10
|
242,80
|
570,90
|
439,80
|
608,70
|
620,70
|
490,33
|
27,3%
|
|
Niger
|
3,30
|
2,40
|
2,70
|
8,30
|
8,40
|
10,00
|
5,85
|
0,3%
|
|
Sénégal
|
14,60
|
20,40
|
35,70
|
40,10
|
55,00
|
50,00
|
35,97
|
2,0%
|
|
Togo
|
117,40
|
168,30
|
186,60
|
164,10
|
175,00
|
175,00
|
164,40
|
9,1%
|
|
UEMOA
|
1625,30
|
1333,30
|
1983,80
|
1794,80
|
1938,20
|
2111,50
|
1797,82
|
100,0%
|
Source : compilation de l'auteur (donnée de la BCEAO,
2005)
59
Annexe 3 : Evolution comparée des principales
cultures vivrières et des cultures d'exportation par année pour
chaque pays
Bénin Burkina-Faso Côte d'Ivoire
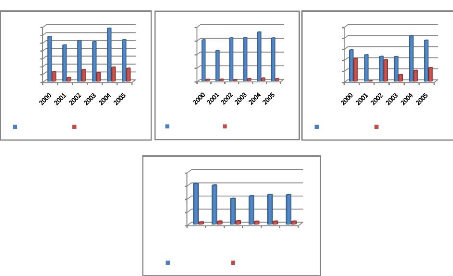
Sénégal
Mali Niger
Togo
3500,0
3000,0
2500,0
2000,0
1500,0
1000,0
500,0
0,0
Cultures vivrières Cultures
d'exportation
2500,0
2000,0
1500,0
1000,0
500,0
0,0
Cultures vivrières Cultures
d'exportation
4000,0
3000,0
2000,0
1000,0
0,0
Cultures vivrières Cultures d'exportation
4000,0
3000,0
2000,0
1000,0
0,0
2000 2001 2002 2003 2004 2005
Cultures vivrières Cultures d'exportation
|
|
|
|
|
9000,0
|
4000,0
|
|
10000,0
|
|
8000,0
|
|
7000,0
|
3000,0 2000,0 1000,0 0,0
Cultures vivrières
|
Cultures d'exportation
|
8000,0 6000,0 4000,0 2000,0
0,0
2000 2001 2002 2003 2004 2005
Cultures vivrières Cultures
d'exportation
|
|
6000,0 5000,0 4000,0 3000,0 2000,0 1000,0
|
|
0,0
2000 2001 2002 2003 2004 2005
Cultures vivrières Cultures
d'exportation
|
Source : auteur
Annexe 4 : Structure des exportations agricoles dans quelques
pays de l'UEMOA
Burkina-Faso (valeur en milliards de F CFA)
|
2002
|
2003
|
2004
|
2005
|
|
Valeurs
|
%
|
Valeurs
|
%
|
Valeurs
|
%
|
Valeurs
|
%
|
|
Coton
|
97,2
|
50,86
|
119,9
|
58,63
|
163,2
|
60,04
|
146,9
|
54,07
|
|
Animaux vivants
|
34,9
|
18,26
|
23,2
|
11,34
|
27
|
9,93
|
36,3
|
13,36
|
|
Cuirs et peaux
|
18
|
9,42
|
18,6
|
9,10
|
22,6
|
8,31
|
22,9
|
8,43
|
|
Oléagineux
|
13,1
|
6,86
|
14,7
|
7,19
|
19,5
|
7,17
|
22,1
|
8,13
|
|
Or non monétaire
|
4,7
|
2,46
|
5,2
|
2,54
|
7
|
2,58
|
9,5
|
3,50
|
|
Fruits, légumes et céréales
|
2,5
|
1,31
|
1,3
|
0,64
|
1,5
|
0,55
|
1,7
|
0,63
|
|
Autres
|
20,7
|
10,83
|
21,6
|
10,56
|
31
|
11,41
|
32,3
|
11,89
|
|
Total
|
191,1
|
100,00
|
204,5
|
100,00
|
271,8
|
100,00
|
271,7
|
100,00
|
Source : Gouvernement du Burkina Faso, septembre 2007
Côte d'Ivoire (valeurs en millions de F
CFA)
|
2002
|
2003
|
2004
|
|
Exportations
|
Montant
|
%
|
Montant
|
%
|
Montant
|
%
|
|
Produits agricoles
|
1 408 449,40
|
81,36
|
1 176 158,80
|
67,15
|
908 252,80
|
53,13
|
|
Matières premières
|
74 049,90
|
4,28
|
88 504,10
|
5,05
|
59 091,30
|
3,46
|
|
Produits manufacturés
|
410,20
|
0,02
|
1 122,90
|
0,06
|
783,70
|
0,05
|
|
Autres produits industriels
|
248 306,00
|
14,34
|
485 678,00
|
27,73
|
741 322,20
|
43,37
|
|
Total
|
1 731 215,50
|
100,00
|
1 751 463,80
|
100,00
|
1 709 450,00
|
100,00
|
Source : Compilation de l'auteur
Mali (données en pourcentage)
|
2005
|
2006
|
2007
|
2008
|
2009
|
|
Coton
|
24,2
|
17,4
|
14,9
|
9,8
|
8,1
|
|
Or non monétaire
|
61,7
|
72,7
|
69,4
|
69
|
76,3
|
|
Animaux vivants
|
4,8
|
3,7
|
5,1
|
5,6
|
5
|
|
Autres
|
9,3
|
6,2
|
10,6
|
15,6
|
10,6
|
|
Total
|
100,0
|
100,0
|
100,0
|
100,0
|
100,0
|
Source : BCEAO, 2007
Niger (données en pourcentage)
|
2005
|
2006
|
2007
|
2008
|
2009
|
|
Uranium
|
2,10
|
2,00
|
2,40
|
1,70
|
2,30
|
|
Or
|
0,00
|
0,00
|
0,00
|
0,00
|
0,00
|
|
Produits d'élevage
|
23,40
|
30,80
|
27,10
|
33,30
|
46,20
|
|
Produits de l'agriculture
|
59,40
|
56,10
|
57,50
|
56,20
|
48,00
|
|
Autres produits
|
15,10
|
11,10
|
13,00
|
8,80
|
3,50
|
|
Total
|
100,00
|
100,00
|
100,00
|
100,00
|
100,00
|
Source : INS, 2010
Togo (données en pourcentage)
|
2000
|
2001
|
2002
|
2003
|
2004
|
|
Produits agricoles
|
43
|
29
|
39
|
33
|
36
|
|
Cacao
|
3
|
3
|
4
|
3
|
7
|
|
Autres produits alimentaires
|
17
|
16
|
20
|
13
|
17
|
|
Coton
|
23
|
10
|
15
|
17
|
12
|
|
Phosphate de calcium
|
24
|
20
|
17
|
9
|
11
|
|
Fer et acier
|
4
|
9
|
8
|
7
|
10
|
|
Ciments
|
13
|
28
|
25
|
28
|
28
|
|
Machines et matériel de transport
|
5
|
2
|
2
|
13
|
1
|
|
Autres
|
11
|
12
|
9
|
10
|
14
|
|
Total
|
100
|
100
|
100
|
100
|
100
|
Source : Estimations de l'auteur (à partir du graphique
I.1 du document WT/TPR/S/166, p.7)
61
Annexe 5 : Tests de stationnarité
|
PAYS
|
VARIA- BLES
|
Tests en niveau
|
Tests en différence
|
Décision
|
|
première
|
Seconde
|
|
ADF
|
PP
|
ADF
|
PP
|
ADF
|
PP
|
|
Burkin a Faso
|
LK
|
-1.284054
(-3.540328)
|
-2.990463
(-3.536601)
|
-2.837915
(-3.544284)
|
-6.419107*
(-3.540328)
|
|
|
LK est I(1)
|
|
LPIBAGR
|
-2.159988
(-3.540328)
|
-2.355972
(-3.536601)
|
-5.498985*
(-2.948404)
|
-8.811114*
(-3.540328)
|
|
|
LPIBAGR
est I(1)
|
|
LPIBIND
|
-0.380741
(-3.540328)
|
-0.846625
(-3.536601)
|
-4.730885*
(-3.544284)
|
-9.179390*
(-3.540328)
|
|
|
LPIBIND
est I(1)
|
|
LPIBRH
|
-0.849609
(-3.540328)
|
-1.212091
(-3.536601)
|
-6.425600*
(-3.544284)
|
-7.733439*
(-3.540328)
|
|
|
LPIBIRH
est I(1)
|
|
LPIBSER
|
-1.759846
(-3.540328)
|
-1.916384
(-3.536601)
|
-3.520455
(-3.544284)
|
-6.409837*
(-3.540328)
|
|
|
LPIBSER
est I(1)
|
|
Bénin
|
LK
|
-2.832776
(-3.540328)
|
-2.364303
(-3.536601)
|
-1.892815
(-3.544284)
|
-2.642827
(-3.540328)
|
-5.318988*
(-3.548490)
|
-8.905842*
(-3.544284)
|
LK est I(2)
|
|
LPIBAGR
|
-3.109168
(-3.540328)
|
-2.970046
(-3.536601)
|
-4.573956*
(-3.544284)
|
-6.261691*
(-3.540328)
|
|
|
LPIBAGR
est I(1)
|
|
LPIBIND
|
-3.048784
(-3.540328)
|
-3.227246
(-3.536601)
|
-4.395197*
(-3.544284)
|
-6.548269*
(-3.540328)
|
|
|
LPIBIND
est I(1)
|
|
LPIBRH
|
-2.391268
(-3.540328)
|
-2.889574
(-3.536601)
|
-4.275241*
(-3.544284)
|
-7.048780*
(-3.540328)
|
|
|
LPIBIRH
est I(1)
|
|
LPIBSER
|
-3.688178
(-3.540328)
|
-3.344535
(-3.536601)
|
-4.497050*
(-3.544284)
|
-6.448710*
(-3.540328)
|
|
|
LPIBSER
est I(1)
|
|
Côte d'Ivoire
|
LK
|
-3.068268
(-3.540328)
|
-1.692413
(-3.536601)
|
-1.656286
(-3.544284)
|
-1.761754
(-3.540328)
|
-3.908947*
(-3.548490)
|
-5.505319*
(-3.544284)
|
LK est I(2)
|
|
LPIBAGR
|
-1.700301
(-3.540328)
|
-1.989242
(-3.536601)
|
-4.048819*
(-3.544284)
|
-7.312614*
(-3.540328)
|
|
|
LPIBAGR
est I(1)
|
|
LPIBIND
|
-2.906821
(-3.540328)
|
-3.012139
(-3.536601)
|
-4.463401*
(-3.544284)
|
-5.835232*
(-3.540328)
|
|
|
LPIBIND
est I(1)
|
|
LPIBRH
|
-2.218645
(-3.540328)
|
-2.257771
(-3.536601)
|
-4.479372*
(-3.544284)
|
-4.711955*
(-3.540328)
|
|
|
LPIBIRH
est I(1)
|
|
LPIBSER
|
-2.285411
(-3.540328)
|
-2.220103
(-3.536601)
|
-6.053770*
(-3.544284)
|
-6.134443*
(-3.540328)
|
|
|
LPIBSER
est I(1)
|
|
Mali
|
LK
|
-1.754410
(-3.540328)
|
-1.099988
(-3.536601)
|
-3.400143
(-3.544284)
|
-5.132386*
(-3.540328)
|
|
|
LK est I(1)
|
|
LPIBAGR
|
-2.695411
(-3.540328)
|
-2.865222
(-3.536601)
|
-5.035903*
(-3.544284)
|
-6.618637*
(-3.540328)
|
|
|
LPIBAGR
est I(1)
|
|
LPIBIND
|
-2.397197
(-3.540328)
|
-3.367316
(-3.536601)
|
-4.706440*
(-3.544284)
|
-6.727455*
(-3.540328)
|
|
|
LPIBIND
est I(1)
|
|
LPIBRH
|
-2.909446
(-3.540328)
|
-3.089329
(-3.536601)
|
-6.351792*
(-3.544284)
|
-7.488876*
(-3.540328)
|
|
|
LPIBIRH
est I(1)
|
|
LPIBSER
|
-4.209657*
(-3.540328)
|
-4.510885
(-3.536601)
|
-6.431963*
(-3.544284)
|
-7.713445*
(-3.540328)
|
|
|
LPIBSER
est I(0)
|
|
LK
|
-3.561205*
(-3.540328)
|
-1.812645
(-3.536601)
|
-2.044825
(-3.544284)
|
-1.671938
(-3.540328)
|
|
|
LK est I(0)
|
|
LPIBAGR
|
-3.916918*
(-3.540328)
|
-3.119212
(-3.536601)
|
-6.156922*
(-3.544284)
|
-8.307219*
(-3.540328)
|
|
|
LPIBAGR
est I(0)
|
62
Niger
|
LPIBIND
|
-1.925615
(-3.540328)
|
-2.232991
(-3.536601)
|
-3.110896
(-3.544284)
|
-5.940419*
(-3.540328)
|
|
|
LPIBIND
est I(1)
|
|
LPIBRH
|
-1.666129
(-3.540328)
|
-1.473159
(-3.536601)
|
-4.518884*
(-3.544284)
|
-6.129250*
(-3.540328)
|
|
|
LPIBIRH
est I(1)
|
|
LPIBSER
|
-2.752048
(-3.540328)
|
-2.768026
(-3.536601)
|
-4.827803*
(-3.544284)
|
-6.066536*
(-3.540328)
|
|
|
LPIBSER
est I(1)
|
|
|
-0.719611
|
-0.310634
|
-1.823024
|
-1.407041
|
-5.280931*
|
-7.788633*
|
|
|
LK
|
(-3.540328)
|
(-3.536601)
|
(-3.544284)
|
(-4.234972)
|
(-3.548490)
|
(-3.544284)
|
LK est I(2)
|
|
|
-3.702585*
|
-5.311755*
|
-5.944702*
|
-11.37968*
|
|
|
|
|
LPIBAGR
|
(-3.540328)
|
(-3.536601)
|
(-3.544284)
|
(-3.540328)
|
|
|
LPIBAGR
est I(0)
|
|
|
-2.909031
|
-3.730700*
|
-5.108489*
|
-8.248725*
|
|
|
|
|
LPIBIND
|
(-3.540328)
|
(-3.536601)
|
(-3.544284)
|
(-3.540328)
|
|
|
LPIBIND
est I(0)
|
|
Sénégal
|
LPIBRH
|
-1.576950
(-3.540328)
|
-1.847043
(-3.536601)
|
-6.723055*
(-3.544284)
|
-7.847096*
(-3.540328)
|
|
|
LPIBIRH
est I(1)
|
|
|
-0.566639
|
-0.042352
|
-5.937780*
|
-7.155972*
|
|
|
|
|
LPIBSER
|
(-3.540328)
|
(-3.536601)
|
(-3.544284)
|
(-3.540328)
|
|
|
LPIBSER
est I(1)
|
|
|
-3.458039
|
-2.067812
|
-2.072018
|
-2.050301
|
-3.540190
|
-4.359007*
|
|
|
LK
|
(-3.540328)
|
(-3.536601)
|
(-2.948404)
|
(-3.540328)
|
(-3.548490)
|
(-3.544284)
|
LK est I(2)
|
|
|
-4.017421*
|
-3.495937
|
-4.884797*
|
-6.141382*
|
|
|
|
|
LPIBAGR
|
(-3.540328)
|
(-3.536601)
|
(-2.948404)
|
(-3.540328)
|
|
|
LPIBAGR
est I(0)
|
|
|
-4.257027*
|
-4.079894*
|
-5.744414*
|
-8.181287*
|
|
|
|
|
LPIBIND
|
(-3.540328)
|
(-3.536601)
|
(-2.948404)
|
(-3.540328)
|
|
|
LPIBIND
est I(0)
|
|
|
-3.771934*
|
-3.161175
|
-4.344511*
|
-5.400451*
|
|
|
|
|
Togo
|
LPIBRH
|
(-3.540328)
|
(-3.536601)
|
(-2.948404)
|
(-3.540328)
|
|
|
LPIBIRH
est I(0)
|
|
|
-2.357694
|
-2.758901
|
-4.884728*
|
-7.420765*
|
|
|
|
|
LPIBSER
|
(-3.540328)
|
(-3.536601)
|
(-2.948404)
|
(-3.540328)
|
|
|
LPIBSER
est I(1)
|
|
Note : (*) indique le rejet de l'hypothèse nulle
à 5%. Les nombres entre parenthèses correspondent aux valeurs
critiques à 5%.
|
63
Annexe 6 : Résultats des tests de cointégration par
pays
Burkina-Faso
|
Sample (adjusted): 1972 2007
|
|
|
|
Included observations: 36 afteradjustments
|
|
|
|
Trend assumption: No deterministic trend
|
|
|
|
Series: LPIBRH LK LPIBAGR LPIBIND LPIBSER
|
|
|
|
Lags interval (in first differences): 1 to 1
|
|
|
|
Unrestricted Cointegration Rank Test (Trace)
|
|
|
|
Hypothesized Trace
|
0.05
|
|
|
No. of CE(s) Eigenvalue Statistic
|
Critical Value
|
Prob.**
|
|
None * 0.835768 114.2468
|
60.06141
|
0.0000
|
|
Atmost 1 * 0.479036 49.21362
|
40.17493
|
0.0048
|
|
Atmost 2 * 0.341056 25.73897
|
24.27596
|
0.0325
|
|
Atmost 3 0.194977 10.72280
|
12.32090
|
0.0913
|
|
Atmost 4 0.077779 2.914942
|
4.129906
|
0.1038
|
|
Trace test indicates 3 cointegratingeqn(s) at the 0.05 level
|
|
|
|
* denotes rejection of the hypothesis at the 0.05 level
|
|
|
|
**MacKinnon-Haug-Michelis (1999) p-values
|
|
|
Bénin
|
Sample (adjusted): 1972 2007
|
|
|
|
Included observations: 36 afteradjustments
|
|
|
|
Trend assumption: No deterministic trend
|
|
|
|
Series: LPIBRH LK LPIBAGR LPIBIND LPIBSER
|
|
|
|
Lags interval (in first differences): 1 to 1
|
|
|
|
Unrestricted Cointegration Rank Test (Trace)
|
|
|
|
Hypothesized Trace
|
0.05
|
|
|
No. of CE(s) Eigenvalue Statistic
|
Critical Value
|
Prob.**
|
|
None * 0.718531 124.2036
|
60.06141
|
0.0000
|
|
Atmost 1 * 0.664345 78.56521
|
40.17493
|
0.0000
|
|
Atmost 2 * 0.468052 39.26508
|
24.27596
|
0.0003
|
|
Atmost 3 * 0.346013 16.54151
|
12.32090
|
0.0093
|
|
Atmost 4 0.034220 1.253488
|
4.129906
|
0.3069
|
|
Trace test indicates 4 cointegratingeqn(s) at the 0.05 level
|
|
|
|
* denotes rejection of the hypothesis at the 0.05 level
|
|
|
|
**MacKinnon-Haug-Michelis (1999) p-values
|
|
|
64
Côte d'Ivoire
|
Sample (adjusted): 1972 2007
|
|
|
|
Included observations: 36 afteradjustments
|
|
|
|
Trend assumption: No deterministic trend
|
|
|
|
Series: LPIBRH LK LPIBAGR LPIBIND LPIBSER
|
|
|
|
Lags interval (in first differences): 1 to 1
|
|
|
|
Unrestricted Cointegration Rank Test (Trace)
|
|
|
|
Hypothesized Trace
|
0.05
|
|
|
No. of CE(s) Eigenvalue Statistic
|
Critical Value
|
Prob.**
|
|
None * 0.613605 75.64729
|
60.06141
|
0.0014
|
|
Atmost 1 * 0.455861 41.41504
|
40.17493
|
0.0373
|
|
Atmost 2 0.266511 19.50724
|
24.27596
|
0.1777
|
|
Atmost 3 0.193322 8.349302
|
12.32090
|
0.2108
|
|
Atmost 4 0.016949 0.615398
|
4.129906
|
0.4938
|
|
Trace test indicates 2 cointegratingeqn(s) at the 0.05 level
|
|
|
|
* denotes rejection of the hypothesis at the 0.05 level
|
|
|
|
**MacKinnon-Haug-Michelis (1999) p-values
|
|
|
Mali
|
Sample (adjusted): 1972 2007
|
|
|
|
Included observations: 36 afteradjustments
|
|
|
|
Trend assumption: No deterministic trend
|
|
|
|
Series: LPIBRH LK LPIBAGR LPIBIND LPIBSER
|
|
|
|
Lags interval (in first differences): 1 to 1
|
|
|
|
Unrestricted Cointegration Rank Test (Trace)
|
|
|
|
Hypothesized Trace
|
0.05
|
|
|
No. of CE(s) Eigenvalue Statistic
|
Critical Value
|
Prob.**
|
|
None * 0.653380 90.10681
|
60.06141
|
0.0000
|
|
Atmost 1 * 0.509112 51.96386
|
40.17493
|
0.0022
|
|
Atmost 2 * 0.291504 26.34843
|
24.27596
|
0.0270
|
|
Atmost 3 * 0.253276 13.94245
|
12.32090
|
0.0265
|
|
Atmost 4 0.090837 3.428302
|
4.129906
|
0.0760
|
|
Trace test indicates 4 cointegratingeqn(s) at the 0.05 level
|
|
|
|
* denotes rejection of the hypothesis at the 0.05 level
|
|
|
|
**MacKinnon-Haug-Michelis (1999) p-values
|
|
|
Niger
|
Sample (adjusted): 1972 2007
|
|
|
|
Included observations: 36 afteradjustments
|
|
|
|
Trend assumption: No deterministic trend
|
|
|
|
Series: LPIBRH LK LPIBAGR LPIBIND LPIBSER
|
|
|
|
Lags interval (in first differences): 1 to 1
|
|
|
|
Unrestricted Cointegration Rank Test (Trace)
|
|
|
|
Hypothesized Trace
|
0.05
|
|
|
No. of CE(s) Eigenvalue Statistic
|
Critical Value
|
Prob.**
|
|
None * 0.649552 95.86880
|
60.06141
|
0.0000
|
|
Atmost 1 * 0.582094 58.12122
|
40.17493
|
0.0003
|
|
Atmost 2 * 0.361656 26.71130
|
24.27596
|
0.0242
|
|
Atmost 3 0.231638 10.55167
|
12.32090
|
0.0972
|
|
Atmost 4 0.029173 1.065862
|
4.129906
|
0.3509
|
|
Trace test indicates 3 cointegratingeqn(s) at the 0.05 level
|
|
|
|
* denotes rejection of the hypothesis at the 0.05 level
|
|
|
|
**MacKinnon-Haug-Michelis (1999) p-values
|
|
|
Sénégal
65
Sample (adjusted): 1972 2007
|
|
|
|
Included observations: 36 afteradjustments
|
|
|
|
Trend assumption: No deterministic trend
|
|
|
|
Series: LPIBRH LK LPIBAGR LPIBIND LPIBSER
|
|
|
|
Lags interval (in first differences): 1 to 1
|
|
|
|
Unrestricted Cointegration Rank Test (Trace)
|
|
|
|
Hypothesized Trace
|
0.05
|
|
|
No. of CE(s) Eigenvalue Statistic
|
Critical Value
|
Prob.**
|
|
None * 0.534845 67.19611
|
60.06141
|
0.0111
|
|
Atmost 1 0.438774 39.64227
|
40.17493
|
0.0565
|
|
Atmost 2 0.257606 18.84751
|
24.27596
|
0.2076
|
|
Atmost 3 0.179840 8.123989
|
12.32090
|
0.2272
|
|
Atmost 4 0.027038 0.986765
|
4.129906
|
0.3718
|
|
Trace test indicates 1 cointegratingeqn(s) at the 0.05 level
|
|
|
|
* denotes rejection of the hypothesis at the 0.05 level
|
|
|
|
**MacKinnon-Haug-Michelis (1999) p-values
|
|
|
Togo
66
|
Sample (adjusted): 1972 2007
|
|
|
|
Included observations: 36 afteradjustments
|
|
|
|
Trend assumption: No deterministic trend
|
|
|
|
Series: LPIBRH LK LPIBAGR LPIBIND LPIBSER
|
|
|
|
Lags interval (in first differences): 1 to 1
|
|
|
|
Unrestricted Cointegration Rank Test (Trace)
|
|
|
|
Hypothesized Trace
|
0.05
|
|
|
No. of CE(s) Eigenvalue Statistic
|
Critical Value
|
Prob.**
|
|
None * 0.532048 66.36833
|
60.06141
|
0.0133
|
|
Atmost 1 0.445204 39.03034
|
40.17493
|
0.0649
|
|
Atmost 2 0.312560 17.82078
|
24.27596
|
0.2616
|
|
Atmost 3 0.096404 4.328690
|
12.32090
|
0.6634
|
|
Atmost 4 0.018692 0.679267
|
4.129906
|
0.4694
|
|
Trace test indicates 1 cointegratingeqn(s) at the 0.05 level
|
|
|
|
* denotes rejection of the hypothesis at the 0.05 level
|
|
|
|
**MacKinnon-Haug-Michelis (1999) p-values
|
|
|
67
Annexe 7 : Résultats de l'estimation du MCE pour le
modèle 1
|
Bénin
|
Burkina- Faso
|
Côte
d'Ivoire
|
Mali
|
Niger
|
Sénégal
|
Togo
|
|
Coefficients de court terme
|
|
D(LK)
|
0.351379
(1.782867)
|
-0.793465
(-3.929095)
|
0.194230
(1.211765)
|
0.596421
(1.457446)
|
0.156396
(0.571849)
|
0.385904
(2.458100)
|
0.219287
(1.183487)
|
|
D(LPIBAGR)
|
0.378875
(11.22557)
|
0.333509
(5.483945)
|
0.061807
(1.044430)
|
0.341759
(6.309388)
|
0.320267
(6.457426)
|
0.190325
(15.69700)
|
0.283786
(5.304805)
|
|
D(LPIBIND)
|
0.085605
|
-0.020823
|
0.188561
|
0.107467
|
0.147156
|
0.241008
|
0.268459
|
|
(2.648244)
|
(-0.199271)
|
(3.449053)
|
(2.349319)
|
(2.448801)
|
(9.328978)
|
(6.702161)
|
|
D(LPIBSER)
|
0.464814
(8.665079)
|
0.513386
(5.532204)
|
0.380643
(3.508460)
|
0.192521
(2.530132)
|
0.374958
(6.394521)
|
0.542995
(16.94858)
|
0.175846
(4.140815)
|
|
Coefficients de long terme
|
|
LPIBRH(-1)
|
-0.338346
(-2.243412)
|
-0.338346
(-2.243412)
|
-0.473134
(-3.241470)
|
-0.132239
(-1.318283)
|
-0.089185
(-0.843924)
|
-0.562883
(-3.655985)
|
-0.319382
(-2.493225)
|
|
LK(-1)
|
-0.016234
(-0.346308)
|
-0.016234
(-0.346308)
|
-0.056046
(-1.603143)
|
-0.006490
(-0.092044)
|
-0.059199
(-1.336981)
|
0.066858
(1.736729)
|
0.013860
(0.461996)
|
|
LPIBAGR(-1)
|
0.136485
|
0.136485
|
0.029037
|
0.058698
|
-0.010596
|
0.100070
|
0.172525
|
|
(1.972585)
|
(1.972585)
|
(0.508812)
|
(1.201520)
|
(-0.148394)
|
(2.904766)
|
(2.452923)
|
|
LPIBIND(-1)
|
-0.013418
|
-0.013418
|
0.079135
|
0.067998
|
0.001297
|
0.129111
|
0.119736
|
|
(-0.285899)
|
(-0.285899)
|
(1.249402)
|
(1.456682)
|
(0.043655)
|
(3.327816)
|
(1.706857)
|
|
LPIBSER(-1)
|
0.201658
(2.743660)
|
0.201658
(2.743660)
|
0.314985
(2.149960)
|
-0.004696
(-0.045308)
|
0.065645
(1.093325)
|
0.315054
(3.214811)
|
-0.021436
(-0.457448)
|
|
0.30555
|
0.30555
|
0.886281
|
0.195209
|
0.522898
|
0.212540
|
0.563883
|
|
C
|
(2.552726)
|
(2.552726)
|
(2.246499)
|
(0.511261)
|
(0.810032)
|
(1.498386)
|
(1.145514)
|
|
R2 Ajusté
|
0.925461
|
0.925461
|
0.761956
|
0.705188
|
0.848583
|
0.985918
|
0.791710
|
|
F
|
50.66350
|
50.66350
|
13.80359
|
10.56798
|
23.41709
|
281.0537
|
16.20404
|
|
Prob(F)
|
0.000000
|
0.000000
|
0.000000
|
0.000001
|
0.000000
|
0.000000
|
0.000000
|
|
DW
|
1.444656
|
1.444656
|
1.930555
|
2.461656
|
2.295209
|
1.854654
|
2.052703
|
|
Les nombres entre parenthèses correspondent aux t de
student
|
68
Annexe 8 : Résultats de l'estimation du MCE pour le
modèle 2
|
Burkina-
Faso
|
Bénin
|
Côte
d'Ivoire
|
Mali
|
Niger
|
Sénégal
|
Togo
|
|
Coefficients de court terme
|
|
1.372465
|
-0.492424
|
-0.845980
|
-0.773000
|
-0.887522
|
-1.204144
|
-0.568314
|
|
D(LK)
|
(2.837829)
|
(-1.004941)
|
(-1.695829)
|
(-0.815080)
|
(-1.371418)
|
(-1.442596)
|
(-1.220319)
|
|
D(LPIBRH)
|
1.579949
(5.483945)
|
2.173657
(11.22557)
|
0.628283
(1.044430)
|
1.743509
(6.309388)
|
1.895223
(6.457426)
|
4.735268
(15.69700)
|
1.798350
(5.304805)
|
|
D(LPIBIND)
|
0.098473
(0.434149)
|
-0.194357
(-2.477773)
|
-0.294429
(-1.461989)
|
-0.284310
(-2.862711)
|
-0.486718
(-3.695980)
|
-1.015298
(-5.680096)
|
-0.597145
(-5.069349)
|
|
D(LPIBSER)
|
-0.775173
(-3.045489)
|
-1.119439
(-8.848868)
|
0.758168
(1.938855)
|
-0.250559
(-1.354559)
|
-0.570066
(-2.882036)
|
-2.616502
(-12.52083)
|
-0.271732
(-2.151529)
|
|
Coefficients de long terme
|
|
LPIBAGR(-1)
|
-0.601078
(-3.834508)
|
-0.180443
(-1.038017)
|
-0.470619
(-2.963477)
|
-0.249420
(-2.431486)
|
-0.289329
(-1.757708)
|
-0.548882
(-3.304032)
|
-0.517851
(-3.072746)
|
|
0.486188
|
0.130011
|
-0.074121
|
0.140928
|
-0.046443
|
-0.284953
|
-0.072819
|
|
LK(-1)
|
(3.599512)
|
(1.185003)
|
(-0.640234)
|
(0.897851)
|
(-0.418939)
|
(-1.462106)
|
(-0.977240)
|
|
LPIBRH(-1)
|
0.857387
(2.270752)
|
0.508597
(1.334532)
|
-0.326974
(-0.600087)
|
-0.030346
(-0.129864)
|
0.408927
(1.647098)
|
2.547346
(3.180738)
|
0.881234
(2.798390)
|
|
LPIBIND(-1)
|
0.411840
(1.575990)
|
0.111355
(1.007521)
|
0.029946
(0.144238)
|
-0.082299
(-0.759582)
|
-0.062440
(-0.875892)
|
-0.481721
(-2.290888)
|
-0.286275
(-1.612613)
|
|
LPIBSER(-1)
|
-0.965367
(-3.624988)
|
-0.433764
(-2.399983)
|
0.708997
(1.456590)
|
0.261254
(1.142657)
|
0.015621
(0.104681)
|
-1.520199
(-3.072381)
|
0.017018
(0.143770)
|
|
1.007239
|
-0.612151
|
0.845608
|
0.475364
|
-0.712109
|
-0.198807
|
-1.071911
|
|
C
|
(1.670749)
|
(-2.061730)
|
(0.621469)
|
(0.551641)
|
(-0.449742)
|
(-0.270355)
|
(-0.856130)
|
|
R2 Ajusté
|
0.482993
|
0.835763
|
0.337472
|
0.693870
|
0.757226
|
0.962764
|
0.552260
|
|
F
|
4.736845
|
21.35501
|
3.037478
|
10.06634
|
13.47621
|
104.4240
|
5.933755
|
|
Prob(F)
|
0.000776
|
0.000000
|
0.012148
|
0.000001
|
0.000000
|
0.000000
|
0.000143
|
|
DW
|
1.973759
|
1.519071
|
2.401058
|
2.227830
|
2.201991
|
1.887867
|
1.638255
|
|
Les nombres entre parenthèses correspondent aux t de
student
|
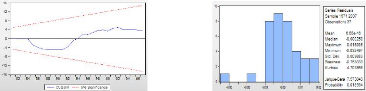
Annexe 9 : Tests de spécification sur le MCE
Modèle 1
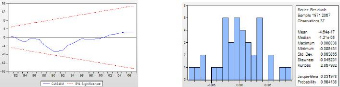
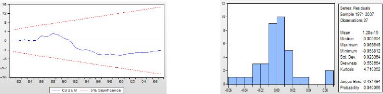
Bénin
Breusch-Godfrey Serial Correlation LM Test:
F-statistic 3.361666 Prob. F(2,25) 0.0509
Obs*R-squared 7.841650 Prob. Chi-Square(2) 0.0198
Heteroskedasticity Test: ARCH
F-statistic 4.522738 Prob. F(3,30) 0.0099
Obs*R-squared 10.58844 Prob. Chi-Square(3) 0.0142
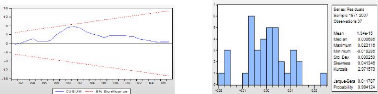
Test de CUSUM Test de Jarque-Bera
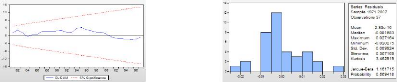
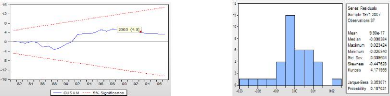
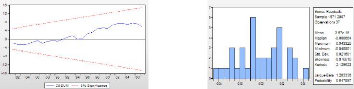
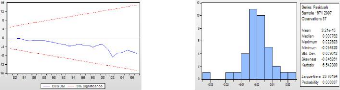
Burkina-Faso
Breusch-Godfrey Serial Correlation LM Test:
F-statistic 0.859075 Prob. F(2,25) 0.4357
Obs*R-squared 2.379339 Prob. Chi-Square(2) 0.3043
Heteroskedasticity Test: ARCH
F-statistic 0.196611 Prob. F(3,30) 0.8979
Obs*R-squared 0.655588 Prob. Chi-Square(3) 0.8836
Tests de CUSUM Test de Jarque-Bera
69
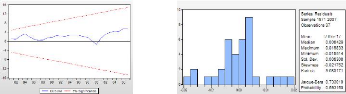
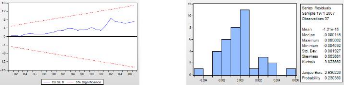
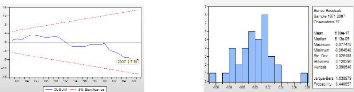
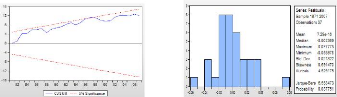
Côte d'Ivoire
Breusch-Godfrey Serial Correlation LM Test:
F-statistic 0.300186 Prob. F(2,25) 0.7433
Obs*R-squared 0.867713 Prob. Chi-Square(2) 0.6480
Heteroskedasticity Test: ARCH
F-statistic 0.101778 Prob. F(3,30) 0.9584
Obs*R-squared 0.342559 Prob. Chi-Square(3) 0.9518
Tests de CUSUM Test de Jarque-Bera
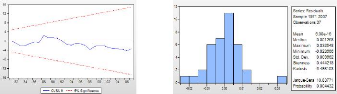
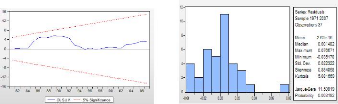
Mali
|
Heteroskedasticity Test: ARCH
|
|
|
|
|
F-statistic Obs*R-squared
|
0.628485
2.010493
|
Prob. F(3,30)
Prob. Chi-Square(3)
|
0.6023
0.5702
|
|
|
|
|
|
Breusch-Godfrey Serial Correlation LM Test:
|
|
|
|
F-statistic Obs*R-squared
|
1.190254
3.216842
|
Prob. F(2,25)
Prob. Chi-Square(2)
|
0.3208
0.2002
|
Tests de CUSUM Test de Jarque-Bera
70
Niger
Breusch-Godfrey Serial Correlation LM Test:
F-statistic 0.469177 Prob. F(2,25) 0.6309
Obs*R-squared 1.338523 Prob. Chi-Square(2) 0.5121
Heteroskedasticity Test: ARCH
F-statistic 0.309678 Prob. F(3,30) 0.8182
Obs*R-squared 1.021279 Prob. Chi-Square(3) 0.7961
Tests de CUSUM Test de Jarque-Bera
Sénégal
Breusch-Godfrey Serial Correlation LM Test:
F-statistic 1.706134 Prob. F(2,25) 0.2020
Obs*R-squared 4.443641 Prob. Chi-Square(2) 0.1084
Heteroskedasticity Test: ARCH
F-statistic 0.613939 Prob. F(3,30) 0.6113
Obs*R-squared 1.966653 Prob. Chi-Square(3) 0.5794
Tests de CUSUM Test de Jarque-Bera
71
Togo
Breusch-Godfrey Serial Correlation LM Test:
F-statistic 0.124528 Prob. F(2,25) 0.8835
Obs*R-squared 0.364967 Prob. Chi-Square(2) 0.8332
Heteroskedasticity Test: ARCH
F-statistic 0.255271 Prob. F(3,30) 0.8570
Obs*R-squared 0.846319 Prob. Chi-Square(3) 0.8384
Tests de CUSUM Test de Jarque-Bera
|
Bénin
|
|
Modèle 2
|
|
|
|
Heteroskedasticity Test: ARCH
|
|
|
|
|
F-statistic Obs*R-squared
|
4.612835
10.73278
|
Prob. F(3,30)
Prob. Chi-Square(3)
|
0.0091
0.0133
|
|
|
|
|
|
Breusch-Godfrey Serial Correlation LM Test:
|
|
|
|
F-statistic Obs*R-squared
|
1.716371
4.467085
|
Prob. F(2,25)
Prob. Chi-Square(2)
|
0.2002
0.1071
|
Tests de CUSUM Test de Jarque-Bera
72
Burkina-Faso
Heteroskedasticity Test: ARCH
F-statistic 0.832781 Prob. F(3,30) 0.4864
Obs*R-squared 2.613784 Prob. Chi-Square(3) 0.4551
Breusch-Godfrey Serial Correlation LM Test:
F-statistic 0.669567 Prob. F(2,25) 0.5209
Obs*R-squared 1.881152 Prob. Chi-Square(2) 0.3904
Test de CUSUM Test de Jarque-Bera
Côte d'Ivoire
Breusch-Godfrey Serial Correlation LM Test:
F-statistic 1.921315 Prob. F(2,25) 0.1674
Obs*R-squared 4.929416 Prob. Chi-Square(2) 0.0850
Heteroskedasticity Test: ARCH
F-statistic 0.42376 Prob. F(3,30)
Obs*R-squared 1.382234 Prob. Chi-Square(3)
Test de CUSUM Test de Jarque-Bera
73
Mali
Breusch-Godfrey Serial Correlation LM Test:
F-statistic 0.454570 Prob. F(2,25) 0.6399
Obs*R-squared 1.298312 Prob. Chi-Square(2) 0.5225
Heteroskedasticity Test: ARCH
F-statistic 0.056307 Prob. F(3,30) 0.9821
Obs*R-squared 0.190372 Prob. Chi-Square(3) 0.9791
Tests de CUSUM Test de Jarque-Bera
Niger
Breusch-Godfrey Serial Correlation LM Test:
F-statistic 0.369606 Prob. F(2,25) 0.6947
Obs*R-squared 1.062614 Prob. Chi-Square(2) 0.5878
Heteroskedasticity Test: ARCH
F-statistic 0.605901 Prob. F(3,30) 0.6163
Obs*R-squared 1.942376 Prob. Chi-Square(3) 0.5845
Tests de CUSUM Test de Jarque-Bera
74
Sénégal
Breusch-Godfrey Serial Correlation LM Test:
|
F-statistic Obs*R-squared
|
2.457419
6.078889
|
Prob. F(2,25)
Prob. Chi-Square(2)
|
0.1061
0.0479
|
Test de Jarque-Bera
|
|
|
|
|
|
Heteroskedasticity Test: ARCH
|
|
|
|
F-statistic Obs*R-squared
|
1.031013
3.177807
|
Prob. F(3,30)
Prob. Chi-Square(3)
|
0.3929
0.3650
|
|
Tests de CUSUM
|
|
|
Togo
Breusch-Godfrey Serial Correlation LM Test:
F-statistic 1.493098 Prob. F(2,25) 0.2440
Obs*R-squared 3.947991 Prob. Chi-Square(2) 0.1389
Heteroskedasticity Test: ARCH
F-statistic 0.589715 Prob. F(3,30) 0.6265
Obs*R-squared 1.893376 Prob. Chi-Square(3) 0.5948
Tests de CUSUM Test de Jarque Bera
75
|
|

