ANNEXES
Graphique 1 : évolution du taux
d'inflation de 1998 à 2012.
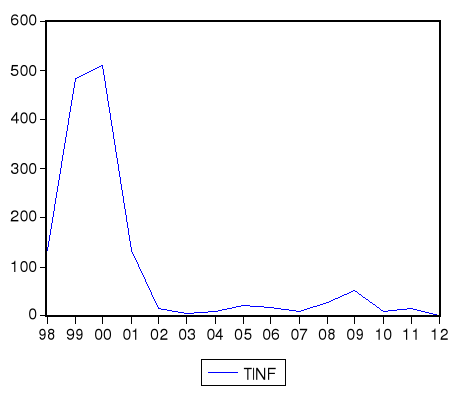
Source : nous même à partir du
logiciel Eviews5.
|
Null Hypothesis: TINF has a unit root
|
|
|
Exogenous: None
|
|
|
|
Lag Length: 1 (Automatic based on SIC, MAXLAG=1)
|
|
|
|
|
|
|
|
|
|
|
|
|
|
t-Statistic
|
Prob.*
|
|
|
|
|
|
|
|
|
|
|
|
Augmented Dickey-Fuller test statistic
|
-4.813138
|
0.0002
|
|
Test critical values:
|
1% level
|
|
-2.754993
|
|
|
5% level
|
|
-1.970978
|
|
|
10% level
|
|
-1.603693
|
|
|
|
|
|
|
|
|
|
|
|
|
*MacKinnon (1996) one-sided p-values.
|
|
|
Warning: Probabilities and critical values calculated for
20
|
|
observations
and may not be accurate for a sample size of 13
|
|
|
|
|
|
|
|
|
|
|
|
Augmented Dickey-Fuller Test Equation
|
|
|
Dependent Variable: D(TINF)
|
|
|
|
Method: Least Squares
|
|
|
|
Date: 07/06/14 Time: 16:59
|
|
|
|
Sample (adjusted): 2000 2012
|
|
|
|
Included observations: 13 afteradjustments
|
|
|
|
|
|
|
|
|
|
|
|
|
Variable
|
Coefficient
|
Std. Error
|
t-Statistic
|
Prob.
|
|
|
|
|
|
|
|
|
|
|
|
TINF(-1)
|
-0.476293
|
0.098957
|
-4.813138
|
0.0005
|
|
D(TINF(-1))
|
0.380509
|
0.134339
|
2.832458
|
0.0163
|
|
|
|
|
|
|
|
|
|
|
|
R-squared
|
0.653550
|
Meandependent var
|
-37.00000
|
|
Adjusted R-squared
|
0.622054
|
S.D. dependent var
|
108.8204
|
|
S.E. of regression
|
66.89983
|
Akaike info criterion
|
11.38491
|
|
Sumsquaredresid
|
49231.47
|
Schwarz criterion
|
11.47182
|
|
Log likelihood
|
-72.00190
|
Durbin-Watson stat
|
2.085231
|
|
|
|
|
|
|
|
|
|
|
Graphique 2 : Evolution du taux de change de 1998
à 2012
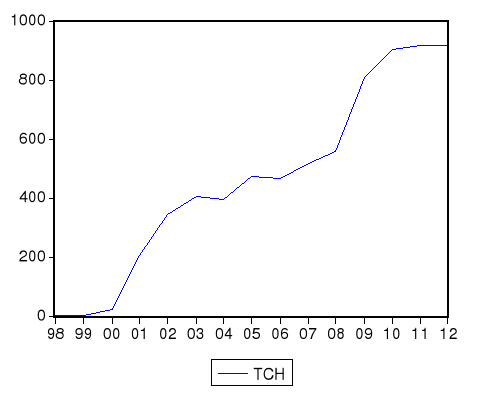
Source : nous même à partir du
logiciel Eviews5.
|
Null Hypothesis: D(TCH) has a unit root
|
|
|
Exogenous: None
|
|
|
|
Lag Length: 0 (Automatic based on SIC, MAXLAG=1)
|
|
|
|
|
|
|
|
|
|
|
|
|
|
t-Statistic
|
Prob.*
|
|
|
|
|
|
|
|
|
|
|
|
Augmented Dickey-Fuller test statistic
|
-1.917575
|
0.0555
|
|
Test critical values:
|
1% level
|
|
-2.754993
|
|
|
5% level
|
|
-1.970978
|
|
|
10% level
|
|
-1.603693
|
|
|
|
|
|
|
|
|
|
|
|
|
*MacKinnon (1996) one-sided p-values.
|
|
|
Warning: Probabilities and critical values calculated for
20
|
|
observations
and may not be accurate for a sample size of 13
|
|
|
|
|
|
|
|
|
|
|
|
Augmented Dickey-Fuller Test Equation
|
|
|
Dependent Variable: D(TCH,2)
|
|
|
|
Method: Least Squares
|
|
|
|
Date: 07/06/14 Time: 17:01
|
|
|
|
Sample (adjusted): 2000 2012
|
|
|
|
Included observations: 13 afteradjustments
|
|
|
|
|
|
|
|
|
|
|
|
|
Variable
|
Coefficient
|
Std. Error
|
t-Statistic
|
Prob.
|
|
|
|
|
|
|
|
|
|
|
|
D(TCH(-1))
|
-0.469083
|
0.244623
|
-1.917575
|
0.0793
|
|
|
|
|
|
|
|
|
|
|
|
R-squared
|
0.234550
|
Meandependent var
|
-0.164615
|
|
Adjusted R-squared
|
0.234550
|
S.D. dependent var
|
104.4254
|
|
S.E. of regression
|
91.36174
|
Akaike info criterion
|
11.94133
|
|
Sumsquaredresid
|
100163.6
|
Schwarz criterion
|
11.98479
|
|
Log likelihood
|
-76.61867
|
Durbin-Watson stat
|
2.009034
|
|
|
|
|
|
|
|
|
|
|
Graphique 3 : Evolution de la masse
monétaire de 1998 à 2012
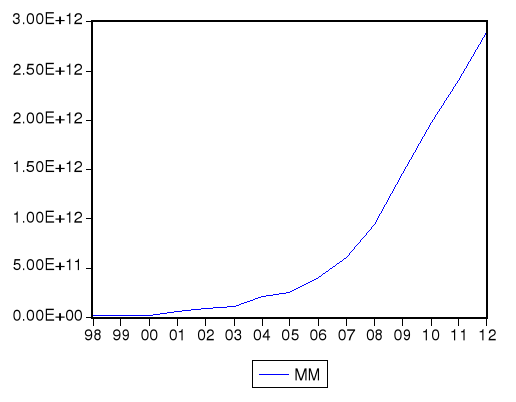
Source : nous même à partir du
logiciel Eviews5.
|
Null Hypothesis: D(MM) has a unit root
|
|
|
Exogenous: Constant, Linear Trend
|
|
|
Lag Length: 0 (Automatic based on SIC, MAXLAG=1)
|
|
|
|
|
|
|
|
|
|
|
|
|
|
t-Statistic
|
Prob.*
|
|
|
|
|
|
|
|
|
|
|
|
Augmented Dickey-Fuller test statistic
|
-1.915586
|
0.5900
|
|
Test critical values:
|
1% level
|
|
-4.886426
|
|
|
5% level
|
|
-3.828975
|
|
|
10% level
|
|
-3.362984
|
|
|
|
|
|
|
|
|
|
|
|
|
*MacKinnon (1996) one-sided p-values.
|
|
|
Warning: Probabilities and critical values calculated for
20
|
|
observations
and may not be accurate for a sample size of 13
|
|
|
|
|
|
|
|
|
|
|
|
Augmented Dickey-Fuller Test Equation
|
|
|
Dependent Variable: D(MM,2)
|
|
|
|
Method: Least Squares
|
|
|
|
Date: 07/06/14 Time: 17:03
|
|
|
|
Sample (adjusted): 2000 2012
|
|
|
|
Included observations: 13 afteradjustments
|
|
|
|
|
|
|
|
|
|
|
|
|
Variable
|
Coefficient
|
Std. Error
|
t-Statistic
|
Prob.
|
|
|
|
|
|
|
|
|
|
|
|
D(MM(-1))
|
-0.457834
|
0.239005
|
-1.915586
|
0.0844
|
|
C
|
-7.28E+10
|
6.36E+10
|
-1.145441
|
0.2787
|
|
@TREND(1998)
|
2.43E+10
|
1.21E+10
|
2.006717
|
0.0726
|
|
|
|
|
|
|
|
|
|
|
|
R-squared
|
0.290042
|
Meandependent var
|
3.80E+10
|
|
Adjusted R-squared
|
0.148050
|
S.D. dependent var
|
7.63E+10
|
|
S.E. of regression
|
7.04E+10
|
Akaike info criterion
|
52.99198
|
|
Sumsquaredresid
|
4.96E+22
|
Schwarz criterion
|
53.12235
|
|
Log likelihood
|
-341.4479
|
F-statistic
|
2.042668
|
|
Durbin-Watson stat
|
1.675334
|
Prob(F-statistic)
|
0.180370
|
|
|
|
|
|
|
|
|
|
|
| 

