ANNEXE 4 :
Annexe 4 : quelques photos lors de la
réalisation de l'enquête

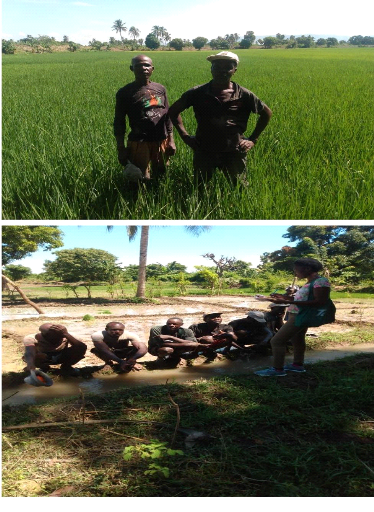
L'enquêteur (trice) parle avec les enquêtés
55
ANNEXE 5:
Annexe 5 : Presentation de l'analyse de variance entre le
rendement et les doses des fertilisants appliquées
56
Analysis of Variance Table
Response: Azote
Df Sum Sq Mean Sq F value Pr(>F)
Anne 1 592352 592352 63.707 6.653e-15 ***
Residuals 643 5978677 9298
Signif. codes : 0 `***' 0.001 `**' 0.01 `*' 0.05 `.' 0.1 ` ' 1
> LSD.test(MAzote,"Anne", group = T, main = "NULL", alpha =
0,01, console = T )
> library(agricolae)
> LSD.test(MAzote,"Anne", group = T, main = "NULL", alpha =
0,01, console = T )
Study: NULL
|
LSD t Test for Azote
Mean Square Error: 9298.098
Anne, means and individual
|
( 100
|
%)
|
CI
|
|
|
Azote
|
std
|
r
|
LCL
|
UCL
|
Min
|
Max
|
|
2017
|
176.9121
|
88.42193
|
134
|
-Inf
|
Inf
|
0
|
486.8691
|
|
2018
|
176.2827
|
141.70852
|
134
|
-Inf
|
Inf
|
0
|
1515.0705
|
|
2019
|
108.8902
|
75.12255
|
187
|
-Inf
|
Inf
|
0
|
367.8420
|
|
2020
|
107.5419
|
75.51957
|
190
|
-Inf
|
Inf
|
0
|
363.6169
|
Alpha: 0 ; DF Error: 643 Critical Value of t: Inf
Groups according to probability of means differences and alpha
level( 0 ) Treatments with the same letter are not significantly different.
Azote groups
2017 176.9121 a
2018 176.2827 a
2019 108.8902 b
2020 107.5419 b
> duncan.test(MAzote,"Anne", group = T, main = "NULL", alpha =
0,01, console = T)
Study: NULL
Duncan's new multiple range test for Azote
Mean Square Error: 9298.098 Anne, means
|
Azote
|
std
|
r Min
|
Max
|
|
2017
|
176.9121
|
88.42193
|
134
|
0
|
486.8691
|
|
2018
|
176.2827
|
141.70852
|
134
|
0
|
1515.0705
|
|
2019
|
108.8902
|
75.12255
|
187
|
0
|
367.8420
|
|
2020
|
107.5419
|
75.51957
|
190
|
0
|
363.6169
|
Groups according to probability of means differences and alpha
level( 0 ) Means with the same letter are not significantly different.
Azote groups
2017 176.9121 a
57
2018 176.2827 a
2019 108.8902 b
2020 107.5419 b
> Mphosphore = aov(Phosphore~ Anne, data = Manouchedata) >
anova(Mphosphore)
Analysis of Variance Table
Response: Phosphore
Df Sum Sq Mean Sq F value Pr(>F)
Anne 1 1956 1955.8 0.6654 0.4149
Residuals 791 2325110 2939.5
> LSD.test(Mphosphore,"Anne", group = T, main = "NULL", alpha
= 0,01, console = T)
Study: NULL
LSD t Test for Phosphore
Mean Square Error: 2939.457
Anne, means and individual ( 100 %) CI
Phosphore std r LCL UCL Min Max
2017 55.96056 55.94133 199 -Inf Inf 0 422.833
2018 55.99598 54.52703 199 -Inf Inf 0 422.833
2019 54.31937 54.64098 197 -Inf Inf 0 422.833
2020 51.83833 51.93137 198 -Inf Inf 0 422.833
Alpha: 0 ; DF Error: 791 Critical Value of t: Inf
Groups according to probability of means differences and alpha
level( 0 ) Treatments with the same letter are not significantly different.
Phosphore groups
2018 55.99598 a
2017 55.96056 a
2019 54.31937 a
2020 51.83833 a
> MPotassium = aov(Potassium ~ Anne, data = Manouchedata) >
anova(MPotassium )
Analysis of Variance Table
Response: Potassium
Df Sum Sq Mean Sq F value Pr(>F)
Anne 1 489 488.94 0.6654 0.4149
Residuals 791 581278 734.86
> LSD.test(MPotassium ,"Anne", group = T, main = "NULL", alpha
= 0,01, consol e = T)
Study: NULL
LSD t Test for Potassium
Mean Square Error: 734.8642
Anne, means and individual ( 100 %) CI
Potassium std r LCL UCL Min Max
2017 27.98028 27.97066 199 -Inf Inf 0 211.4165
2018 27.99799 27.26351 199 -Inf Inf 0 211.4165
2019 27.15969 27.32049 197 -Inf Inf 0 211.4165
2020 25.91916 25.96569 198 -Inf Inf 0 211.4165
58
Alpha: 0 ; DF Error: 791 Critical Value of t: Inf
Groups according to probability of means differences and alpha
level( 0 ) Treatments with the same letter are not significantly different.
Potassium groups
2018 27.99799 a
2017 27.98028 a
2019 27.15969 a
2020 25.91916 a
> duncan.test(MPotassium ,"Anne", group = T, main = "NULL",
alpha = 0,01, con sole = T)
Study: NULL
Duncan's new multiple range test for Potassium
Mean Square Error: 734.8642 Anne, means
Potassium std r Min Max
2017 27.98028 27.97066 199 0 211.4165
2018 27.99799 27.26351 199 0 211.4165
2019 27.15969 27.32049 197 0 211.4165
2020 25.91916 25.96569 198 0 211.4165
Groups according to probability of means differences and alpha
level( 0 ) Means with the same letter are not significantly different.
Potassium groups
2018 27.99799 a
2017 27.98028 a
2019 27.15969 a
2020 25.91916 a
> MRendement = aov(Rendement ~ Anne, data = Manouchedata) >
anova(MRendement )
Analysis of Variance Table
Response: Rendement
Df Sum Sq Mean Sq F value Pr(>F)
Anne 1 1.8239e+08 182392880 0.3662 0.5453
Residuals 666 3.3172e+11 498082238
> LSD.test(MRendement ,"Anne", group = T, main = "NULL", alpha
= 0,01, consol e = T)
Study: NULL
LSD t Test for Rendement
Mean Square Error: 498082238
Anne, means and individual ( 100 %) CI
Rendement std r LCL UCL Min Max
2017 6707.671 18274.11 167 -Inf Inf 0 162790.7
2018 7310.651 21128.62 167 -Inf Inf 0 198604.7
2019 7895.014 24297.29 167 -Inf Inf 0 224651.2
2020 8070.783 25051.08 167 -Inf Inf 0 249069.8
59
Alpha: 0 ; DF Error: 666 Critical Value of t: Inf
least Significant Difference: Inf
Treatments with the same letter are not significantly
different.
Rendement groups
2020 8070.783 a
2019 7895.014 a
2018 7310.651 a
2017 6707.671 a
> duncan.test(MRendement ,"Anne", group = T, main = "NULL",
alpha = 0,01, con sole = T)
Study: NULL
Duncan's new multiple range test for Rendement
Mean Square Error: 498082238 Anne, means
Rendement std r Min Max
|
2017
|
6707.671
|
18274.11
|
167
|
0
|
162790.7
|
|
2018
|
7310.651
|
21128.62
|
167
|
0
|
198604.7
|
|
2019
|
7895.014
|
24297.29
|
167
|
0
|
224651.2
|
|
2020
|
8070.783
|
25051.08
|
167
|
0
|
249069.8
|
Alpha: 0 ; DF Error: 666
Critical Range
2 3 4 Inf Inf Inf
Means with the same letter are not significantly different.
Rendement groups
2020 8070.783 a
2019 7895.014 a
2018 7310.651 a
2017 6707.671 a
> MRendement = aov(Rendement ~ Anne, data = Manouchedata) >
anova(MRendement )
Analysis of Variance Table
Response: Rendement
Df Sum Sq Mean Sq F value Pr(>F)
Anne 1 1.8239e+08 182392880 0.3662 0.5453
Residuals 666 3.3172e+11 498082238 >
shapiro.test(Rendement)
Shapiro-Wilk normality test
data: Rendement
W = 0.20617, p-value < 2.2e-16
> kruskal.test(Rendement ~ Anne, data = Manouchedata)
Kruskal-Wallis rank sum test
data: Rendement by Anne
60
Kruskal-Wallis chi-squared = 4.4794, df = 3, p-value = 0.2141
> shapiro.test(Phosphore)
Shapiro-Wilk normality test
data: Phosphore
W = 0.70749, p-value < 2.2e-16
> shapiro.test(Potassium)
Shapiro-Wilk normality test
data: Potassium
W = 0.70749, p-value < 2.2e-16
> kruskal.test(Potassium ~ Anne, data = Manouchedata)
Kruskal-Wallis rank sum test
data: Potassium by Anne
Kruskal-Wallis chi-squared = 0.77967, df = 3, p-value = 0.8543
> shapiro.test(Concentration) Shapiro-Wilk normality test
data: Concentration
W = 0.75369, p-value = 3.763e-08
> kruskal.test(Concentration ~ position, data = concentration)
Kruskal-Wallis rank sum test
data: Concentration by position
Kruskal-Wallis chi-squared = 19.382, df = 2, p-value =
6.184e-05
> MConcentration = aov(Concentration ~ position, data =
concentration) > anova(MConcentration)
Analysis of Variance Table
Response: Concentration
Df Sum Sq Mean Sq F value Pr(>F)
position 2 176.18 88.089 14.715 9.013e-06 ***
Residuals 51 305.30 5.986
---
Signif. codes: 0 `***' 0.001 `**' 0.01 `*' 0.05 `.' 0.1 ` ' 1
> LSD.test(MConcentration ,"position", group = T, main =
"NULL", alpha = 0,01
, console = T)
Study: NULL
LSD t Test for Concentration Mean Square Error: 5.986334
|
position, means and individual ( 100 %) CI
Concentration std r LCL UCL Min Max
|
|
am
|
10.00000 0.000000
|
9 -Inf Inf
|
10
|
10
|
|
av
|
15.83333 3.588703
|
12
|
-Inf Inf
|
10
|
20
|
|
ri
|
13.63636 2.261335
|
33
|
-Inf Inf
|
10
|
15
|
|
Alpha:
|
0 ; DF Error: 51
|
|
|
|
|
61
Critical Value of t: Inf
Groups according to probability of means differences and alpha
level( 0 ) Treatments with the same letter are not significantly different.
Concentration groups
av 15.83333 a
ri 13.63636 ab
am 10.00000 b
> pairwise.wilcox.test(concentration$Concentration,
concentration$position, p .adjust.method = "BH")
Pairwise comparisons using Wilcoxon rank sum test data:
concentration$Concentration and concentration$position
am av
av 0.00076 -
ri 0.00036 0.03413
| 

