|

Financial Development and Economic Growth:
Evidence
from Niger

Abstract
The relationship between financial development and economic
growth is a controversial issue. For developing countries, empirical studies
have provided mixed results. This study seeks to explore the relationship
between financial development and economic growth in Niger from 1970 to 2010.
We used two variables to proxy financial development namely; credit to the
private sector to GDP denoted by CP and financial deepening denoted by FD. The
economic growth is proxied by real GDP. In order to check this relationship a
Vector Error Correction Model was carried out. Unit root test was conducted for
stationarity, and all the series were found to be nonstationary at level.
However their first differences were stationary at the same order.
Additionally, Cointegration test was carried out, revealing that there was long
run equilibrium relationship among the variables and economic growth. In case
of the long run, financial deepening (FD) had positive impact on GDP however,
credit to the private sector to GDP was found to hinder economic growth.
Consequently, the authority in Niger should enact laws and policies to
establish a central credit bureau linking all banks to limit defaults on loan
payments. They should also build stronger and more diversified financial and
banking sector by continuing with the liberalization policy so as to create
competition among the banks. Finally, the populace should be sensitized and
educated on the security of the banks against collapse in order to create
confidence in citizens about the sustainability of the banking sector.
Keys Words: Financial Development; Economic
Growth; Niger, Credit to private sector, Africa.

Table of Contents
Chapter 1 Introduction 1
1.1. Motivation 3
1.2. Scope of the Study 3
1.3 Brief overview of economic growth and financial
sector Development in
Niger 3
1.3.1 Economic Growth 3
1.3.2 Financial Sector Development 4
1.4 Disposition 5
Chapter 2 Literature Review 6
2.1 Financial development: a factor for economic growth
6
2.2 Financial development: a less factor for economic
growth 8
2.3 Financial liberalization and economic growth in the
WAEMU countries 8
Chapter 3 Empirical Analysis 10
3.1 Data and Description of Variables 10
3.1.1 Data 10
3.1.2 Economic Growth Indicator 10
3.1.2 Financial Development Indicators 10
3.2 Unit root Test 14
3.2.1 ADF test 15
3.2.2 Test Results 16
3.3 Empirical results 16
3.3.1. Vector Autoregression (VAR) Lag Length
17
3.3.2. Cointegration Test 17
3.3.3. Cointegration results 18
3.3.4. Vector Error Correction Model (VECM)
19
Chapter 4 Conclusion and Policy Implications
23
4.1. Conclusion 23
4.2. Policy Implications 23
References 25
Appendix 28
Acknowledgment 33
Table of Figures
Figure 3.1: Trend of individual variables GDP, FD, and CP in log
level 12
Figure 3.2: Log first differences of individual variables 13
List of Tables
Table 3.1 Descriptive statistic of the variables 14
Table 3.2 Descriptive statistic of the first difference of the
Variables 14
Table 3.3 Unit root test of level 16
Table 3.4 Unit root test of first difference 16
Table 3.5 VAR lag order selection criteria 17
Table 3.7 Vector error correction estimates 20
Chapter 1 Introduction
Niger's economic growth in the past decades has been
relatively modest and was below the population growth rate, in the early 1960s
through to the late 1970s economic growth was weakened by series of droughts
that adversely affected the agricultural sector (accounting 40 percent of Niger
GDP). From 1979 to 1982, economic growth was strengthened due to the world
demand for uranium (Niger's main export product). This improved the terms of
trade and raised export revenues base of the country. However, this strong
growth was short lived due to the collapse of the global uranium price in the
early 1980s, causing and accelerating prolonged recession. Although the 1994
devaluation of the CFA1 franc improved the country's external
competitiveness, real GDP growth was too low to boost per capita income; IMF
(2007); Ministry of Finance and economy of Niger (2006).
Over the years, the study of economic growth has become one of
the hottest research areas due to the strategic implications of economic growth
to national development. Modern theories on economic growth offer several
explanations to this; Katheline (2000). According to the classic definition of
François Perroux (1981), economic growth is «an increase in the
capacity of an economy to produce goods and services, compared from one period
of time to another''. In practice, gross domestic product (GDP) is used to
measure economic growth and the rate of economic growth is evaluated by the
rate of change of GDP. The financial sector is an important contributor to GDP
in every economy. Therefore, the level of growth and development of an economy
is tied partly to profound reforms made in the financial and monetary
structures as well as policy interventions. Changes in the financial sector are
fundamental and vital for these reforms due to its role in spreading risk and
mobilizing savings. It is therefore imperative to highlight the contributions
of this sector to economic growth. Nonetheless, economic theories are divided
on the importance of this sector in economic growth; Bagehot (1873); Hicks
(1969); Goldsmith (1969); Schumpeter (1912); Robinson (1952); Lucas (1988).
1 Local currency share by an eight former French
colonies in West Africa
Consequently, two main hypotheses are advanced whose central
issue is whether or not the financial sector supports economic development. The
first is led by Bagehot and others; Bagehot (1873); Mackinnon (1973); Shaw
(1973); and Schumpeter (1912). They highlight the active role of the financial
sector in promoting economic growth; Robinson (1952) and Lucas (1988) on the
other hand believe there is no relationship between the financial sector and
economic growth.
Crises in the banking sector in 1980s resulted in collapse of
banks in developing countries especially in Africa; particularly, south of the
Sahara. It forced the West African and Monetary Union (WAEMU) countries (among
which Niger is a member) to engage in financial liberalization advocated by
researchers as an intervention measure; McKinnon and Shaw (1973). This
intervention, as envisaged at the time, would allow the recovery of the banking
and the financial sectors and in fact, propel the growth of the economy.
Unfortunately, the intervention has not been successful due to the fact that
the financial sector is highly concentrated with higher intermediation margins;
resulting in excess liquidity which has adverse effects on banking efficiency;
Igué (2006).
A developed financial sector enhances economic growth, by
promoting and mobilizing savings and providing information on investments
opportunities so that resources can be channeled to productive ventures. It
monitors the disbursement of funds, promotes trading, diversification and
management of risk as well as facilitating the exchange of goods and services
leading to economic growth; Levine (1997, 2004).
The objective of this study is to investigate whether the
development of financial sector in Niger in the past 40 years has contributed
to economic growth or not. Empirically, real GDP was used to indicate economic
growth; two variables were used to indicate financial development. Financial
deepening M2/GDP denoted by FD, and credit to the private sector to GDP by CP.
Based on these, investigation to determine whether or not there was any
relationship between financial development and economic growth in Niger was
done.
1.1. Motivation
There have been some studies on the financial development and
economic growth in some WAEMU countries, however to the best of my knowledge
there has not been any report in the case of Niger. Its financial sector has
not been given the necessary attention in research studies as an important
indicator of economic growth. Hence, the need to fill this research and
academic gap is of paramount importance. This study therefore, aims at
analyzing the relationship between the financial development and economic
growth of Niger and providing implicit and explicit policy suggestions that may
be adopted by policy makers to promote financial development and economic
growth.
1.2. Scope of the Study
Financial development is a broad term; it is a combination of
the developments of financial institutions financial markets and financial
assets []. The focus of this study is mainly on the development of financial
institutions. Other aspects such as stock market will not be considered as the
country has no effective and operational stock market. In fact, the whole of
the West African Economic and Monetary Union (WAEMU)2, has only one
stock market located in Abidjan, Ivory Coast. Be it as it may, this regional
stock exchange3 is not well developed to compete with and to break
the monopoly of the banks.
1.3 Brief overview of economic growth and financial
sector Development in Niger
1.3.1 Economic Growth
Since independence (in 1960), Niger has experienced several
profound economic growth. This span of economic developments may be divided
into five (5) different periods.
1963-78 The rural sector contribute more than
half of total value added to GDP, with mining accounting for about 7 percent.
Within this period, there were series of
2 an eight member organization comprising of former French
colonies, Niger, Mali, Benin, Burkina Faso, Cote D'Ivoire, Togo, Senegal and
Guinea Bissau.
3 Common Stock market shared by the former French
Colonies
droughts that weakened the agricultural sector which account
for about 40 percent of the GDP, negatively impacting on growth. Per capita
real GDP growth averaged about 0.8 percent per year; Ministry of Finance of
Niger (2006).
1979#177;82: Higher uranium prices pushed per
capita real GDP growth to an average of about 2.5 percent per year, in this
period. The mining sector contributed an overall GDP of about 13 percent. This
increased government revenue and facilitated greater public investment in
infrastructure; Ministry of Finance of Niger (2006).
1983#177;93: International uranium prices and
Niger's terms of trade declined sharply, significantly reducing export
earnings, slowing investment, and weakening the financial sector. Limited
policy adjustments to the terms of trade and political instability worsened the
situation. Per capita real GDP declined, by an average of 3.4 percent a year;
Ministry of Finance of Niger (2006).
1994#177;98: Along with devaluation of the
CFA franc (in 1994), the Nigerien authorities initiated reforms that worked
towards liberalizing the economy. These measures improved external
competitiveness and strengthened the economy's overall supply response. Good
weather conditions boosted the performance of the agricultural sector, although
per capita real GDP growth still averaged just about 0.5 percent a year; IMF
(2007).
1999-2010: The 1999 elections ushered in a
democratic government and brought consensus on the need for prudent policies
and reforms to strengthen growth and reduce poverty. Consequently state-owned
companies were privatized and domestic and external trade liberalized. While
these reforms strengthened the economy's supply response, droughts continued
to hit the economy leading to limited progress in agricultural productivity
resulting in modest per capita real GDP growth; IMF (2007).
1.3.2 Financial Sector Development
Niger is a member of the Economic and Monetary Union of the
West Africa (WAEMU) which comprise of 8 former French colonies in West Africa.
The Central Bank of the States of West Africa, known as Banque Centrale des
Etats de l'Afrique de l'Ouest (BCEAO) in French which was established in 1962
is responsible for both the
management of the monetary policies, regulating and
supervising the banking services of the member countries. The financial sector
of Niger is relatively underdeveloped. The sector includes the central bank,
ten commercial banks; the national fund of social security system; five
insurance companies; three brokerage firms and about 270 microfinance
institutions MFIs; Monograph of BCEAO (2004). Among the WAEMU member countries,
Niger's ratio of broad money to GDP and deposit to GDP is the lowest. Based on
this, it is safe to conclude that the financial intermediation in Niger is
still very low. Total assets of the financial system at the end of 2005 stood
at about 373 billion CFA francs, representing 21% of the GDP. The banking
sector dominates the financial system with total assets accounting for about
63% where as the non financial sector accounted for about 29% with the
insurance sector accounting for about 5.3% and the microfinance institutions
accounting for about 2.7%; WAEMU (2005). The financial sector suffered serious
difficulties in the late 80s and 90s. Banks, security funds and microfinance
institutions went through severe financial crisis. Additionally, long period of
political and economic instability and sluggish economic growth are factors
that contributed to this financial crisis. Other factors that affected the
sector include the inefficiency of the judiciary, poor financial sector
policies, including supervision, lax banking, the rigidity of the structure of
interest rates and sectoral allocation of credit; WAEMU (2003). Mismanagement,
subsidized loans (especially in the late 70s and the 80s) and budget deficits
also contributed to the failure of the financial institutions.
1.4 Disposition
The study is structured in four parts; the first chapter is an
introduction focusing on the motivation, the scope and a brief history of
Niger's economic growth and financial sectors. The second chapter is an
overview of theories concerning financial development and economic growth. The
third chapter is the description of data, variables, and results of empirical
validation. The final chapter is the conclusion and policy implication of
findings of the study.
Chapter 2 Literature Review
Economic growth is a goal and national development policy of
every nation. Developed economies provide living evidence of the importance of
the financial sector in economic growth. Financial development stimulates
economic growth through investment which invariably contributes to increasing
national productivity.
2.1 Financial development: a factor for economic
growth
The positive correlation between financial development and
economic growth has been recognized in the literature for over decades Bagehot
and others Bagehot (1873), Schumpeter (1912), Goldsmith (1969) are among the
pioneers of this topic. Financial structure quickly became one of the
fundamental economic developments spurred by authors Gurley and Shaw (1967);
McKinnon (1973), King and Levine (1993). In almost all studies, findings
confirm that an efficient financial system contributes strongly to economic
growth. The correlation between the two variables is widely accepted however
the direction of causality is yet debatable. The concept of financial system
generally includes banks and financial markets. Levine (2004) advanced five
arguments that theoretically support the existence of strong and positive link
between financial development and economic growth. He stated that financial
system would:
· Cushion against the risk;
· Allow optimal allocation of resources;
· Allow better control of the company management
· Facilitate the mobilization of domestic savings;
· Facilitate the exchange of goods and services.
Schumpeter (1911) argued that an efficient financial system
greatly helps the growth of a nation's economy. For him well-functioning banks
encouraged technological innovation by offering funding to entrepreneurs that
have the best chances of successfully implementing production processes for
innovative products. Goldsmith (1969) is another pioneer in studying the links
between growth and financial development. His study focused on a sample of 35
countries over the period 1860 to
1963. He concluded that there is a positive link between the
financial sector and economic growth. In an attempt to address the weakness in
the work of Goldsmith, King and Levine (1993), focused their analysis on a
sample of 80 developed countries over a period 1960 to 1989 by reviewing all
financial factors likely to influence long-term economic growth and concluded
that there was statistically significant and positive contribution of financial
variables on economic growth.
Levine and Zervos (1998) assessed the impact of exchange stock
market and development of the banking sector on economic growth with a sample
of 49 countries over the period of 1976-1993 and using asset turnover, and
market capitalization ratios, market volatility and bank development indicators
as financial variables. They also considered as growth rate of real GDP,
capital, productivity and savings as endogenous variables in line with earlier
studies; King and Levine (1993). Their result highlighted the positive impact
of financial variables on economic growth and penciled two mechanisms through
which financial development is affected economic growth. The first is the
increased efficiency of capital, through better resource allocation, and the
second is the mobilization of savings which increases the volume of investment.
They concluded that economies with high levels of financial development
exhibited higher growth rates. Venet et al. (1998) in a study on the economies
of sub-Saharan countries from 1970-1995 found out that financial deepening
played a major role in the real growth of majority of countries within WAEMU,
including Cameroon. They used economic growth measured by real GDP per capita
as regressor and ratios of M2 to GDP, the nominal credit to the private sector
and stock of real credit per capita as financial variables and concluded that
there was a causal link between financial deepening and real economic growth of
the countries except Niger. In its case, there was no causal significance; yet,
according to them, the result does not necessarily imply the absence of
economic ties between the two sectors of Niger.
2.2 Financial development: a less factor for economic
growth
In fact, the issue of the relationship between financial
development and economic growth is still debated. Some economists believe there
is no significant relationship between financial system and economic growth.
For instance, Lucas (1988) dismissed the finance-economic growth relationship
by stating that economists «badly over-stress» the role financial
factors play in economic growth. Mayer (1988) argues that a developed stock
market is not important for financing of companies. Nonetheless, some authors
such as Robinson (1952) assert that economic growth creates demand for
financial instruments and that where enterprise leads, finance follows. Nguema
(2000) studied financial intermediation and growth on Gabon, and concluded that
despite the regular periods of excess liquidity in the banking system, banks
did not finance growth. In other words, the development of the financial sector
did not influence the economic growth of the country.
2.3 Financial liberalization and economic growth in the
WAEMU countries
Generally, the term "financial repression" refers to the
effects of strict regulation of financial systems and the arrays of
restrictions imposed by States on the activity of financial institutions.
Adopting financial liberalization policies was often considered a prerequisite
for healthy and efficient financial sector; McKinnon and Shaw (1973).
Theoretical and empirical studies conclude that financial development plays
important role in economic growth, and that less developed financial systems
may hinder economic growth, and that reforms involving the deployment of market
mechanisms must be pursued. Evidence from these studies has been the foundation
for the wave of financial liberalization of many developed and developing
economies. For the WAEMU countries, the liberalization of financial systems to
stop the collapse of the banks and propel investment began in the late 1980s;
WAEMU annual report (2003). The reforms were primarily liberalization of
interest rates, elimination of credit, operationalization of the minimum
reserve system, renovation of the money market, creation of the Regional Stock
Exchange known as Bourse Regionale de Valeures Mobilieres (BRVM) in French, and
promotion of the microfinance sector. These
measures were implemented (as part of the liberalization
policy in the monetary area) to improve the efficiency of banks for economic
growth. However, some argue that financial repression has a reducing effect on
growth.
McKinnon and Shaw (1973), King and Levine (1993) are the main
advocates for financial liberalization. For them, a repressed financial system
where the state controls the banking sectors is ineffective because government
plays important role in credit allocation, through the maintenance of very low
interest rates, subsidized interest rates for priority sectors (especially
SOEs) and very high reserve requirements. This development is believed to
disturb relative prices and resource allocation. Financial liberalization
therefore, must first promote greater collection of savings, by increasing the
supply of savings instruments and raising real interest rates. There is also
the tendency to finance less productive investments in a financially repressed
economy; McKinnon (1973). Furthermore, Shaw (1973) showed that the rate limits
aggravate risk aversion and liquidity preference of financial intermediaries.
According to Fry (1997), credit allocation is usually based on political
affiliations rather than on the basis of efficiency in a repressed financial
system. King and Levine (1993) also stated that financial repression reduces
the services offered by the financial system for clients. It hinders innovation
and weakens the growth rate of the economy. Therefore, theoretically, there is
ample evidence that shows that financial repression adversely affects both the
financial sphere and the real economy. Hence, the liberalization of financial
systems advocated by economists as a measure to induce economic growth seems to
be in the right direction. In contrast, a second approach argues that financial
liberalization is harmful to financial development innovation and economic
growth. Stiglitz (1981) opined that the function of capital markets, driven
mainly by financial liberalization is affected by asymmetric information flow
which undermines its effectiveness. For example, the head of a credit bank has
more information on the terms and conditions on loans than the client who is
taking risks to borrow. This results in adverse selection, and moral hazard.
Chapter 3 Empirical Analysis
Macroeconomic performance in Niger has been quite poor over
the years and real GDP varied between 1970 and 2010. In this chapter variables
of the study are described, data are analyzed and results validated
empirically. Initially, the presence of unit root is enquired before
determination of Cointegration. After Cointegration between the variables was
established the existence of long run equilibrium relationship was confirmed.
Finally, a Vector Error Correction technique was employed to examine the short
and long run dynamics with the help of Eviews 7.1 Software.
3.1 Data and Description of Variables
3.1.1 Data
Annual time series data were used from 1970 - 2010. The data
was collected from the International Financial Statistics (IFS) and World Bank
Development Indicators (WDI) databases (
http://www.imf.org/external/data.htm;
http://data.worldbank.org ).
3.1.2 Economic Growth Indicator
Unlike Levine (2000) who used real GDP per capita in measuring
economic growth, herein, real GDP was used as a proxy for economic growth
because the population growth rate of Niger is higher than the GDP growth; such
that dividing the real GDP by the population does not reflect the growth of the
country. This variable would reflect the evolution of the economic development.
Note that this indicator reflects the economic health of a country and its
ability to finance domestic investment. Therefore the natural logarithm of real
GDP is used as indicator of economic growth denoted by (GDP).
3.1.2 Financial Development Indicators
Based on Niger's situation and availability of data, two
variables were successively selected to measure financial development, which
are the ratio M2 divided by GDP denoted FD and credit to the private sector
also divided by GDP denoted by CP. The ratio of credit to the private sector to
GDP has been designed as
an indicator of financial intermediation. The higher this
ratio is, the larger the volume of credit lending to the private sector.
Additionally, credit to private sector to GDP as a proxy of financial
development indicates not only a high level of domestic investments, but also a
high development of the financial system. Furthermore, Financial deepening (FD)
is designed as an indicator to capture the evolution of the liquidity of the
economy. Moreover, Demetriades and Hussein (1996), King and Levine (1993) used
this variable to measure the development of the financial sector. Increase in
FD corresponds to increase in liquidity of the economy. The sign of FD was
expected to be positive because the more liquid an economy is, the more
opportunities exists for continued and sustainable growth. However, the sign
for credit to the private sector to GDP (CP) may be ambiguous; allocation of
non-performing credits may be a source of crises for banks as well as the
economy and thus relate negatively to growth. On the other hand, it may be
positively correlated with GDP if credits are deployed efficiently; [].
Therefore, the logarithm of CP and FD were used as financial development
indicators.
The Figures below illustrate each series in log levels of the
variables as well as the first differences of the logs. As indicated in Figure
3.1, each series appears to be nonstationary. Whereas the first differences of
the logs of the series in Figure 3.2 have stationary appearance.
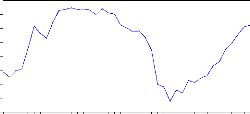
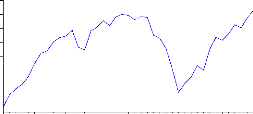
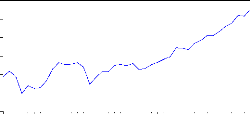
Figure 3.1: Trend of individual variables GDP, FD, and CP
in log level
The variables fluctuate over the years. The CP appears to
decrease from 1970 up 1972, then increase abruptly in
CP
1975. It then fell in 1978 and picked to a maximum in 1979.
Thereafter, it decrease steadily in 1997 and finally
increase from 1997 to
2010. The FD increased from 1970 to 1980, then dropped to 1983 and increased
steadily to
FD
1994, then decreased to 1997 and finally increased in 2010. The
GDP increased from 1970 to 1971, decreased in 1973, then increased steadily to
1979 and then dropped in 1984.Thereafter,it increased till 2010.
GDP
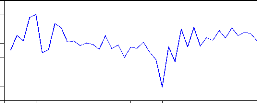
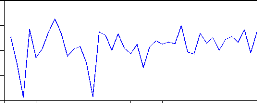
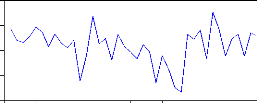
Figure 3.2: Log first differences of individual
variables
From Figure DCP increased from 1970 to 1972, and then
decreased sharply in 1976. It stabilizes a little in 1992,
1980 1985 1990 1995 2000 2005 200
and dropped 1995.Thereafter it fluctuates steadily till 2010.
The trend of DGDP decreased from 1970 to 1972, and
then increased from 1972
to 1975. It then fell from 1978 to 1983. It increased so sharply from 1983 to
1985.
DGDP
Finally, it fluctuates steadily from 1985 to 2010 even though
it decreased in some years. The DFD decreased from year 1970 to 1972, and then
increased litter in 1975.Thereafter decreased from 1980 to 1983 and picked up
from 1983 to 1985. It then decreased slightly up 1999. From 1999 it increased
sharply to 2004 then dropped till 2010.
Below are descriptive statistics at the level and the first
difference of the variables.
Table 3.1 Descriptive statistic of the
variables
|
GDP
|
FD
|
CP
|
|
Mean
|
27.36909
|
2.544895
|
2.203026
|
|
Median
|
27.30820
|
2.657242
|
2.334714
|
|
Maximum
|
27.90803
|
3.065516
|
2.871635
|
|
Minimum
|
26.99595
|
1.675567
|
1.194554
|
|
Std. Dev.
|
0.230233
|
0.374789
|
0.523250
|
|
Skewness
|
0.688648
|
-0.623488
|
-0.312218
|
|
Kurtosis
|
2.706422
|
2.307543
|
1.709129
|
|
Jarque-Bera
|
3.387850
|
3.475511
|
3.512791
|
|
Probability
|
0.183797
|
0.175915
|
0.172666
|
N.B: There were 41 observations from 1970-2010.
Table 3.2 Descriptive statistic of the first difference
of the Variables
|
DGDP
|
DFD
|
DCP
|
|
Mean
|
0.018184
|
0.034749
|
0.020999
|
|
Median
|
0.026446
|
0.062450
|
0.017334
|
|
Maximum
|
0.126391
|
0.305851
|
0.402673
|
|
Minimum
|
-0.186903
|
-0.332989
|
-0.609583
|
|
Std. Dev.
|
0.064037
|
0.143077
|
0.180374
|
|
Skewness
|
-1.475985
|
-0.811726
|
-0.702480
|
|
Kurtosis
|
5.997952
|
3.522487
|
5.410074
|
|
Jarque-Bera
|
29.50307
|
4.847649
|
12.97062
|
|
Probability
|
0.000000
|
0.088582
|
0.001526
|
N.B: There were 40 observations.
3.2 Unit root Test
Most macroeconomics data are nonstationary; hence it was
primordial to test for stationarity before the regression in order to avoid
misleading results. Therefore, a formal test is applied in order to check the
stationarity of the series. Series which are stationary at level is said to be
integrated of order zero, I (0). The ones which attained
stationarity after differencing is said to be integrated of order
one, I (1).
3.2.1 ADF test
Augmented Ducky Fuller (ADF) test was used to test for the
stationarity. It consists of running a regression of the first differences of
the series against the series lagged once, lagged difference terms and
optionally, a constant and time trend. This can be expressed as follows:
(1)
Where is the dependent variable, is constant term, trend
variable, is
stochastic disturbance term.
The test for unit root was carried out on the coefficient of ().
If the coefficient
is significant from zero, then the hypothesis that has a unit
root is rejected. The
fact that the null hypothesis is rejected indicates stationarity.
The null hypothesis is
that the variable is a non-stationary series (H0: )
and it is rejected when
is significantly negative ( ).
If the computed value of the ADF statistic is more negative
than the critical values, then the null hypothesis (H0) is rejected and the
series considered to be stationary or integrated of order zero, I(0). Contrary,
failure to reject the null hypothesis implied that the series is non-stationary
leading to another test on the first difference of the series. If the series
attained stationarity after the first difference, they are considered
integrated of the order one, I (1). If not, further difference was conducted
until stationarity was reached.
Table 3.3 Unit root test of level
|
variable
|
Constant
|
Trend
|
|
ADF
statistic
|
1%
|
5%
|
10%
|
ADF
statistic
|
1%
|
5%
|
10%
|
|
GDP
|
0.581
|
-3.605
|
-2.937
|
-2.607
|
-1.766
|
-4.205
|
-3.526
|
-3.195
|
|
FD
|
-2.035
|
-3.605
|
-2.936
|
-2.606
|
-1.883
|
-4.205
|
-3.526
|
-3.194
|
|
CP
|
-1.948
|
-3.615
|
-2.941
|
-2.609
|
-2.207
|
-4.219
|
-3.533
|
-3.198
|
Table 3.4 Unit root test of first difference
|
variable
|
Constant
|
Trend
|
|
ADF
statistic
|
1%
|
5%
|
10%
|
ADF
statistic
|
1%
|
5%
|
10%
|
|
D(GDP)
|
-6.250
|
-4.211
|
-3.529
|
-3.196
|
-6.250
|
-4.212
|
-3.529
|
-3.197
|
|
D(FD)
|
-4.663
|
-3.610
|
-2.938
|
-2.607
|
-4.585
|
-4.211
|
-3.529
|
-3.196
|
|
D(CP)
|
-2.818
|
-3.621
|
-2.943
|
-2.610
|
-3.769
|
-4.226
|
-3.536
|
-3.200
|
3.2.2 Test Results
Results of the unit root test showed that all the series were
nonstationary. The ADF test statistics were lesser than the critical values
indicating that the series were nonstationary at level (Table 3.3).
Furthermore, all the variables attained stationarity at first difference at 10%
significance level. The calculated values of the ADF statistics were more
negative than the critical values implying that the series were integrated of
order one I (1) (Table 3.4).
3.3 Empirical results
In this section, an optimal lag length is chosen and results of
the Cointegration test as well as the Vector error correction model (VECM)
estimates are presented.
3.3.1. Vector Autoregression (VAR) Lag Length
Since all the variables are integrated of order one, application
of Johansen Cointegration test is more appropriate; Johansen (1991, 1995). Yet,
Johansen Cointegration test is sensitive to the lag length. Therefore an
optimal lag length (p) must be chosen. Also, before estimation of the VECM
model with associated cointegrating vector, it is necessary to select optimal
lag length of initial VAR. Different information criteria were computed for
different time lags; each at 5% level of Likelihood Ratio (LR), Final Predict
Error (FPE), Akaike Information Criteria (AIC), Schwarz Information Criteria
(SC), and Hannan-Quinn information criteria (HQ). Result showed that the
appropriate lag for all the criteria was one. Hence, the number of lags
required in the Cointegration test was set to one (p=1).
Table 3.5 VAR lag order selection criteria
|
Lag
|
LogL
|
LR
|
FPE
|
AIC
|
SC
|
HQ
|
|
0
|
-16.792
|
NA
|
0.006
|
1.099
|
1.231
|
1.145
|
|
1
|
99.058
|
205.957*
|
1.60e-06*
|
-4.836*
|
-4.308*
|
-4.652*
|
|
2
|
105.206
|
9.905
|
1.89e-06
|
-4.678
|
-3.754
|
-4.356
|
|
3
|
110.411
|
7.517
|
2.41e-06
|
-4.467
|
-3.147
|
-4.007
|
|
4
|
119.311
|
11.373
|
2.57e-06
|
-4.462
|
-2.746
|
-3.863
|
|
5
|
128.401
|
10.099
|
2.82e-06
|
-4.467
|
-2.355
|
-3.729
|
* indicates lag order selected by the criterion , LR:
sequential modified LR test statistic (each test at 5% level)
FPE: Final prediction error, AIC: Akaike information criterion,
SC: Schwarz information criterion, HQ: Hannan-Quinn information criterion
3.3.2. Cointegration Test
As Engle and Granger (1987) pointed out, it is possible that a
linear combination of nonstationary series may be stationary. If such
stationary combination exists, the non-stationary time series are said to be
co-integrated and it is then possible to interpret it as a long-run equilibrium
relationship among the variables. Johansen (1995) suggested two test statistics
based on Likelihood ratio (LR); the trace statistics and the Maximum Eigenvalue
statistic. The first statistic tests the null hypothesis that the number of
Cointegration vector is less than or equal to r against the
alternative that
the number of Cointegration vector is equal to r. The
second statistic tests the null hypotheses that the number of Cointegration
vector is equal to r against the alternative that it is equal to
r+1.
Table 3.6 Johansen Cointegration test
|
Unrestricted Cointegration Rank Test (Trace)
|
|
|
Hypothesized
No. of CE(s)
|
Eigenvalue
|
Trace
Statistic
|
0.05
Critical Value
|
Prob.**
|
|
None
|
0.441
|
26.032
|
29.797
|
0.127
|
|
At most 1
|
0.061
|
2.763
|
15.494
|
0.976
|
|
At most 2
|
0.006
|
0.227
|
3.841
|
0.633
|
|
Trace test indicates no cointegration at the 0.05 level *
denotes rejection of the hypothesis at the 0.05
level **MacKinnon-Haug-Michelis (1999) p-values
|
|
Unrestricted Cointegration Rank Test (Maximum Eigenvalue)
|
|
Hypothesized
No. of CE(s)
|
Eigenvalue
|
Max-Eigen
Statistic
|
0.05
Critical Value
|
Prob.**
|
|
None *
|
0.441
|
23.268
|
21.131
|
0.024
|
|
At most 1
|
0.061
|
2.535
|
14.264
|
0.972
|
|
At most 2
|
0.005
|
0.227
|
3.841
|
0.633
|
|
Max-eigenvalue test indicates 1 cointegrating eqn(s) at the 0.05
level * denotes rejection of the
hypothesis at the 0.05 level **MacKinnon-Haug-Michelis (1999)
p-values
|
3.3.3. Cointegration results
The number of cointegrating vectors was tested based on the
assumption that the series have linear deterministic trend and that there is an
intercept. The null hypothesis that there is no cointegrating vector concerning
the trace statistics could not be rejected since its value was greater than the
5% critical value. Since we failed to reject the null hypothesis with no
Cointegrating equation this indicates that any cointegrating equation has not
been found concerning the trace statistic. However, the maximum eigenvalue
statistics test indicates one (1) cointegrating equation among the variables.
Thus, there was one Cointegrating equation indicating long-run equilibrium
relationship among the variables (Table 3.6).
3.3.4. Vector Error Correction Model (VECM)
The use of the vector error correction model was necessitated
by the fact that the time series were nonstationary in their levels except in
their differences, coupled with the fact that the variables were cointegrated.
In case there was no Cointegration, VECM was not required. The VECM was applied
in order to evaluate the short run properties of the cointegrated series and to
find the real link between the variables. It enables the integration of the
short-run fluctuations. The coefficient of the error correction term must be
negative to report a force towards the long-run equilibrium. The regression
equation of the VECM is express as:
(2)
(3)
(4)
Where Ä is the first difference operator, is the error
correction term lagged one
period, are the short-run coefficients are constant terms,
are coefficient of the vectors and are
the white noise terms.
Table 3.7 Vector error correction estimates
|
Cointegrating Eq:
|
CointEq1
|
|
|
GDP(-1)
|
1.000000
|
|
|
CP(-1)
|
0.765
(0.144)
[ 5.279]
|
|
|
FD(-1)
|
-1.311
(0.206)
[-6.355]
|
|
|
C
|
-25.714
|
|
|
Error Correction:
|
D(GDP)
|
D(CP)
|
D(FD)
|
|
CointEq1
|
-0.061
(0.031)
[-1.935]
|
0.183
(0.089)
[ 2.059]
|
0.283
(0.058)
[ 4.805]
|
|
C
|
0.018
(0.009)
[ 1.858]
|
0.021
(0.027)
[ 0.766]
|
0.035
(0.018)
[ 1.922]
|
|
R-squared
|
0.089
|
0.100
|
0.377
|
|
Adj. R-squared
|
0.065
|
0.076
|
0.361
|
|
Sum sq. resids
|
0.145
|
1.141
|
0.496
|
|
S.E. equation
|
0.062
|
0.173
|
0.114
|
|
F-statistic
|
3.744
|
4.243
|
23.090
|
|
Log likelihood
|
55.560
|
14.374
|
31.019
|
|
Akaike AIC
|
-2.678
|
-0.619
|
-1.451
|
|
Schwarz SC
|
-2.593
|
-0.534
|
-1.366
|
|
Mean dependent
|
0.018
|
0.021
|
0.035
|
|
S.D. dependent
|
0.064
|
0.180
|
0.143
|
|
Determinant resid covariance (dof adj.) Determinant resid
covariance
Log likelihood
Akaike information criterion
Schwarz criterion
|
1.40E-06
|
|
|
1.20E-06
|
|
|
102.433
|
|
|
-4.671
|
|
|
-4.291
|
|
NB: Standard errors in ( ) & t-statistics in [ ]
Short run dynamic
variable coefficient Standard error t-statistic
D(GDP) -0.061* 0.032 -1.935
(*), indicates significant at 10% level
The coefficient should be negative and significant to show
that the long run relationship exists among the variables and that deviation
from equilibrium in the previous year is adjusted back to equilibrium in the
current year. In other words, this indicates a long-run error correction among
the variables. In particular, given that the
coefficient of is -0.061, this means that 6.1% of the
disequilibrium in the previous
year were adjusted back to equilibrium in the current year.
|
Long run dynamic
|
|
|
|
|
Variables
|
Coefficient
|
Standard error
|
t-statistics
|
|
GDP(-1)
CP(-1)
FD(-1)
C
|
1.000000 0.765*** -1.311*** -25.714
|
0.145
0.206
|
5.279
-6.355
|
(*), (**) (***) indicates 10% 5% and 1% significance level,
respectively.
Based on the long run dynamic analysis the relationship between
GDP, CP and FD can be expressed in terms of the coefficients as
(5)
We interpreted the coefficients in terms of elasticity. The
GDP increased by 1.311 percent with an increase of one percent of FD. It had
significant influence on the economic growth of Niger. However, an increase of
one percentage of CP led to a decrease in GDP by 0.765 percent, which confirms
the ambiguity of the sign of CP. With effective allocation of resources, it
will be correlated positively with economic growth; otherwise not, especially
in countries where the financial systems are not well developed. Generally, CP
is expected to have positive effect on investment leading to economic growth;
Demetriades and Hussein, (1996). Contrary, we found negative and significant
impact of CP on economic growth in Niger. This result could be explained by the
huge non performing loans on the private sector between 1970 and 1980. Higher
CP means wider financial sector and higher
financial intermediation. Yet for Niger's case, the CP was
lower; indicating restraint of the financial sector and lower financial
intermediation. Additionally, the attitude of bankers to finance less risky
projects lead to low capital intensity. This does little to improve investment
and may create distortions in the economy. Furthermore, investment in Niger is
weak and unstable leading to unexpected negative returns from projects with
attendant negative impact on economic growth; De Gregorio and Guidotti
(1995).
Chapter 4 Conclusions and Policy Implications
Chapter 4 Conclusion and Policy Implications
4.1. Conclusion
We investigated the existence of relationship between
financial developments and economic growth in Niger with annual time series
data from 1970 to 2010 using Vector Error Correction techniques. Results of ADF
unit root test demonstrated that the series were non stationary at their levels
but stationary at first difference. Additionally, Johansen Cointegration test
was applied to study the long run equilibrium relationship among the variables
and results indicate the existence of Cointegration among the variables. The
VECM was estimated to improve the dynamism of the short and long run
relationships. The error correction term is negative and statistically
significant indicating that after a shock in a previous year, the long run
disequilibrium will converge towards equilibrium at about 6.1% percent in a
current year. In the long run, we found that an increase in financial deepening
(FD) leads to an increase in GDP however; there was a negative and significant
effect between credit to the private sector to GDP and economic growth.
4.2. Policy Implications
Based on the findings of the empirical analysis, suggestions
are advanced for policy interventions. The negative relationship between credit
to private sector and economic growth may be due to inefficient allocation of
funds to productive sectors. This is mainly due to the fact that most borrowers
default on loan payments. As a result, banks are reluctant to give out credit
to many customers; they pursue selective lending to few sectors, especially the
mining and telecommunication industries. This creates a situation where there
is no readily available credit to legitimate entrepreneurs, leading to less
economic growth. Hence, to boost economic growth and development, the authority
in Niger should enact laws and policies to establish a central credit bureau
linking all banks. This will collate the names and history of all borrowers
such that previous loan defaulters as well as the ability of borrowers to honor
loan payments can easily be determined by credit officers. On the other
hand,
Financial Development and Economic Growth Evidence from
Niger
the positive correlation of financial deepening to economic
growth indicated that financial deepening had much influence on the economic
growth and developments of Niger. Therefore, to induce economic growth and
developments, the government has to work towards building a stronger and more
diversified financial and banking sector by continuing to liberalize the
financial sector so as to create competition among the banks. Competition will
drive banks to institute innovative policies and programs that are customer
friendly. For instance banks may be forced to embark on vigorous advertisement
to educate customers on the advantages of banking with them or allow creation
of zero-balanced deposit accounts. This will encourage more clients to save
resulting in more liquidity to promote economic growth. Another intervention is
to formulate directives for banks to conduct periodic and scheduled
sensitization and education programs for the populace about the security of the
banks against collapse. There is the general belief that the banks in Niger may
collapse at any time, resulting in many people not wanting to save. This
perception is borne out of the collapse of the banking sector in the 1980s.
Therefore, creating confidence among the citizens is vital for the
sustainability of the banks and the economic growth of Niger.
References
Arestis, P. Demetriades, P.(1997), «Financial development
and economic growth: Assessing the Evidence» Economic Journal,
107:783-799.
Bagehot, W. (1873), Lombard Street: «A Description of the
Money Market», EP Dutton and Company Reprint 1920 New York.
Baptiste.V Anne J., Marc R. (1998), «Financial Deepening and
Growth: an empirical analysis of Sub-Saharan».CREFED-CERPEM, pp.11.
BCEAO (2004), Monographie des institutions financiqre de
l'UEMOA.
De Gregorio, J. and Guidotti,P.(1995), «Financial
Development and Economic Growth.»World Development 23 (3):433-448.
Demetriades, P.O and Hussein, K.A.(1996) ,«Does financial
development cause Economic Growth?» Times series evidence from 16
countries, Journal of development economics ,51(2):387-411.
Engle, Robert F. and W.J.Granger (1987), «Co-integration and
Error Correction: Representation, Estimation and Testing». Econometrica,
55:251-276.
Fritz, Richard G.(1994), «Time Series Evidence on the Causal
Relationship between «Financial Deepening and Economic Development».
Journal of Economic Development, 91-112.
Fonds Monétaire International (2007), Niger Questions
Générale et Appendice Statistique Rapport du FMI No 07/14 Janvier
2007.
Fry.M (1988), «Money, interest and banking in economic
development», the Johns Hopkins press.
Fry,M. (1997),«Money, interest and banking in economic
development», Second Edition the Johns Hopkins University Press, Baltimore
& London.
Granger, C. W. J. (1969), «Investigating Causal Relations by
Econometric Models and Cross- Spectral Methods», Econometrica,
37: 424-438.
Goldsmith, R. W. (1969), «Financial structure and
development».Yale Univ Press New Haven CT.
Gurley, J. and E, Shaw. (1967) «Financial Structure and
Economic Development'' Economic Development and Cultural Change.
Hicks, J. (1969), «A Theory of Economic History,
Oxford»: Claredon Press.
Igué, C .(2006), ``Reformes du syst me financier
:efficacité bancaire et croissance économique :
Une référence a la zone UEMOA'' thèse de
Doctorat, Université de Ouagadougou, Burkina-Faso.
Johansen, S.(1991) ), «Estimation and Hypothesis Testing of
Cointegration Vectors in Gaussian Vector Autoregressive Models»
Econometrica, 59: 1551-1580.
Johansen,S.(1995),«Likelihood-base Inference in Cointegrated
Vector Autoregressive, Models», Oxford University Press.
Katheline, S. (2000), «Analyse macroéconomique : la
croissance», Editions la découverte & Syros Paris
collections Repères.
King R. G. R. Levine, (1993), «Finance and growth:
Schumpeter might be right» Quarterly Journal of Economics, 108(3):
717-738.
Levine, R. (1997),«Stock Markets, Growth, and Tax
Policy» E The journal of Finance V.XLVI (4): 1445-1465.
Levine, R. (1997). «Financial Development and Economic
Growth: Views and Agenda», Journal of Economic Literature 35: 688-726.
Levine R.,( 2004), «Finance and Growth:
Theory and Evidence», Working Paper,10766, National Bureau of Economic
Research (NBER), Cambridge MA.
Levine R et Zervos, (1998) «Stock market
banks and growth», The American Economic Review Vol 88 No3.
Levine, R. (2000),«Bank Concentration: Chile and
international comparisons» Working paper No 62.
Lucas, R. E. (1988), «On the Mechanics of
Economic Development», Journal of Monetary Economics 33(1).
Mckinnon, I. (1973), «Money and Capital in Economic
Development.» Washington, DC: Brookings Institution.
Mba Nguema, B.(2000), «Intermédiation
Financière et croissance Economique dans les pays de la CEMAC : cas du
Gabon'', mémoire de DEA-PTCI, Université de Libreville Gabon.
Perroux, F. (1981), ``Pour une philosophie du nouveau
développement''. Paris, Aubier.
Robinson, J. (1952), "The Generalization of the General Theory,
In: the rate of interest and others
essays» London: MacMillan.
Schumpeter, Joseph A. (1911),«The Theory of Economic
Development.»Cambridge, MA: Harvard University Press.
Schumpeter, Joseph A. (1939), «Business Cycles: A
Theoretical, Historical and Statistical Analysis of the Capitalist
processes».ENew York: McGraw-Hill.
Shaw, E. S. (1973), «Financial Deepening in Economic
Development». New York: Oxford Univ Press.
Stiglitz J. E. et A. Weiss, (1981),«Credit rationing in
markets with imperfect information» American Economic Review, vol 71,
No.3.
Rapport du Ministtre de l'économie et des finances du
Niger (2006). WAEMU Banking Commission, (2004) and (2005) Annual Report.
Appendix
A1 VAR lag length
|
VAR Lag Order Selection Criteria Endogenous variables: CP GDP M2
Exogenous variables: C
Date: 07/26/12 Time: 03:52
Sample: 1970 2010
Included observations: 36
|
|
Lag
|
LogL
|
LR
|
FPE
|
AIC
|
SC
|
HQ
|
|
0
|
-16.79238
|
NA
|
0.000603
|
1.099577
|
1.231537
|
1.145634
|
|
1
|
99.05879
|
205.9576*
|
1.60e-06*
|
-4.836600*
|
-4.308760*
|
-4.652370*
|
|
2
|
105.2066
|
9.904788
|
1.89e-06
|
-4.678144
|
-3.754425
|
-4.355741
|
|
3
|
110.4105
|
7.516778
|
2.41e-06
|
-4.467251
|
-3.147652
|
-4.006676
|
|
4
|
119.3113
|
11.37318
|
2.57e-06
|
-4.461737
|
-2.746258
|
-3.862989
|
|
5
|
128.4008
|
10.09944
|
2.82e-06
|
-4.466709
|
-2.355351
|
-3.729789
|
|
* indicates lag order selected by the criterion
|
|
LR: sequential modified LR test statistic (each test at 5%
level)
|
|
FPE: Final prediction error
|
|
AIC: Akaike information criterion
|
|
SC: Schwarz information criterion
|
|
HQ: Hannan-Quinn information criterion
|
A2 Cointegration test
Date: 08/16/12 Time: 13:14
|
|
Sample (adjusted): 1971 2010
|
|
Included observations: 40 after adjustments
|
|
Trend assumption: Linear deterministic trend
|
|
Series: CP GDP FD
|
|
Lags interval (in first differences): No lags
|
|
Unrestricted Cointegration Rank Test (Trace)
|
|
Hypothesized
|
|
Trace
|
0.05
|
|
|
No. of CE(s)
|
Eigenvalue
|
Statistic
|
Critical Value
|
Prob.**
|
|
None
|
0.441065
|
26.03211
|
29.79707
|
0.1277
|
|
At most 1
|
0.061416
|
2.763230
|
15.49471
|
0.9766
|
|
At most 2
|
0.005682
|
0.227925
|
3.841466
|
0.6331
|
|
Trace test indicates no cointegration at the 0.05 level * denotes
rejection of the
hypothesis at the 0.05 level **MacKinnon-Haug-Michelis (1999)
p-values
Unrestricted Cointegration Rank Test (Maximum
Eigenvalue)
|
|
Hypothesized
|
|
Max-Eigen
|
0.05
|
|
|
No. of CE(s)
|
Eigenvalue
|
Statistic
|
Critical Value
|
Prob.**
|
|
None *
|
0.441065
|
23.26888
|
21.13162
|
0.0246
|
|
At most 1
|
0.061416
|
2.535305
|
14.26460
|
0.9728
|
|
At most 2
|
0.005682
|
0.227925
|
3.841466
|
0.6331
|
|
Max-eigenvalue test indicates 1 cointegrating eqn(s) at the 0.05
level * denotes
rejection of the hypothesis at the 0.05 level
**MacKinnon-Haug-Michelis (1999)
p-values
Unrestricted Cointegrating Coefficients (normalized by
b'*S11*b=I):
|
|
CP
|
GDP
|
FD
|
|
|
|
-2.494180
|
-3.258155
|
4.272959
|
|
|
|
-1.553644
|
1.676929
|
-0.177757
|
|
|
|
|
|
|
|
|
0.893488
|
4.323155
|
0.391353
|
|
|
|
Unrestricted Adjustment Coefficients (alpha):
|
|
|
D(CP)
|
-0.056446
|
0.038557
|
-0.001286
|
|
|
D(GDP)
|
0.018937
|
0.006920
|
0.003697
|
|
|
D(FD)
|
-0.086857
|
-0.003577
|
0.003878
|
|
|
1 Cointegrating Equation(s): Log likelihood 102.4326
|
|
Normalized cointegrating coefficients (standard error in
parentheses)
|
|
CP
|
GDP
|
M2
|
|
|
|
1.000000
|
1.306303
|
-1.713172
|
|
|
|
(0.34947)
|
(0.20415)
|
|
|
|
Adjustment coefficients (standard error in parentheses)
|
|
|
D(CP)
|
0.140787
|
|
|
|
|
(0.06835)
|
|
|
|
|
D(GDP)
|
-0.047233
|
|
|
|
|
(0.02441)
|
|
|
|
|
D(FD)
|
0.216637
|
|
|
|
|
(0.04508)
|
|
|
|
|
2 Cointegrating Equation(s): Log likelihood 103.7002
|
|
Normalized cointegrating coefficients (standard error in
parentheses)
|
|
CP
|
GDP
|
FD
|
|
|
|
1.000000
|
0.000000
|
-0.712449
|
|
|
|
|
(0.61835)
|
|
|
|
0.000000
|
1.000000
|
-0.766072
|
|
|
|
|
(0.47572)
|
|
|
|
Adjustment coefficients (standard error in parentheses)
|
|
|
D(CP)
|
0.080882
|
0.248568
|
|
|
|
(0.07840)
|
(0.09776)
|
|
|
|
D(GDP)
|
-0.057983
|
-0.050097
|
|
|
|
(0.02857)
|
(0.03563)
|
|
|
|
D(FD)
|
0.222195
|
0.276995
|
|
|
|
(0.05309)
|
(0.06620)
|
|
|
A3 vector Autoregression Estimates
|
Vector Autoregression Estimates
|
|
|
Date: 09/06/12 Time: 11:16
|
|
|
Sample (adjusted): 1971 2010
|
|
|
Included observations: 40 after adjustments
|
|
Standard errors in ( ) & t-statistics in [ ]
|
|
GDP
|
CP
|
FD
|
|
GDP(-1)
|
0.965886
(0.05650)
[ 17.0957]
|
0.243011
(0.15534)
[ 1.56440]
|
0.293759
(0.10513)
[ 2.79437]
|
|
CP(-1)
|
-0.054680
(0.03062)
[-1.78580]
|
1.079734
(0.08418)
[ 12.8258]
|
0.225660
(0.05697)
[ 3.96086]
|
|
FD(-1)
|
0.081135
(0.04281)
[ 1.89506]
|
-0.248549
(0.11771)
[-2.11150]
|
0.631017
(0.07966)
[ 7.92114]
|
|
C
|
0.865941
(1.52758)
[ 0.56687]
|
-6.172351 (4.19993) [-1.46963]
|
-7.562115
(2.84233)
[-2.66054]
|
|
R-squared
|
0.931321
|
0.899022
|
0.897710
|
|
Adj. R-squared
|
0.925598
|
0.890607
|
0.889186
|
|
Sum sq. resids
|
0.143120
|
1.081871
|
0.495495
|
|
S.E. equation
|
0.063052
|
0.173355
|
0.117319
|
|
F-statistic
|
162.7258
|
106.8380
|
105.3140
|
|
Log likelihood
|
55.90150
|
15.44621
|
31.06402
|
|
Akaike AIC
|
-2.595075
|
-0.572311
|
-1.353201
|
|
Schwarz SC
|
-2.426187
|
-0.403423
|
-1.184313
|
|
Mean dependent
|
27.37380
|
2.215064
|
2.566628
|
|
S.D. dependent
|
0.231156
|
0.524134
|
0.352429
|
|
Determinant resid covariance (dof adj.)
|
1.53E-06
|
|
|
Determinant resid covariance
|
1.12E-06
|
|
|
Log likelihood
|
103.8142
|
|
|
Akaike information criterion
|
-4.590710
|
|
|
Schwarz criterion
|
-4.084046
|
|
A4 Vector error Correction Estimates
|
Vector Error Correction Estimates
Date: 08/16/12 Time: 22:31
Sample (adjusted): 1971 2010
Included observations: 40 after adjustments Standard errors in (
) & t-statistics in [ ]
|
|
Cointegrating Eq:
|
CointEq1
|
|
|
GDP(-1)
|
1.000000
|
|
|
CP(-1)
|
0.765519
(0.14499)
[ 5.27997]
|
|
|
FD(-1)
|
-1.311466
(0.20636)
[-6.35514]
|
|
|
C
|
-25.71474
|
|
|
Error Correction:
|
D(GDP)
|
D(CP)
|
D(FD)
|
|
CointEq1
|
-0.061700
(0.03189)
[-1.93501]
|
0.183910
(0.08928)
[ 2.05985]
|
0.282994
(0.05889)
[ 4.80530]
|
|
C
|
0.018184
(0.00979)
[ 1.85806]
|
0.020999
(0.02740)
[ 0.76631]
|
0.034749
(0.01808)
[ 1.92244]
|
|
R-squared
|
0.089695
|
0.100443
|
0.377976
|
|
Adj. R-squared
|
0.065740
|
0.076770
|
0.361607
|
|
Sum sq. resids
|
0.145582
|
1.141404
|
0.496608
|
|
S.E. equation
|
0.061896
|
0.173312
|
0.114318
|
|
F-statistic
|
3.744264
|
4.242996
|
23.09087
|
|
Log likelihood
|
55.56039
|
14.37487
|
31.01913
|
|
Akaike AIC
|
-2.678019
|
-0.618744
|
-1.450957
|
|
Schwarz SC
|
-2.593575
|
-0.534300
|
-1.366513
|
|
Mean dependent
|
0.018184
|
0.020999
|
0.034749
|
|
S.D. dependent
|
0.064037
|
0.180374
|
0.143077
|
|
Determinant resid covariance (dof adj.)
|
1.40E-06
|
|
|
Determinant resid covariance
|
1.20E-06
|
|
|
Log likelihood
|
102.4326
|
|
|
Akaike information criterion
|
-4.671629
|
|
|
Schwarz criterion
|
-4.291632
|
|
Acknowledgment
Acknowledgment
| 

