Financial development and economic growth: evidence from Niger( Télécharger le fichier original )par Oumarou Seydou Xiamen University - Master of Economics Applied Finance 2012 |

Chapter 3 Empirical AnalysisMacroeconomic performance in Niger has been quite poor over the years and real GDP varied between 1970 and 2010. In this chapter variables of the study are described, data are analyzed and results validated empirically. Initially, the presence of unit root is enquired before determination of Cointegration. After Cointegration between the variables was established the existence of long run equilibrium relationship was confirmed. Finally, a Vector Error Correction technique was employed to examine the short and long run dynamics with the help of Eviews 7.1 Software. 3.1 Data and Description of Variables3.1.1 DataAnnual time series data were used from 1970 - 2010. The data was collected from the International Financial Statistics (IFS) and World Bank Development Indicators (WDI) databases ( http://www.imf.org/external/data.htm; http://data.worldbank.org ). 3.1.2 Economic Growth IndicatorUnlike Levine (2000) who used real GDP per capita in measuring economic growth, herein, real GDP was used as a proxy for economic growth because the population growth rate of Niger is higher than the GDP growth; such that dividing the real GDP by the population does not reflect the growth of the country. This variable would reflect the evolution of the economic development. Note that this indicator reflects the economic health of a country and its ability to finance domestic investment. Therefore the natural logarithm of real GDP is used as indicator of economic growth denoted by (GDP). 3.1.2 Financial Development IndicatorsBased on Niger's situation and availability of data, two variables were successively selected to measure financial development, which are the ratio M2 divided by GDP denoted FD and credit to the private sector also divided by GDP denoted by CP. The ratio of credit to the private sector to GDP has been designed as an indicator of financial intermediation. The higher this ratio is, the larger the volume of credit lending to the private sector. Additionally, credit to private sector to GDP as a proxy of financial development indicates not only a high level of domestic investments, but also a high development of the financial system. Furthermore, Financial deepening (FD) is designed as an indicator to capture the evolution of the liquidity of the economy. Moreover, Demetriades and Hussein (1996), King and Levine (1993) used this variable to measure the development of the financial sector. Increase in FD corresponds to increase in liquidity of the economy. The sign of FD was expected to be positive because the more liquid an economy is, the more opportunities exists for continued and sustainable growth. However, the sign for credit to the private sector to GDP (CP) may be ambiguous; allocation of non-performing credits may be a source of crises for banks as well as the economy and thus relate negatively to growth. On the other hand, it may be positively correlated with GDP if credits are deployed efficiently; []. Therefore, the logarithm of CP and FD were used as financial development indicators. The Figures below illustrate each series in log levels of the variables as well as the first differences of the logs. As indicated in Figure 3.1, each series appears to be nonstationary. Whereas the first differences of the logs of the series in Figure 3.2 have stationary appearance.
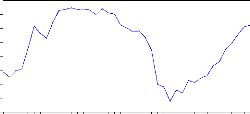
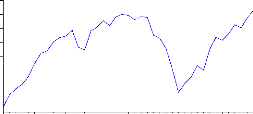
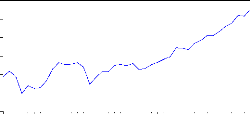
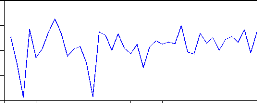
Figure 3.1: Trend of individual variables GDP, FD, and CP in log level The variables fluctuate over the years. The CP appears to decrease from 1970 up 1972, then increase abruptly in CP 1975. It then fell in 1978 and picked to a maximum in 1979.
Thereafter, it decrease steadily in 1997 and finally FD 1994, then decreased to 1997 and finally increased in 2010. The GDP increased from 1970 to 1971, decreased in 1973, then increased steadily to 1979 and then dropped in 1984.Thereafter,it increased till 2010. GDP
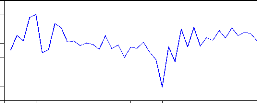
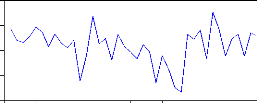
Figure 3.2: Log first differences of individual
variables 1980 1985 1990 1995 2000 2005 200 and dropped 1995.Thereafter it fluctuates steadily till 2010.
The trend of DGDP decreased from 1970 to 1972, and DGDP Finally, it fluctuates steadily from 1985 to 2010 even though it decreased in some years. The DFD decreased from year 1970 to 1972, and then increased litter in 1975.Thereafter decreased from 1980 to 1983 and picked up from 1983 to 1985. It then decreased slightly up 1999. From 1999 it increased sharply to 2004 then dropped till 2010. Below are descriptive statistics at the level and the first difference of the variables. Table 3.1 Descriptive statistic of the variables
N.B: There were 41 observations from 1970-2010. Table 3.2 Descriptive statistic of the first difference of the Variables
N.B: There were 40 observations. |
|