![]()
Tableau n°2.1 : Base de
données
|
ANNÉES
|
IDE
|
PIBH
|
TO
|
CD
|
TI
|
DS
|
TC
|
|
1975
|
1,89
|
276,67
|
40,46
|
20,33
|
0,4
|
0
|
0,0047
|
|
1976
|
2,45
|
271,67
|
37,85
|
17,86
|
13,5
|
0
|
0,0042
|
|
1977
|
3,13
|
277,46
|
39,2
|
17,08
|
5,2
|
0
|
0,0041
|
|
1978
|
0,75
|
273,08
|
41,41
|
19,17
|
5,9
|
0
|
0,0044
|
|
1979
|
3,57
|
282,42
|
50,63
|
18,59
|
14,1
|
0
|
0,0047
|
|
1980
|
4,32
|
292,32
|
54,78
|
23,52
|
14,4
|
0
|
0,0047
|
|
1981
|
2,09
|
311,06
|
54,48
|
19,50
|
15,8
|
0
|
0,0037
|
|
1982
|
-0,01
|
307,36
|
40,42
|
27,78
|
22,3
|
0
|
0,003
|
|
1983
|
0,01
|
283,99
|
31,06
|
31,70
|
4,6
|
0
|
0,0026
|
|
1984
|
0,01
|
296,15
|
32,19
|
28,63
|
2
|
0
|
0,0023
|
|
1985
|
-0,09
|
307,9
|
36,44
|
32,13
|
-6,9
|
0
|
0,0022
|
|
1986
|
1,1
|
304,47
|
29,56
|
30,37
|
-1,5
|
0
|
0,0029
|
|
1987
|
0,1
|
290,46
|
27,75
|
29,12
|
0,8
|
0
|
0,0033
|
|
1988
|
0
|
290,88
|
25,49
|
29,85
|
1,9
|
0
|
0,0034
|
|
1989
|
62,1
|
273,39
|
22,38
|
21,06
|
1,8
|
0
|
0,0031
|
|
1990
|
62,38
|
272,59
|
25,88
|
22,38
|
1,6
|
1
|
0,0037
|
|
1991
|
120,78
|
275,3
|
27,17
|
14,75
|
0,7
|
1
|
0,0035
|
|
1992
|
77,57
|
275,84
|
30,06
|
13,20
|
3,3
|
1
|
0,0038
|
|
1993
|
1,4
|
275,06
|
29,07
|
9,33
|
1,1
|
1
|
0,0035
|
|
1994
|
13,65
|
276,9
|
21,85
|
11,68
|
33,6
|
1
|
0,0018
|
|
1995
|
13,33
|
279,94
|
24,84
|
11,74
|
15,5
|
1
|
0,002
|
|
1996
|
35,52
|
286,18
|
23,21
|
10,84
|
6,6
|
1
|
0,0019
|
|
1997
|
27,02
|
294,73
|
22,56
|
7,41
|
4,7
|
1
|
0,0017
|
|
1998
|
37,95
|
299,18
|
22,38
|
6,88
|
5,5
|
1
|
0,0017
|
|
1999
|
40,69
|
304,07
|
22,49
|
6,80
|
1,4
|
1
|
0,0016
|
|
2000
|
59,74
|
311,99
|
21,65
|
8,46
|
3,3
|
1
|
0,0014
|
|
2001
|
43,86
|
317,37
|
21,54
|
4,56
|
3,1
|
1
|
0,0013
|
|
2002
|
13,51
|
321,08
|
20,74
|
5,81
|
2,5
|
1
|
0,0014
|
|
2003
|
44,73
|
322,88
|
20,35
|
9,77
|
1,5
|
1
|
0,0017
|
|
2004
|
63,84
|
322,26
|
19,93
|
6,71
|
0,9
|
1
|
0,0019
|
|
2005
|
53,04
|
321,21
|
20,23
|
7,06
|
5,37
|
1
|
0,0019
|
|
2006
|
63
|
324,1
|
19,82
|
6,78
|
3,78
|
1
|
0,0019
|
|
2007
|
59,12
|
324,4
|
19,71
|
7,23
|
1,3
|
1
|
0,0021
|
|
2008
|
58,7
|
325,3
|
19,57
|
7,51
|
7,96
|
1
|
0,0022
|
Sources : Banque Mondiale ;
INSAE ; Services Nationaux d'Etat.
Tableau n° 2.2 : Estimation du modèle de
long terme
|
Dependent Variable: IDE
|
|
Method: Least Squares
|
|
Date: 09/19/09 Time: 18:41
|
|
Sample(adjusted): 1976 2008
|
|
Included observations: 33 after adjusting endpoints
|
|
Variable
|
Coefficient
|
Std. Error
|
t-Statistic
|
Prob.
|
|
C
|
-259.7417
|
81.86015
|
-3.172993
|
0.0041
|
|
PIBH(-1)
|
0.600985
|
0.226495
|
2.653413
|
0.0139
|
|
TO(-1)
|
-1.129478
|
0.613428
|
-1.841255
|
0.0780
|
|
CD(-1)
|
1.824118
|
0.573967
|
3.178086
|
0.0040
|
|
TI(-1)
|
-0.396848
|
0.406933
|
-0.975217
|
0.3392
|
|
DS
|
86.58042
|
13.92544
|
6.217428
|
0.0000
|
|
TC(-1)
|
25706.69
|
5551.889
|
4.630261
|
0.0001
|
|
D93
|
-77.71639
|
16.25042
|
-4.782424
|
0.0001
|
|
D94
|
-52.21753
|
16.11728
|
-3.239848
|
0.0035
|
|
R-squared
|
0.836835
|
Mean dependent var
|
29.37455
|
|
Adjusted R-squared
|
0.782447
|
S.D. dependent var
|
31.05416
|
|
S.E. of regression
|
14.48447
|
Akaike info criterion
|
8.411031
|
|
Sum squared resid
|
5035.194
|
Schwarz criterion
|
8.819170
|
|
Log likelihood
|
-129.7820
|
F-statistic
|
15.38632
|
|
Durbin-Watson stat
|
2.636317
|
Prob(F-statistic)
|
0.000000
|
Tableau n° 2.3 : Estimation du modèle de
court terme
|
Dependent Variable: DIDE
Method: Least Squares
Date: 09/04/09 Time: 08:49
Sample(adjusted): 1977 2008
Included observations: 32 after adjusting endpoints
|
|
Variable
|
Coefficient
|
Std. Error
|
t-Statistic
|
Prob.
|
|
C
|
2.041266
|
2.660299
|
0.767307
|
0.4511
|
|
DPIBH(-1)
|
0.560200
|
0.421681
|
1.328491
|
0.1976
|
|
DTO(-1)
|
-0.198614
|
0.844909
|
-0.235071
|
0.8163
|
|
DTC(-1)
|
8672.245
|
7074.248
|
1.225889
|
0.2332
|
|
DCD(-1)
|
2.849082
|
0.794326
|
3.586790
|
0.0016
|
|
DTI(-1)
|
-0.167911
|
0.298627
|
-0.562278
|
0.5796
|
|
DDS
|
81.82133
|
19.33329
|
4.232148
|
0.0003
|
|
R(-1)
|
-1.348871
|
0.217578
|
-6.199490
|
0.0000
|
|
D93
|
-76.79042
|
13.32679
|
-5.762111
|
0.0000
|
|
D94
|
23.70728
|
13.52495
|
1.752855
|
0.0936
|
|
R-squared
|
0.812160
|
Mean dependent var
|
1.757813
|
|
Adjusted R-squared
|
0.735317
|
S.D. dependent var
|
24.63445
|
|
S.E. of regression
|
12.67377
|
Akaike info criterion
|
8.167253
|
|
Sum squared resid
|
3533.740
|
Schwarz criterion
|
8.625296
|
|
Log likelihood
|
-120.6761
|
F-statistic
|
10.56902
|
|
Durbin-Watson stat
|
1.917199
|
Prob(F-statistic)
|
0.000004
|
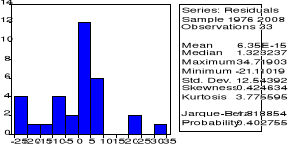
Graphique n°2. 1 : Test de
normalité des erreurs de long terme
Graphique n° 2.2 : Test de
normalité des erreurs de court terme
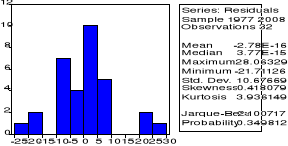
Tableau n°2. 4 : Test de
Co-intégration des variables
|
Date: 09/04/09 Time: 14:08
Sample: 1975 2008
Included observations: 32
Test assumption: No deterministic trend in the data
Series: IDE TC TO TI CD DS PIBH
Lags interval: 1 to 1
|
|
Likelihood
|
5 Percent
|
1 Percent
|
Hypothesized
|
|
Eigenvalue
|
Ratio
|
Critical Value
|
Critical Value
|
No. of CE(s)
|
|
0.828140
|
176.3611
|
109.99
|
119.80
|
None **
|
|
0.772970
|
120.0067
|
82.49
|
90.45
|
At most 1 **
|
|
0.698503
|
72.56115
|
59.46
|
66.52
|
At most 2 **
|
|
0.419919
|
34.19331
|
39.89
|
45.58
|
At most 3
|
|
0.286117
|
16.76651
|
24.31
|
29.75
|
At most 4
|
|
0.138041
|
5.981366
|
12.53
|
16.31
|
At most 5
|
|
0.037643
|
1.227844
|
3.84
|
6.51
|
At most 6
|
*(**) denotes reject on of the hypothesis at 5%(1%)
significance level
L.R. test indicates 3 cointegrating equation(s) at 5%
significance level
Tableau n° 2.5 : Test d'auto
corrélation des erreurs du modèle de long terme
|
Breusch-Godfrey Serial Correlation LM Test:
|
|
F-statistic
|
2.406679
|
Probability
|
0.113445
|
|
Obs*R-squared
|
5.923943
|
Probability
|
0.051717
|
Tableau n° 2.6 : Test d'auto
corrélation des erreurs du modèle de court terme
|
Breusch-Godfrey Serial Correlation LM Test:
|
|
F-statistic
|
0.034595
|
Probability
|
0.966054
|
|
Obs*R-squared
|
0.110323
|
Probability
|
0.946332
|
Tableau n° 2.7 : Test
d'hetéroscédasticité des résidus du modèle
de long terme
|
White Heteroskedasticity Test:
|
|
F-statistic
|
2.057963
|
Probability
|
0.074317
|
|
Obs*R-squared
|
19.29614
|
Probability
|
0.114204
|
Tableau n° 2.8 : test
d'hetéroscédasticité des résidus du modèle
de court terme
|
White Heteroskedasticity Test:
|
|
F-statistic
|
0.495245
|
Probability
|
0.909331
|
|
Obs*R-squared
|
10.14644
|
Probability
|
0.810429
|
|
|


