PEOPLE'S DEMOCRATIC REPUBLIC OF ALGERIA
Ministry of Higher
Education and Scientific Research
|
M'Hamed Bougara University
Faculty of Hydrocarbons
and Chemistry
|
|
Department of Hydrocarbon Transportation and
Equipment
Master Degree Dissertation
Field : Technical Sciences
Sector :
Hydrocarbons
Specialty : Mechanical
Engineering
Option : Oil Fields Mechanics
Presented by: CHEMAA Khaled
CHABANI Yacine
THEME:
Study of tribological properties of titanium-based thin
films applied to the rubbing parts of internal combustion
engines piston
Defended publicly on the 07/04/2017
Before the jury:
Gaceb Mohamed (Professor UMBB) President of the jury
Gaceb Mohamed (Professor UMBB) Framer
Hassani Salim (Research Fellow CDTA) Co- framer
Examiners member:
Benbrik Abderrahmane (Professor UMBB) Examener
Harhout Riyad (Assistant Professor UMBB) Examener
Boumerdes 2017
«Allah will raise up to
ranks, those of you
who believe and who
have been granted
Knowledge»
The Holy Quran [58:11]
II
Acknowledgement
Acknowledgement
First of all we want to thank the almighty Allah for the
blessing of health, knowledge and reason, and for huge opportunities gave us
during our lifetime;
We want to thank our parents for the great sacrifices they made
for us;
One of the biggest opportunities of Allah is that he made us
studying in the faculty of hydrocarbons and chemistry of BOUMERDES (ex-INHC),
where we had the pleasure of meeting great people, who sacrifice by their
money, their time and fight just to make that historical monument (which was
created in 1964) rise again despite the huge difficulties. People like Pr. M.
TAIBI, Pr. S. AISSANI, Dr. A. GUEBLI, Pr. A. ABBASSOV, Pr. A. BENBRIK, Mr. T.
HACHEMI Pr. A. BLAIDI and others, taught us indirectly what a man can do when
he has the great will and the good well to change his surrounding society;
We want to thank, particularly Pr. M. GACEB our dissertation
framer, and our honorable professor, first of all because he awakened us when
we were in a deep sleep, then he guided and helped us (and anyone who seek for
knowledge and they are few) with everything he can for the sake of science, we
wish him good health to help our successors for years to come;
We want to thank Dr. S. HASSANI our dissertation co-framer and
the responsible of Laser and Ionized Medium at the CDTA center, it was a great
opportunity to work with someone who have such a knowledge, despite the short
the time which didn't allow us to learn more from his great knowledge and
experience;
We want to thank all people who help us to fulfil our
dissertation, beginning by Pr. Abdi from the Mechanical Engineering Department
of the USTHB who allowed us to use their tribometer, our professor Dr. A.
GUEBLI who enriched us with his valuable advice, Mr. DRISS of CDTA Center who
helped us with the thin film deposition process, and all the CDTA members and
staffs;
|
ìáÇ
ÉÇÖáÅÇÈ ÇÏÌ
|
ÉíáÇÚ
ÉíáÚÇÊæ
|
ÉãÇå
ÉíÚæä ÉíÍØÓ
ÉÍÇÓã
ßáÊãÊ
|
ÉÞíÞÑáÇ
|
ÉíÔÛáÇ
|
ÉíÑÊãæäÇäáÇ
|
|
äã:ÕÎáã
ÇÞáÇØäÇ
|
.ÇÏÌ
ÉÒíãã
ÉíäæÑÊßáÅ æ
ÉíÑÕÈ æ
ÉíßíäÇßíã
ÕÆÇÕÎ
|
ÁÇÑÊåáÇÇæ
ßÇßÊÍáÇÇ äÚ
ÉÌÊÇäáÇ
ÑÆÇÓÎáÇ
|
äã
|
ÏÍáÇÈ
ÍãÓÊ
íáÎÇÏáÇ
ÞÇÑÊÍáÇÇ
ÊÇßÑÍã
ÉÚÇäÕ í
ÇíÌæáæäßÊáÇ
|
åÐå
|
ÞíÈØÊ
|
|
.ááÇÛÊÓáÇÇ
|
æ
|
ÌÇÊäáÅÇ
ÉáÍÑã
|
í
|
ÁÇæÓ
|
ÉáßÊáÇ
|
ìáÚ
|
ÑÔÇÈã
|
áßÔÈ ÑËÄí
Çãã
ÉáãÚÊÓãáÇ
ÏÇæãáÇ äã
ÑÏÞ áÞÈ ßáÐæ
|
ÇåÏÇÚÈ
III
.íáÎÇÏáÇ
ÞÇÑÊÍáÇÇ
ÊÇßÑÍã
ÓÈÇßãáÇ
ÉíßÇßÊÍÇ
ÕÆÇÕÎ
ÑÇÎÈáá
íÆÇíÒíáÇ
ÈíÓÑÊáÇ
ÉÞíÞÑáÇ
ÉíÔÛáÇ
:ÉíÍÇÊã
ÊÇãáß
Abstract:
Because of their nanometric dimensions, thin films have a
very high specific, a very high reactivity and exceptional mechanical, optical
and electronic properties.
The application of this technology in the internal
combustion engine industry reduces losses of friction and wear with a low loss
of material, which directly influences on the cost, whether during production
phase or during the service.
Keywords: Thin film, physical vapor deposition (PVD),
tribological properties, pistons, internal combustion engines.
Résumé:
De par leurs dimensions nanométriques, les
couches minces présentent une très grande surface
spécifique, une réactivité très
élevée et des propriétés mécaniques,
optiques et électroniques exceptionnelles.
L'application de cette technologie en industrie des
moteurs à combustion interne permet de réduire les pertes par
frottement et usure avec une faible perte de matière ce qui influencer
directement sur le coût, que ce soit a la phase de production ou de
l'exploitation.
Mots clés: Couche mince, dépôt
physique en phase vapeur (PVD), propriétés tribologiques,
pistons, moteurs à combustion interne.
IV
List of symbols
List of symbols
??: Coefficient of linear expansion, Degree of ionization ratio,
Stricking coefficient;
????: Melting temperature;
??: Thermal conductivity, mean free path, the wavelength;
??: Density;
????: Electrical resistivity;
??: Stresse;
u: Poisson's ratio;
??: Constant of friction;
w: Wave frequency;
?? : Molecular diameter;
A: Area;
A%: Breaking elongation;
B : Number of intermolecular impacts;
D??: Distance;
E: Modulus of elasticity; E??: Kinetic energy;
E??: Dissipated energy;
F: Force, load;
??: Rate of return of energy;
h: Planck constant;
H: hardness;
HB: Brinell hardness;
HV: Vickers hardness;
icorr : Corrosion current density;
k : Boltzmann constant;
????: Knusden number;
??: Molecule mass;
N: Molecules number;
?? : Number density of the molecules;
??: Pressure;
??0 : The pressure at the initial instant;
????: Saturated vapor pressure;
Q: Mass flow rat;
??: Radius;
??: Radius of the wear track;
????: Breaking strength;
Re, Re0.2: Yield strength;
??: Time;
T : Temperature;
V
List of symbols
??: Rate of propagation of pits, molecules speed; ?? : The
volume;
v??2 : The-root-mean-square speed of molecules; ????:
The most probable speed of molecules; W??: Wear rate;
VI
Books list
[1] Aide-mémoire Science Des Matériaux, Michel
DUPEUX, Dunod 2008;
[2] Aide-mémoire Métallurgie, Guy MURRY, Dunod
2010;
[3] Aluminum Alloys: Structure and Properties, L. F. MONDOLFO,
Butterworths London, Boston 1976;
[4] Caractérisation par spectrométrie Raman?
Sébastien REYMOND-LARUINAZ, université de bourgogne;
[5] corrosion aspects cinétiques de la corrosion,
Université du sud Toulon-Var- institut des sciences de
l'ingénieur de Toulon et du var;
[6] Dépôts physiques : techniques, microstructure
et propriétés, Lech PAWLOWSKI, Presses Polytechniques Et
Universitaires Romandes 2003;
[7] Introduction à la Diffraction par Rayon X, Simon
HAZIZA and Emmanuelle DELEPORTE, école normale supérieure
paris-Saclay;
[8] Lubrifiant et fluids pour l'automobile, AYEL, M.BORN, French
oil institute,Technip edition;
[9] Nanomatériaux, traitement et fonctionnalisation des
surfaces, Jamal TAKADOUM, Lavoisier 2008.
[10] Physique Des Plasmas Collisionnels, Michel MOISA, CNRS
Éditions 2006;
[11] Physique des plasmas tome 1, Jean-Loup DELCROIX, CNRS
Éditions 1994;
[12] Pistons and engine testing, MAHLE GMBH, springer vieweg -
Stuttgart Germany;
[13] Techniques de l'Ingénieur : Traité
Matériaux Métalliques Aluminium et alliages d'aluminium
corroyés : propriétés métalliques, Roger
DEVELAY;
[14] Techniques de l'Ingénieur : Traité
Matériaux Métalliques Données numériques sur
l'aluminium non allié, Roger DEVELAY;
[15] Techniques de l'Ingénieur : Traité
Matériaux Métalliques Données Numériques sur les
Alliages d'Aluminium de Transformation, Roger DEVELAY;
[16] Techniques d'ingénieur : Traité
Matériaux Métalliques traitement de surface des métaux par
voix sèche et en milieu fondu, Sylvain AUDISIO;
[17] Techniques de l'Ingénieur, traité
Matériaux métalliques, Lubrification des surfaces lors de la mise
en forme, M 597, E. Felder;
[18] Traité des matériaux Tome 4 : Analyse des
surfaces, Collectif, Presses Polytechniques, Universitaires Romandes 2003;
[19] Traitements et revêtements de surface des
métaux, Robert LEVEQUE, Dunod 2007;
[20] Vide poussé au laboratoire et dans l'industrie, G.
GRIGOROV, Edition Masson & Cie 1970.
VII
References
References
[ABE 97] ABELMANN L., LODDER C., Oblique evaporation and
surface diffusion , Thin Solid Films, vol. 305,
1997;
[ALL84] ALLEN A., DUDLEY B.R., MIDDLETON V., PARKER D.A.,
Prediction of Piston Ring Cylinder Bore Oil
film Thickness in two Particular Engines and Correlation with
Experiment Evidence, Bulletin of the JSME,
1984, n° C 73174;
[AND02] ANDREETA E.R.M., RODRIGUES J.A., ANDREETA M.R.B.,
AGULLÓ-RUEDA F., HERNANDES A.C.,
Directional solidification of the Al2O3/GdAlO3 eutectic by
laser melting technique, Céramique vol.48
No.305 São Paulo Jan./Feb./Mar. 2002;
[BRO76] BROWN S R., HAMILTON G.M, Pressure Measurement between
the Rings and Cylinder Liner of an
Engine, Mechanical Engineering Publications, 1976;
[BUC67] BUCKLEY, NASA-TMX-52 279 Oct 1967;
[CHA 04] CHANG Y.Y., WANG D.Y., Corrosion behavior of CrN
coatings enhanced by niobium ion
implantation, Surface and Coatings Technology, vol. 188-189,
2004;
[CHE94] CHENR C.C., LIANG X.T., TSE W.S., CHEN I.Y., and DUH
J. G., Raman Spectra of Titanium Nitride
Thin Films, chinese jornal of physics APRIL 1994;
[CIE99] CIEMENS B. KUNG H. BARNETT S.A., Structure and
strength of multilayers, MRS Bulletin p20-26
février 1999;
[COU64] COURTEL R., métaux-corrosion-industrie
n°474-475 1964;
[DIT 91] DITCHBURN R.J., SMITH G.B., Useful angular
selectivity in oblique columnar aluminum, J. Appl.
Phys., vol. 69(6), 1991;
[DON94] DONG J., CHEN G., LUO X., CHEN L, and SHI Z.F., A new
concept formation of permeating layers
from noactive anti-wear additives, Lubr. Eng., 1994;
[DON 96] DONG L., SMITH R.W., SROLOVITZ D.J., A
two-dimensional molecular dynamics simulation of
thin film growth by oblique deposition, J. Appl. Phys., vol.
80(10), 1996;
[EUR/http]
http://www.euralliage.com/aluminium.html;
[EXP/http]
https://expertsdefaillances.com;
[FEN61] FENG I.M. and CHALK H., effect of gases and liquids in
the lubrication and surface damage, Wear,
1961;
[FOR70] FORBES E.S., The load carrying action of
organo-sulphur compounds-a review, Wear,
1970;
[FUR59] Furuhama S., A Dynamic Theory of Piston Ring
Lubrication, Bulletin of JMSE, V2, 07, 1959;
[FUR79] FURUHAMA S., TAKIGUCHI M., Measurement of Piston
Frictional Force in Actual Operating Diesel
Engine, SAE Transactions, 1979, n° 790855;
[GEO79] GEORGES J.M., MARTIN J.M., MATHIA T., KAPSA P., MEILLE
G. and MONTES H., Mechanism of
boundary lubrication with Zinc dithiophosphates, Wear,
1979;
[GER/http]
https://german.alibaba.com/product-detail/82mm-hatz-tractor-e780-enigne-piston-
60185120100.html;
[GRA08] GRAS René, tribologie, Dunod 2008;
[GRO71] GROSZEK A.J., Activation of iron surfaces by
chemisorption of some EP and anti-wear additives,
wear 1971;
[HOD 98] HODGKINSON I., Wu Q.H., MCPHUN A., Incremental-growth
model for the deposition of
spatially modulated thin film nanostructures, J. Vac. Sci.
Technol, vol. B16(5), 1998;
VIII
References
[HOL58] HOLM, J. F. ARCHARD, Wear 7, Elsevier 1958-1959;
[HOV 02] HOVSEPIAN P.E., MÛNZ W.D., Recent progress in
large-scale production of nanoscale
multilayer/superlattice hard coatings, Vacuum, vol. 69(1-3),
2002;
[HOV 05] HOVSEPIAN P.E., LEWIS D.B., Luo Q., FARINOTTI A.,
Corrosion résistance of
CrN/NbN superlattice coatings grown by various physical vapor
déposition techniques,
Thin Solid Films, vol. 488(1-2) 2005;
[IOP/http]
http://iopscience.iop.org/article/10.1088/2043-6262/2/3/035014;
[LIN 03a] LINTYMER J., Etude de l'influence de la
microstructure sur les propriétés mécaniques et
électriques de couches de chrome en zigzag
élaborées par pulvérisation cathodique, Thèse
n° 993,
université de Franche-Comté, France, 2003;
[LIN 04] LINTYMER J., MARTIN N., CHAPPE J.M., DELOBELLE P.,
TAKADOUM J., Influence of
zigzag microstructure on mechanical and electrical properties
of chromium multilayered thin films, Surf.
Coat. Technol., vol. 180-181, 2004;
[LIN 05] LINTYMER J., MARTIN N., CHAPPE J.M., DELOBELLE P.,
TAKADOUM J., Nanoindentation of
chromium zigzag thin films sputter deposited, Surf. Coat.
Technol, vol. 200, 2005;
[MAL 96] MALAURIE A., BESSAUDOU A., Numerical simulation of
the characteristics of the
différent metallic species falling on the growing film
in DC magnetron sputtering, Thin
Solid Films, vol. 286, 1996;
[MBI 95] MBISE G.W., NIKLASSON G.A., GRANQVIST C.G., Obliquely
evaporated Cr films with large angular
selectivity, J. Appl. Phys., vol. 77(6), p. 2816-2818,
1995;
[MES84] MESSIER R., GIRI A. P., and ROY R. A., Revised
structure zone model for thin film physical
structure, Journal of Vacuum Science & Technology A:
Vacuum, Surfaces, and Films, 1984;
[MOV69] MOVCHAN B.A., DEMCHISHIN A.V., Study of the structure
and properties of thick vacuum
condensates of nickel, titanium, tungsten, aluminum oxide and
zirconium dioxide, Fiz. Metal. Metallovcd,
vol. 28(4), 1969;
[MYE90] MYERS J.E., BORMAN G.L., MYERS P.S., Measurement of
Oil Film Thickness and Liner
Temperature at Top Ring Reversal in a Diesel Engine, SAE
Paper, 1990, n° 900813;
[PAN85] PANDAZARAS C., Modélisation théorique et
expérimentale du frottement segments-chemise,
Thèse Doc. Inge: Institut Supérieur des
Matériaux et de la Construction Mécanique, 1985;
[PAP98] PAPAY A.G., Antiwear and Extreme-pressure Additives in
Lubricants, Lubrication science, 1998;
[RAY 74] Raynal B., Les essais des moteurs à combustion
interne, IFP- ENSPM Edition
Aout 1974;
[RES/http]
https://www.researchgate.net/figure/261063964_fig3_Figure-3-Raman-Spectra-of-Tungsten-
Oxide-Nanowires;
[REI07] REINHARD C, EHIASARIAN A.P., HOVSEPIAN P.E., CrN/NbN
superlattice structured coatings with
enhanced corrosion résistance achieved by high power
impulse magnetron sputtering interface pre-
treatment, Thin Solid Films, vol. 515(7-8), 2007;
[RIC82] RICHEZ M.F., CONSTANTS B., WINQUISH K.,Theoretical an
Experimental Study of Ring-Liner
Friction (Proceeding of 9 the Leeds Lyon) Symposium on
Tribology and Traction, sep 1982;
[ROG61] ROGOWSKI A.R., Method of Measurement of the
Instantaneous Friction of Piston-Rings in a
Firing Engine, SAE Paper 1961, n°379F;
[SET 01] SETO M.W., DlCK B., BRETT M.J., Microsprings and
microcantilevers: studies of mechanical
response », J. Micromech. Microeng, vol. 11, 2001;
[TAI 92] TAIT R.N., SMY T., BRETT J.M., Structural anisotropy
in oblique incidence thin metal films, J. Vac.
Sci. Technol, vol. A(10)4,1992;
IX
References
[TAK08/A]Jamal Takadoum, Nanomatériaux, traitement et
fonctionnalisation des surfaces, p258; [TAK08/B] Jamal Takadoum,
Nanomatériaux, traitement et fonctionnalisation des surfaces, p257;
[TAN07] TANNOUS Johny, Lubrification par les composés
organo-soufrés en phase gazeuse : Approche de la lubrification dans la
coupe des métaux, thèse de doctorat Présentée
devant L'école centrale de Lyon 2007;
[THO 74] THORNTON J.A., Influence of apparatus geometry and
deposition conditions on the structure and topography of thick sputtered
coatings, J. Vac. Sci. Technol, vol. 11(4), 1974;
[THO77] THORNTON J.A. high rate thick film growth, annual rev. of
mater, sci., vol.7, p. 239-260, 1977; [TRO 03] TROFIMOV V.I., Morphology
évolution in a growing film, Thin Solid Films, vol. 428, 2003; [WHE78]
WHEELER D., X-ray photoelectron spectroscopic study of surface chemistry of
dibenzyl disulfide on steel under mild and severe wear conditions, Wear,
1978;
[WEI00] WEI H., LIUZ., YAOK., The influence of the incidence
energy of deposited particles on the growth morphology of thin films, Vacuum,
vol. 57, 2000.
[URA87] URAS H.M, Patterson (D), Effect of Some Pistons Variables
on Piston and Ring Assembly Friction, SAE Paper, 1987, n°870088;
X
Figures list
List of Figures
Fig.1.1 MAHLE GMBH-pistons and engine testing
2nd edition- springer vieweg - STUTTGART
GERMANY.
Fig.1.2 MAHLE GMBH - pistons and engine
testing 2nd edition-springer vieweg-STUTTGART
GERMANY.
Fig.1.3 MAHLE GMBH - pistons and engine
testing 2nd edition-springer vieweg-STUTTGART
GERMANY.
Fig.1.4 MAHLE GMBH - pistons and engine
testing 2nd edition-springer vieweg-STUTTGART
GERMANY.
Fig.1.5 MAHLE GMBH - pistons and engine
testing 2nd edition-springer vieweg-STUTTGART
GERMANY.
Fig.1.6 MAHLE GMBH - pistons and engine
testing 2nd edition-springer vieweg-STUTTGART
GERMAny.
Fig.1.7 MAHLE GMBH - pistons and engine
testing 2nd edition-springer vieweg-STUTTGART
GERMAny.
Fig.1.8 J.AYEL - M.BORN - lubrifiant et
fluids pour l'automobile- French oil institute- Technip
edition.
Fig.1.9 J.AYEL - M.BORN - lubrifiant et
fluids pour l'automobile- French oil institute- Technip
edition.
Fig.1.10 J.AYEL - M.BORN - lubrifiant et
fluids pour l'automobile- French oil institute- Technip
edition.
Fig.1.11 J.AYEL - M.BORN - lubrifiant et
fluids pour l'automobile- French oil institute- Technip
edition.
Fig.1.12
https://expertsdefaillances.com
Fig.1.13
https://expertsdefaillances.com
Fig.1.14
https://expertsdefaillances.com
Fig.2.1. Aluminum Alloys: Structure and
Properties / L. F. Mondolfo / BUTTERWORTHS LONDON-
BOSTON 1976
Fig.3.1. Vide poussé au laboratoire et
dans l'industrie
Fig.3.2. Traité des matériaux
Tome 4 : Analyse des surfaces
Fig.3.3. Techniques du vide/ Simone Cassette/
cours sur internet
Fig.3.4. Vide poussé au laboratoire et
dans l'industrie
Fig.3.5. Dépôts physiques :
techniques, microstructure et propriétés
Fig.3.6. Dépôts physiques :
techniques, microstructure et propriétés
Fig.3.7. Techniques d'ingénieur :
Traité Matériaux Métalliques traitement de surface des
métaux
par voix sèche et en milieu fondu
Fig.3.8. Techniques d'ingénieur :
Traité Matériaux Métalliques traitement de surface des
métaux
par voix sèche et en milieu fondu
Fig.3.9.
institut-numerique.org
XI
Figures list
Fig.3.10.
institut-numerique.org
Fig.3.11.
institut-numerique.org
Fig.3.12.
Institut-numerique.org
Fig.3.13.
Institut-numerique.org
Fig.3.14. Traité des matériaux
tome 4 : analyse des surfaces Fig.3.15. Traité des
matériaux tome 4 : analyse des surfaces Fig.3.16.
Traité des matériaux tome 4 : analyse des surfaces
Fig.3.17. Traité des matériaux tome 4 : analyse
des surfaces Fig.3.18. Traité des matériaux tome
4 : analyse des surfaces Fig.3.19. Nanomatériaux,
traitement et fonctionnalisation des surfaces
Fig.3.20. Nanomatériaux, traitement et
fonctionnalisation des surfaces
Fig.3.21. Nanomatériaux, traitement et
fonctionnalisation des surfaces
XII
Tables list
List of Tables
Table1.1. Lubrification par les composés
organo-soufrés en phase gazeuse : Approche de la lubrification dans la
coupe des métaux, Johny TANNOUS, Thèse de doctorat de
l'école centrale de Lyon, 2007
Table2.1. Aide-mémoire Science Des
Matériaux / Michel Dupeux / Dunod 2008 Table2.2.
Aide-mémoire Science Des Matériaux / Michel Dupeux /
Dunod 2008
Table2.3. Techniques de l'Ingénieur :
Traité Matériaux Métalliques Données
Numériques sur les
Alliages d'Aluminium de Transformation / Roger Develay
Table2.4. Techniques de l'Ingénieur :
Traité Matériaux Métalliques Données
Numériques sur les
Alliages d'Aluminium de Transformation / Roger Develay
Table2.5. Aluminum Alloys: Structure and
Properties / L. F. Mondolfo / BUTTERWORTHS
LONDON-BOSTON 1976
Table3.1. Vide poussé au laboratoire et
dans l'industrie
Table3.2. Traitements et revêtements de
surface des métaux
Table3.3. Handbook of chemical vapor
deposition
Table3.4. Techniques d'ingénieur :
Traité Matériaux Métalliques traitement de surface des
métaux par voix sèche et en milieu fondu
Table3.5. Dépôts physiques :
techniques, microstructure et propriétés
Table3.6. Nanomatériaux, traitement et
fonctionnalisation des surfaces
Table3.7. Traitements et revêtements de
surface des métaux
XIII
Table of Contents
Table of Contents
Acknowledgement II
|
Abstract
List of symbols
Books list
References
List of Figures
List of Tables
|
III
IV
VI
VII X XII
|
Table of Contents XIII
Introduction 01
Literature review 04
Chapter 1: Overview on engine's piston 06
1.1. Piston types 07
1.1.1. Pistons for four-stroke gasoline engines
07
1.1.2. Pistons for diesel engines 08
1.2. Different forms of wear 10
Chapter 2: Aluminum and its alloys 21
2.1. Property Of non-alloyed aluminum (1000 series)
22
2.2. Aluminum alloys 22
2.2.1. Different classes of aluminum alloys
23
2.2.2. Physical properties of aluminum alloys
23
2.2.3. Mechanical properties of aluminum alloys
23
2.2.4. Standards defining aluminum alloys 26
2.3. Aluminum-Silicon Alloys (4000 series)
28
XIV
Table of Contents
Chapter 3: Vapor deposition and thin layer
characterization techniques... 30
3.1. Physical bases of the vacuum technique...31
3.1.1. Vacuum and gaseous phase of the material... 31 3.1.2. Movement and speed
of gaseous
molecules..................................................................
32
3.1.3. Basics of vacuum
technology............................................................................................
34
3.1.4. Duration of evacuation process... 35
3.2. The theory of plasmas... 36
3.3. Coating in the vapor phase (PVD, CVD)... 37
3.3.1. Chemical vapor deposition (CVD) techniques... 38 3.3.2. Physical vapor
deposition processes (PVD)... 39 3.3.3. Physical mechanism of a thin layer
formation .................................................................. 41
3.3.4. Thin film morphology... 44
3.4. Methods of microstructural characterization...46
3.4.1. Chemical characterization methods... 47 3.4.2. Crystallographic
characterization techniques... 49 3.4.3. Microstructural characterization
methods... 50 3.4.4. Characterization of mechanical properties...
52
3.5. Properties of thin films deposits
56
Chapter 4: Experimental Procedures.... 57
4.1. Determination of the sample grade...
58
4.2. Preparation of samples... 59 4.2.1. Samples
Cutting... 60 4.2.2. Samples polishing... 60 4.2.3. Chemical cleaning...
60
4.3. Thin film elaboration process... 60
4.3.1. Description of PVD sputtering installation and
working parameters.............................. 61
4.3.2. Description of PVD evaporation installation and
working parameters........................... 62 4.4. X-ray diffraction...
64
4.4.1. Characteristics of the device... 64
4.4.2. Working Principle... 64 4.5. Raman
Spectroscopy... 65 4.6. Scanning electronic microscope (SEM)...66 4.7. The
nanoindentation... 67 4.8. The tribometer analysis... 69 4.9. Electrochemical
techniques... 71
4.9.1. Equipment... 71
4.9.2. Establishment of EVANS diagrams...
72
4.9.3. Diagram E=f (log/i): EVANS
Diagram..................................................................................
73
XV
Table of Contents
Chapter 5: Results and Analysis 75
5.1. Analysis of XRD results 76
5.2. Analysis of RAMAN results 78
5.3. Morphological analysis 81
5.4. Interpretation of nanoindentation results
82
5.5. Interpretation of tribometer results 87
5.5.1. The coefficient of friction 87
5.5.2. Wear Rate 91
5.6. Corrosion test results 93
Chapter 6: Solidworks mechanical analysis of the thin
layer 95
6.1. Initial data 97
6.2. Finite element analysis of the
sample....................................................................................
97
6.3. Analysis of the result 100
Conclusion 101
Appendices AI 1
Appendix I: nanoindentation charge-discharge curves AI
2
Appendix II: Nanoindentation results . AII 1
Introduction
2
Introduction
Introduction
The thin layer technology has developed with extreme rapidity
in the last two decades whether in terms of implementation technology or
industrial applications.
In mechanical industry, the objectives of thin films are
mainly to improve the corrosion or wear resistance, to reduce the coefficient
of friction, to modify the surfaces microstructure to improve their ability to
retain lubricants and to optimize the lubrication of the rubbing surfaces and
the improvement of the aesthetic qualities of the products.
In internal combustion engines, the current trend is to save
energy, that is to say, the reduction of fuel consumption for equal or higher
power levels. To do so it is necessary to reduce friction losses between
surfaces in contact and increase their durability.
Several studies have shown that friction losses represent the
major part of the energy consumption developed in an internal combustion engine
(15 to 20%). Piston skirt friction, segmentation and bearings constitute 66% of
total friction losses; Distribution (up to 20-25% at low rpm), crankshaft,
transmission and gearbox contributing to the rest. Beyond the aspects of
reducing friction and wear, reducing oil consumption and exhaust emissions
represent ambitious challenges.
In this work, we propose to apply a thin layer of Ti-W-N on
the piston skirt and the piston crown in order to increase the surface hardness
and its corrosion resistance and to reduce the coefficient of friction.
The present dissertation contains six chapters;
The first chapter gives a brief illustration of the role of
pistons technology, and the main degradations and problems observed in pistons.
In the second chapter we present the mechanical properties of aluminum alloys,
the alloys with which the pistons are generally manufactured. In the third
chapter we describe the different thin film deposition techniques, the
tribological properties of the Ti, W and N layers, and the main deposition
characterization techniques.
In chapter four we give the different experimental procedures
executed in CDTA center, starting with the research of the probable piston
grade used as substrates in our study, passing by the preparation of the
surfaces of the samples and the deposit installations, and arriving at the
characterization of the tribological properties of our Layer (by XRD, SEM,
Raman, nanoindentation, tribometer and corrosion tests).
3
Introduction
In chapter five, we give the experimental results obtained with
their interpretation.
The chapter six dedicated to a medialization of the thin layer,
using Solidworks software, and we make mechanical test on it, in order to a
better characterization of the layer.
4
Literature review
Literature review
Hardness of titanium base thin films
Hard coatings based on nitrides (TiN, CrN, AlTiN, etc.) or
carbonitrides (TiCN) for mechanical applications came on the market in the
mid-1980s. They are characterized by a high hardness (often higher than 20 GPa)
and by great chemical inertia.
The deposited TiN/ZrN coatings have a very high hardness (>
30 GPa), much higher than the individual hardnesses of TiN and ZrN. It is noted
that the hardness increases with the Zr content in the layers, which seems
logical because the hardness of the ZrN is higher than the hardness of the TiN
with the deposition installation and the conditions used. Another interesting
result is the increase in hardness with the decrease in the individual
thickness of the alternating layers.
TiAl(N,C,O) coatings exhibit a wear behavior considerably
superior to the traditional DLC coating.
Corrosion resistance
It is well known that PVD layers generally have a columnar
structure with numerous growth defects (porosities, grain boundaries,
structural defects, etc.); thus, they do not provide adequate protection of the
corrosion-sensitive substrates.
At present, the poor corrosion resistance offered by PVD
coatings requires, on sensitive substrates, the deposition of a relatively
thick electrochemically produced undercoat. The most commonly used solution is
chromium or galvanic nickel with thicknesses of the order of 5-20
ìm.
To further improve the corrosion resistance, a Pd-Ni deposit
is applied to the nickel before the final PVD deposition. This multi-layer
process provides much better corrosion resistance, in particular, since the
galvanic undercoat is much denser and does not have a columnar structure.
However, today, and due to environmental considerations in some countries,
there is an abandonment of galvanic coatings such as nickel, zinc, cadmium,
chromium, gold and many other metals and alloys, unfortunately impossible to
replace.
Other works describe the use of an ionic etching of Nb ions
carried out by cathodic arc on ferrous substrate before PVD deposition [CHA 04;
HOV 02, 05; REI07];
The TiAl(C,O) coatings represent an interesting improvement
compared to the traditional Ti(C,O), especially since there nanohardness is
close to 13 GPa. A SEM photograph shows a dense non-columnar and amorphous
microstructure of this type of coating. This amorphous microstructure is
particularly advantageous since it generally confers a higher resistance to
corrosion of the substrate by preventing the electrolytes from passing through
the coating by the intercolonial porosities.
5
Literature review
Thin films with oblique incidence and GLAD
technical
The properties of thin layers depend primarily on their
microstructure or their nanostructure. From the first experimental studies due
to MOVCHAN and DEMICHISHIN [MOV69] and also to THORNTON [THO 74], to the recent
structural models developed by simulation [ABE 97; MAL 96; TRO 03; WEI00], the
majority of this work was mainly focused on the operating conditions
influencing the morphology and structure of films deposited under normal
incidence. Very few have been dedicated to thin films prepared under oblique
incidence [DON 96; DIT 91; HOD 98; MBI 95; TAI 92].
All this work on the layers prepared under oblique incidence
converges towards the same observation: an enlargement of the spectrum of the
physicochemical properties of the deposited materials including their stress
state, their density, their optical, electrical and magnetic anisotropy,
etc.
The work of the teams of Brett and Robbie for the production
of thin films under oblique incidence and on fixed or mobile substrate, allows
the birth of a new technic: the GLAD technical: GLancing
Angle Deposition.
The property of the GLAD technique in generating columnar
architectures of various shapes at nanometric scales leads inevitably to
questioning the mechanical behavior of these nanostructured films. Indeed, the
structural shapes of some of these architectures (example: zigzags, spirals,
etc.) give extended mechanical characteristics with respect to a conventional
columnar structure.
Using the nanoindentation tests, the authors SETO et al [SET
01] clearly show that the helically-structured films have an elastic
deformability of a higher order of magnitude compared with conventional
columnar films.
Other studies on the elastic properties of GLAD films have
also been carried out by LINTYMER and al [LIN 03a, 04, 05] on inclined and
zigzag chrome layers. In particular, it has been demonstrated that the Young's
modulus of zigzag films can be changed from single to double playing only on
the number and size of the zigzags.
Economic considerations
It is customary to say that nanomaterials are expensive, but
it must be shown that nanomaterials are additives to be used in small
quantities, the cost per function can become minimal. For example, on a square
meter, a 10 ìm coating will weigh about ten grams, adding 1%
nanomaterial will lead to 100 mg of material, even with expensive material
(1000 € / Kg for example), the cost of the coating is 1 € / Kg, which
is negligible compared to the technical, technological and functional
contribution of the layers thus realized.
Then it can be deduced that the use of nanomaterials in
surface coatings is a technological reality, which is transforming itself more
and more into economic reality.
Chapter 1
Overview on engine's piston
7
Chapter 1: Overview on engine's piston
1.1. Piston types
1.1.1. Pistons for four-stroke gasoline engines:
Modern gasoline engines employ lightweight designs with
symmetrical or asymmetrical skirt profiles and potentially different wall
thicknesses for the thrust and antithrust sides. These piston types are
characterized by low weight and particular flexibility in the central and lower
skirt areas.
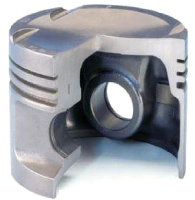
Fig.1.1: Autotermique piston
1.1.1.1. Controlled-expansion pistons
Controlled-expansion pistons are pistons with struts that
control thermal expansion. They are installed in gray cast iron crankcases. The
main target of controlled-expansion piston designs, and many inventions in this
field, was and still is to reduce the relatively large differences in thermal
expansion between the gray cast iron crankcase and the aluminium piston
We distinguish in this category the Autothermic pistons,
slotted at the transition from the piston crown to the skirt, at the height of
the oil ring groove. They are characterized by their particularly quiet running
behaviour.
The unalloyed steel struts cast in between the skirt and the
piston pin boss, together with the light alloy that surrounds them, form
control elements. They reduce the thermal expansion of the skirt in the
direction that is critical for the
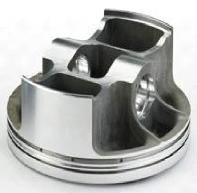
Fig.1.2: BOX-type piston
guiding of the piston in the cylinder.
1.1.1.2. Box-type pistons:
Compared with controlled-expansion pistons, this piston type
is characterized by its reduced mass, optimized support, and box-like, often
slightly oval skirt design. The box-type piston is compatible with both
aluminium and grey cast iron crankcases. With a flexible skirt design, the
difference in thermal expansion between the gray cast iron crank case and the
aluminium piston can be compensated very well in the elastic range. If the box
width is different on the thrust and antithrust sides, the piston is referred
to as an asymmetrical duct piston. Box-type pistons are cast or forged.
1.1.1.3. Forged aluminum pistons:
In engines with very high power densities--such as highly
loaded
turbocharged gasoline engines--cast pistons reach their
limits. Forged pistons are a particularly good fit for this area of
application; Figure 1.15. Their strength advantage in the temperature range of
up to about 250°C improves the load carrying capacity for lateral forces,
and increases the load carrying
8
Chapter 1: Overview on engine's piston
capacity of the pin bore and the fracture toughness. Forged
pistons are therefore especially well suited for high-speed concepts and
turbocharged engines. Because of the high ductility of the forged material,
they also react more tolerantly peak pressures that can arise if an engine is
operated very close to the knock limit. This allows lower ring land widths,
among other things, and therefore lower compression heights. Since the
manufacturing process is very stable, the forged pistons can be designed to the
limit in order to minimize component weight.
|
1.1.2. Pistons for diesel engines 1.1.2.1. Ring
carrier pistons
Ring carrier pistons; have been in use since 1931. The first
and at times even the second piston ring are guided in a ring carrier that is
securely joined to the piston material by metallic bonding.
The ring carrier is made of an austenitic cast iron with a
similar coefficient of thermal expansion to that of the piston material. The
material is particularly resistant to frictional and impact wear. The top ring
groove, which is the most vulnerable, and the piston ring inserted in it are
thereby effectively protected against excessive wear. This is particularly
advantageous at high operating temperatures and pressures, which are
particularly prevalent in diesel engines.
|
|
|
Fig 1.3: Ring carrier piston
|
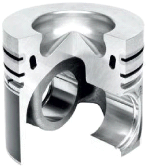
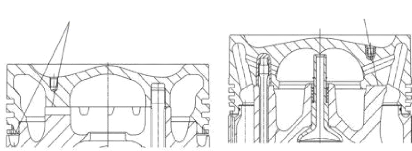
Fig.1.4: Ring carrier piston with cooling gallery
1.1.2.2. Cooling gallery pistons
The cooling gap inside the piston head is generally used to
optimize heat extraction. The high-speed collision of the engine oil on the
gallery surfaces improves the heat transfer capacity due to the impact caused
by the movement inside the cylinder. The heat flux removed by the cooling
gallery can reach 60% to 70% of the total heat transmitted to the piston by the
combustion gases, thereby effectively reducing the thermal loading of the
piston. When the engine is running, the cooling oil is injected from the oil
jet nozzle into the gallery through the inlet hole, flows in the
circumferential direction and exits the gallery through the exit hole, the
cooling oil does not fill the piston galley, the cooling oil exits the gallery
at high speed under the inertia of the movement
However, the structure of the cooling gallery limits to some
extent the resistance of the piston. With the steady increase in the maximum
pressure inside the diesel engine there is also the prolonged exposure of the
engine oil to higher temperatures in the piston cooling gallery which causes a
degradation of the characteristics of the lubricant which will not only affect
the piston but all engine components and carbon build-up, thereby reducing
cooling efficiency and resulting in overheating.
9
Chapter 1: Overview on engine's piston
|
1.1.2.3. Optimized monobloc steel
pistons:
This piston type is a single-piece forged steel piston that is
greatly weight optimized. With a small compression height (to less than 50% of
the cylinder diameter) and machining above the pin boss spacing (internal), the
piston mass, including the piston pin, almost corresponds to the mass of a
comparable aluminium piston with piston pin. In order to improve the piston
cooling, the outer cooling cavity is closed off by two cover plate halves. The
MONOTHERM® piston is used in passenger car and commercial
vehicle engines with peak cylinder pressures of up to 20 MPa.
1.1.2.4. Composite pistons
|
|
|
Fig.1.5: Optimized monobloc steel
piston
|
The composite piston enables the incorporation of cooling
cavities and the combination of the properties of various materials in one
piston. The performance range of four-stroke engines with composite pistons
extends from 500 to 30,000 kW, with up to 20 cylinders. Areas of application
include genets, main ship drives and auxiliary ship drives, and heavy
construction and railroad vehicles.
Here are many variants of composite pistons. Common to them
all is a design consisting of two main constituents: the piston crown with the
ring belt (upper part of piston) and the piston skirt with the piston pin boss
(piston skirt). The two parts are screwed together with appropriate threaded
fasteners
With two contact surfaces With one contact
surfaces
Fig. 1.6: Upper part of piston cooled by gallery (left) and
by orifice (right)
The upper part of the piston is made of forged steel, while
the piston skirt can be made from three distinct materials:
- Piston skirt made of forged aluminium-base
alloy, forged aluminium skirts, are suitable for low and medium peak
cylinder pressures, exhibit a low mass, and are easy to machine.
- Piston skirt made of nodular cast iron, Key
features of a composite piston with nodular cast iron piston skirt, Figure 1.6,
are low cold piston clearance and the resulting low secondary piston motion as
well as high seizure resistance.
10
Chapter 1: Overview on engine's piston
The casting process, in contrast to forged steel, allows for
undercuts and therefore a lighter design Superior to 200 bar. Compared with
pistons with aluminum skirts, however, the mass is increased as a result of the
higher material density.
- Piston skirt made of forged steel provides
ultrahigh component strength and, related to the process, a material with
extremely few defects. They are suitable for ultrahigh stresses greater than 24
MPa. Similar to pistons with nodular cast iron piston skirts, they provide the
advantage of low cold piston clearance, resulting in low secondary piston
motion.
1.2. Different forms of wear
Metal surfaces which are subjected to solid or fluid friction
in the presence or absence of a lubricant may be affected by wear patterns
which may range from regular, controllable wear (normal wear) to sudden
deterioration causing the failure of the mechanism.
Surface deterioration is an isolated or simultaneous
phenomenon classified into four basic forms: adhesive, abrasive, corrosive and
fatigue.
1.2.1. Adhesive wear
Adhesive wear or wear by metal - metal contact is the most
basic form of deterioration of surfaces. It is due to shear failure, during
friction, micro-welds or junctions formed instantaneously between the opposing
asperities of the two surfaces, in dry friction mode or in limited or mixed
lubrication. The formation of these welds, which is very localized, is favoured
by the thermal energy dissipated by friction, associated with very high contact
pressure.
According to its nature, the weld will be a true weld or "hot
weld", or a simple physical bond or "cold junction", therefore, depending on
the shear strength of the junction, shear breakage occurs inside the softest
metal or, on the contrary, at the junction.
The deterioration thus takes all forms ranging from severe
scratching to light scratching or soft adhesive wear (Figure 1.8.).
In the first case, the deterioration, in its most serious form
which is the seizure of the surface (Figure 1.7.), is characterized by metal
stripping, transfer of metal from the softest surface to the hardest surface,
(Burning) and the emission of relatively large dimensions (some ìm to
some hundred ìm) of metal wear particles.
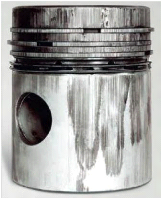
Fig .1.7: Piston seizure
11
Chapter 1: Overview on engine's piston
In the second case, the wear rate is very low and the wear
particles consist of very small fragments of metallic oxides of generally
lamellar shape (a typical dimension of the order of one to a few hundredths of
a im).
A The shear strength of the welds TS is
B The shear strength of the junctions
greater than the shear strength of the TS is less than the shear
strength of the
softest metal TB softest metal TB
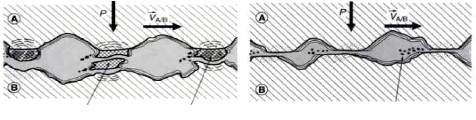
Wear particules Transferred fragments
Wear particules
|
The shear occurs inside the softest body B, an adhesive
transfer and severe wear.
? Large wear particles, a few im diameters
? Important friction called "internal" or by
welding
|
The shearing occurs at the junctions wear is moderate (soft
adhesive wear)
? Very small wear particles (oxides) about 10 nm diameters
? Low friction known as "external" or by shear
|
Fig.1.8: Mechanisms of adhesive wear: A) severe adhesive
wear - B) soft adhesive wear
In engines, adhesive wear mainly affects the components that come
into contact with each other, such as cylinder and cylinder piston.
The introduction of antifriction additives which act chemically
when the temperature of the contact rises, by attacking the metal in order to
convert it superficially into a self-lubricating, easily shearable film,
generally consisting of metal sulphides and phosphates.
1.2.2. Abrasive wear
Abrasion is a deterioration involving two phenomena
- A material removal from the surface by cutting;
- Plastic deformation of the surface (plowing) without ablation
of material.
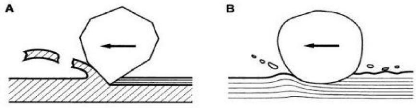
Fig. 1.9: Abrasion mechanisms: A) abrasion by cutting - B)
abrasion by plastic deformation
Chapter 1: Overview on engine's piston
The abraded surface thus loses metal in the form of micro
chips and is deeply modified by plastic deformation.
There are two types of abrasion:
- The two bodies abrasion caused by hard asperities or hard
particles embedded on one of the surfaces and wears the other surface;
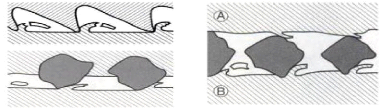
Two bodies HVA > HVB
Hard asperities or particles Three bodies
embedded on 1 of the 2 surfaces
and wears the other surface Abrasive grains conveyed
between the
two rubbing surfaces.
Fig.1.10: The types of abrasive wear
12
- The three bodies abrasion generated by free abrasive
particles (3rd bodies) conveyed between the friction surfaces, if the size of
these particles is equal to the thickness of the oil film, the abrasion is said
to be normal, it is manifested by scratches having the appearance of cutting
grooves. On the other hand, if the abrasive particles are very small, the
deterioration, whose size and appearance strongly depend on the angle of
incidence of the particles with respect to the surface, is called abrasive
erosion.
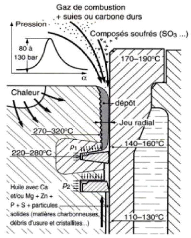
Fig.1.11. Diesel piston head deposit formation
Abrasive wear is countered by hardening of surfaces and
especially by efficient filtration of air (in engines) and oil.
Polishing wear of the cylinders of heavily loaded diesel
engines is a particular form of abrasive wear. The disappearance of the
machining lines by polishing the cylinder bore is due to the combined abrasive
actions of the carbon deposited on the piston crown (2-body abrasion) and the
solid particles carried by the oil (These deposits and sediments contain, in
greater or lesser quantity, microcrystals having a diameter of (0.1 to 0.5
ìm) of mineral salt, some of which are abrasive, resulting from the
interaction of the products of thermal degradation of the organometallic
additives of the oil.
13
Chapter 1: Overview on engine's piston
1.2.3. Corrosive wear
Corrosive wear is the friction removal of the reaction product
formed on the surfaces by chemical attack. Among these, we can site:
- Hydrochloric (HCl) and hydrobromic (HBr) acids, which
originate from the combustion of ethylene halides contained in the anti-knock
additive of leaded gasolines;
- Sulfuric acid (H2SO4), which comes from the cold
condensation of sulfuric anhydride (SO3) with the fuel combustion water in
engines operating with sulfur fuel, which is particularly the case for diesel
fuels.
- The organic acids coming from the partial oxidation of the
oil or the fuel, the shortest in length of organic chain are the most
corrosive. Corrosion is of particular concern when water and acids can condense
on metal surfaces, i.e. when the temperature of these walls is relatively low,
for corrosion to occur several conditions must be met:
- A corrodible metal (steel or antifriction alloy);
- A corrosive medium (aqueous electrolyte with a pH
sufficiently low to corrode the steel); - An intimate contact.
The corrosion can be eliminated by one of the following
methods:
- Elimination of sensitive metal (choice of a non-corrodible
alloy or an organic material);
- Placing a barrier between the metal and the medium;
In general, the first means of action is only rarely economically
or technically acceptable in the case
of internal combustion engines.
The second mean of action is specific to anti-rust and
anti-corrosion additives.
But the most useful way of protection is the coating (for more
information see the literature
review).
1.2.4. Fatigue wear
1.2.4.1. Fatigue fracture mechanism
By mechanical fatigue it is meant that the piston is subjected
to external variable loading. The resulting stress causes cracks to nucleate
and propagate in critical stressed areas. As shown in Fig 1.12, there are
mainly two stress critical areas where crack initiates: piston pin holes and
those regions on both sides of the bowl rim areas which are located on the same
vertical plane that contains the pin holes. It is also observed that there is
only one visible crack for mechanical fatigue.
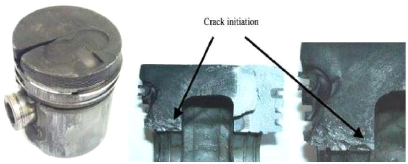
Fig.1.12: Gasoline engine piston with a crack from one side
of the pin hole to the head
14
Chapter 1: Overview on engine's piston
Under thermal fatigue, thermal gradients develop stress in two
ways. Thermal stresses due to the distribution of the temperature along the
vertical axis of piston - high temperatures at the top and lower temperatures
at the bottom - and that due to the different temperatures on the piston head
due to the flow of the hot air or fuel impingement. In the first case several
fatigue radial cracks over the whole piston head can be observed.
The cracks so formed gradually grow under the fatigue
conditions until it develops into a fracture on the crown. If severe enough,
fracture continues across the crown surface to have the piston sliced to
parts.
1.2.4.2. Fatigue damages to piston
Apart from piston crown, fatigue cracks are developed in other
parts of piston as well and it includes piston rings and piston skirt.
- Piston ring
As the wear on cylinder walls increases, clearance between the
piston and cylinder wall becomes high. Eventually, pressure acting on the ring
increases (because the ring comes out of the groove) and consequently stress
increase on the groove. The stresses at those fillet portions in the ring
groove seem to be sufficient to initiate fatigue cracks on the piston.
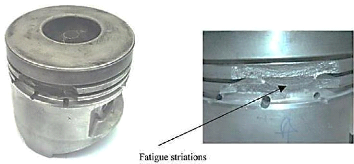
Fig .1.13: Engine piston with damaged grooves
In case the rings are not fitted correctly in the grooves, the
resulting misalignment stresses the ring material by the continuous
reciprocating motion. This will accelerates the fatigue crack propagation which
in turn stresses the ring lands and cause material to fracture away from the
ring land areas, as depicted in Figure 1.13.
- Skirt fracture
If the clearance between piston and cylinder becomes too
large, piston will be misaligned with cylinder, i.e., piston will be always at
an angle with the cylinder walls. This causes the piston to flutter within the
bore during the engine running. With larger clearances, the piston rotation
angle also increases and makes contact with cylinder walls at two points; the
bottom part of the skirt and the top part of the piston head. These contacts
introduce a flexural load on the piston skirt. The
15
Chapter 1: Overview on engine's piston
consequence will be the formation of stress concentration
areas where cracks initiate and propagate onto fracture, as shown in Figure
1.14.
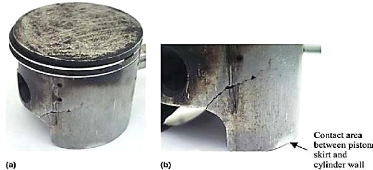
Fig .1.14: Initiation and propagation of cracks onto
fracture
1.3. Piston-cylinder Lubrication
1.3.1. The lubrication regimes in the piston-cylinder
couple
Based on studies made by several researchers, it can be confirmed
that:
- The main piston-cylinder lubrication regime is the hydrodynamic
regime;
-boundary Lubrication and sometimes dry contact occur in the PMB
and PMH areas, according to:
1. Courtney, Pratt, Tudor [PAN85] Using the measurement of
the contact resistance of the segments-cylinder;
2. Wing and Sauders [PAN85] from the study of the rapid
variations of the oil film thickness by adopting an indirect measurement of the
piston-cylinder diametral clearances;
3. Furuhama in 1959 [FUR59] after he noticed the
insufficiency of the hydrostatic lubrication which cannot explain a limit
lubrication of the segments with the TDC which possess in this position a zero
speed and consequently a zero film thickness;
4. Brown and Hamilton in 1975 [BRO76] by measuring the
pressure distribution in the oil film and the thickness of the film in the
vicinity of the TDC by capacitive proximity sensors. They demonstrated the
limiting lubrication of the segments in the vicinity of TDC and BDC
5. Allen and al in 1978 [ALL84] From the measured values of
the thickness of the oil film in the vicinity of the TDC, less than 0.25
ìm, they assert the existence of a metal / metal contact in these
zones.
6. Richez and al [RIC82] carry out tests on an engine and
show that the friction increases with temperature or with the decrease in
viscosity. The measurement of the amplitudes of the roughnesses (2 to 4
ìm) and the thicknesses of the oil film (0.5 to 10 ìm) enabled
them to demonstrate the existence of a metal / metal contact zone in the
vicinity of the TDC.
16
Chapter 1: Overview on engine's piston
7. Uras and Patterson [URA87] Measuring the friction force of
the piston and the measured friction force decreases as the piston velocity
increases. This frictional force also becomes important in the vicinity of the
TDC and BDC, indicating that the friction becomes limited in these regions.
8. Myers and al in 1990 [MYE90] Install capacitive gauges and
surface thermocouples to study the influence of different parameters on the oil
film in the vicinity of the TDC. They study the friction at engine start-up and
thus notice the breakage of the oil film which causes the metal / metal
contact.
- The boundary lubrication is located in the expansion and
compression cycles:
1. Rogowski in 1961 [ROG61] after measuring the
piston-cylinder friction force by means of a special device. He noticed that
this force becomes important during the compression and relaxation phase;
2. Furuhama and al in 1978 [FUR59] with the improvement of
their experimental set-up enabled them to show that the measured frictional
forces are very high in the second half of the compression phase and the first
half of the expansion phase at the TDC. The considerable increase in the
friction force confirmed the existence of a metal / metal contact between the
segment and the cylinder in these zones.
1.3.2. The main lubrication regime formulations in the
piston-cylinder couple 1.3.2.1. Formulation of Furuhama and
al
Experiments by Furuhama [RAY74] on driven engines and in
normal operation led him to state that the main mode of lubrication of the
piston and cylinder is of the hydrodynamic type. The Reynolds equation under
these conditions is written:
???? (h3
?? ?? · ????
????) = 6 · ???? · ??h ???? + 12 ??h
????
with h: oil film thickness, ?? :
Dynamic viscosity of lubricant, ??: Average hydrodynamic pressure, ????:
Speed of the piston.
The resolution of this equation makes it possible to determine
the pressure and velocity
distributions in the oil film.
1.3.2.2. Formulation of Richez and
al
Richez and al [RIC82] Introduce mixed lubrication of the segments
and take account of the surface
roughness. By noting that the heights of surface's roughness of
the segments and of the cylinder are
of the order of 2 to 4 ìm and that the thickness h of the
oil film is of the order of 0.5 to 10 ìm, they
define a factor ë= h /??, and proposed the criterion:
?? = 1 The lubrication is mixed;
?? = 1 The lubrication is hydrodynamic.
They also give the law of distribution of pressure and speed in
the oil film:
?? h3 ???? + ??h
???? (???? 12 ?? · ????
????) = ???2 ? · ??h ????
17
Chapter 1: Overview on engine's piston
???? = 1 - 0.9 exp (- 0.56 h
?? )
1.3.3. Generality on anti-wear additives (AW) in boundary
regime 1.3.3.1. Boundary regime and tribofilm
Lubricating oil consists of one or more base oil which
represents the framework of the product. However, for certain applications, and
particularly at high temperatures and pressure (as in the case of pistons), the
base oil is no longer efficient. In order to meet the various uses, multiple
and different additives are added, specific to each use. Among the main types
of additives are anticorrosive, anti-oxidation and anti-wear (AW) dispersant
additives. These additives influence the behaviour of the lubricant by
reinforcing its properties or by adding it others of which it is devoid;
Researchers in the field of lubrication develop different
laboratory tests and each test fulfils a given function. These tests are
Interesting on the mode of application or the behaviour of the lubricant. The
formulation of lubricants requires control of the functioning of each additive
(its reactivity to the metal surface and its mode of action) and their impact
on the environment [TAN07].
In order to improve the performance of the lubricants in
boundary regime in order to avoid seizure and to have reasonable friction,
additives and in particular anti-wear additives (AW) and extreme pressures (EP)
are incorporated in them. These compounds act directly on the metal surface by
forming a protective film on surfaces called tribofilm by chemical reaction or
physical adsorption.
Tribofilms formed in the boundary lubrication regime are
designed to reduce friction and to protect the surface from wear due to
lubricant/surface chemical reactions induced by temperature and pressure
conditions.
Boundary lubrication is a complex phenomenon in which several
parameters intervene such as solid-lubricant interactions, metallurgy,
roughness, corrosion, temperature, pressure and kinetics of chemical
reactions.
In the limit lubricating regime, the height of the surface
roughness becomes greater than the thickness of the film at the interface, the
oxide layer which protects the surface is removed and the two surfaces are
brought into contact. This situation causes wear, increases friction and can
cause welding of the roughness. The viscosity of the oil no longer intervenes
under these extreme conditions, it is the additives present in the oil which
will interact chemically with the metal surfaces to form the tribofilm whose
thickness is a few tens of nm and which protects the Parts against wear
[GEO79].
The additives (AW) by forming their own sacrificial film
replace the oxide protective layer and considerably reduce the wear rate.
1.3.2.2. Types of anti-wear additives
(AW)
The additives (AW) are classified according to their
reactivity with respect to the metallic surface in two types, the active
additives and the non-active ones [PAP98]. The active additives are those which
chemically react with the metal surface to form a film. On the other hand, the
non-active additives form films which are mainly unreacted with the surface.
18
Chapter 1: Overview on engine's piston
Molecules that contain sulfur, phosphorus and halides are
considered active compounds while molecules containing boron, aluminum and
graphite are classified as non-active compounds [DON94].
Table 3.1 shows the main anti-wear additives (AW) used in
lubrication.
|
Additive Families
|
|
sulfuric additives
|
dialkyldithiophosphates of zinc ZnDTP
|
|
2-benzothioyle-tert-nonyle disulfur
|
|
Phenyle sulfur
|
|
Benzyle mercaptan
|
|
Octadecyle mercaptan
|
|
Dodecylebenzylemercaptan
|
|
Ditert-octylemercaptan
|
|
Phosphoric
additives
|
Alkyl d'acide phosphoré
|
|
Alkyl phosphoré
|
|
Phosphites
|
|
Borate
Additifs
|
Esters boratés
|
|
Borates de potassium
|
|
Borates de calcium
|
|
mixed Additifs
|
Dithiophosphates métalliques (Zn,Co,Ni,..)
|
Table 3.1.The main anti-wear additives (AW) used in
lubrication
The universally used additives (AW) are
dialkyldithiophosphates and zinc (ZnDTP). This success is mainly due to its
good antioxidant and anti-wear properties and its low cost [TAN07].
Several authors have shown that the chemical structure of
sulfur-containing additives affects tribological performance, for example.
Disulfides have been shown to perform better in anti-wear AW than monosulfides
due to weak S-S bond in disulfides which is Easier to break than the C-S bond
in monosulfides [FOR70].
Croszek [GRO71] Considers that the anti-wear (AW) activity of
the disulfides depends on the electronegativity between the chemical elements
of this molecule.
19
Chapter 1: Overview on engine's piston
Sakuraia Has shown that oxygen in oil plays an important role
in the formation of oxide films and appears to have a good influence on
tribological behavior [FEN61]. From the chemical reactivity of some additives,
he concluded that oxygen and oxide films prevent wear on surfaces and reduce
friction.
Wheeler [WHE78] differentiates two types of wear: soft wear
and severe wear. Under severe pressure and temperature conditions, a
significant amount of iron sulfide is detected in the wear traces in comparison
with the mild pressure and temperature conditions, and concluded that under the
effect of the elevation of Temperature and pressure, the sulfur compounds react
by chemical corrosion with the metal surface to form iron sulfide.
Temperature affects the tribological behavior of sulfur
additives and the formation of tribofilms. Temperature seems to have a limited
effect on the decomposition of sulfur additives by promoting the formation of
iron sulfide films which improves tribological performance [TAN07].
Chapter 2
Aluminum and its alloys
22
Chapter 2: Aluminum and its alloys
2.1. Properties of non-alloyed aluminum (1000
series)
There are many grades of unalloyed aluminum, known
commercially as pure aluminum. These standard grades are part of the 1000
series of AFNOR standards. The purity of aluminum is always greater than 99.00%
(grades 1100 and 1200), very often higher than 99.40% (grade 1040), but can
reach 99.80% (grade 1080) or even 99.90% (grade 1090).
It is also possible to obtain a high purity aluminum of 99.95
% (grade 1095), 99.98 % (grade 1098), 99.99 % (grade 1199), and even an
aluminum of very high purity (greater than 99.996%, or even equal to
99.999%).
The structure of the pure aluminum is face-centered cubic at
any temperature below its melting point (660 °C). The main physicochemical
properties of unalloyed aluminum are given in Table 2.1: (At 20 °C for a
pure aluminum of 99.996%):
|
Melting temperature G??
|
660°C
|
|
Crystal structure
|
CFC
|
|
Density ??
|
2700 Kg/??3
|
|
Thermal conductivity ??
|
237 ????-1k-1
|
|
Coefficient of linear expansion ??
|
23.1x 10⁻⁶ k-1
|
|
Electrical resistivity ????
|
0.0265 ??????
|
Table 2.1: Physicochemical properties of unalloyed
aluminum
These properties are the reason why the unalloyed aluminum is
widely used (in developed countries more than 40% of the aluminum consumption
takes place in this state).
Table 2.2 gives the main mechanical properties of unalloyed
aluminum:
|
Ultimate tensile strength ????
|
40 à 50 MPa
|
|
Yield strength Re
|
10 à 20 MPa
|
|
Proof stress Re0.2
|
20 à 35 MPa
|
|
Young's Modulus E
|
63 à 71 GPa
|
|
Elongation to rupture A%
|
50 à 70%
|
|
Poisson's ratio õ
|
0.33 à 0.35
|
Table 2.2: Mechanical properties of unalloyed
aluminum
2.2. Aluminum alloys
The main alloying elements introduced into aluminum are
copper, manganese, magnesium, silicon, zinc and lithium. These elements can be
added individually or in combination. On the opposite, certain other elements
are more or less excluded, in order to improve a particular property. For
example the tenacity of alloys with magnesium and silicon is greatly improved
by additions of manganese and chromium with limited contents (often Cr <0.4%
and Mn <1%) and by a severe limitation of the contents of harmful elements
such as iron.
23
Chapter 2: Aluminum and its alloys
2.2.1. Classes of aluminum alloys
The aluminum alloys are classified according to the main alloying
element (s). We can
distinguish:
- Aluminum/copper alloys of the 2000 series;
- Aluminum/manganese alloys of the 3000 series;
- Aluminum/silicon alloys of the 4000 series;
- Aluminum/magnesium alloys of the 5000 series;
- Aluminum /magnesium/silicon alloys of the 6000 series;
- Aluminum/zinc alloys of the 7000 series;
- Aluminum alloys and other elements of the 8000 series.
We can also distinguish:
- Peening alloys (not hardening by heat treatment): which are
aluminum/manganese alloys and
aluminum/magnesium alloys;
- Heat treatment hardening alloys: which are aluminum/copper
alloys, aluminum/magnesium
alloys, aluminum/silicon alloys and aluminum/zinc alloys.
2.2.2. Physical properties of aluminum alloys
Table 2.3 gives the main physical properties of the different
series of aluminum alloys (the mean value of different experimental results are
considered):
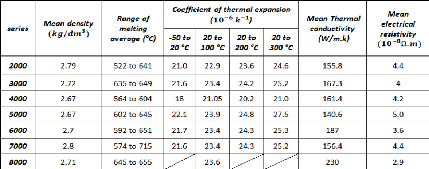
Table 2.3: Physical properties of the different series of
aluminum alloys
2.2.3. Mechanical properties of aluminum
alloys
It is well accepted that the properties of aluminum alloys are
determined essentially by the microstructure of the alloys obtained.
The microstructure is essentially conditioned by the nature,
the quantity and especially the distribution of the elements of addition. Most
metallic elements can be alloyed with aluminum, but only a limited number of
those elements are used as the main addition and condition the properties of
the alloys.
24
Chapter 2: Aluminum and its alloys
Table 2.4 below represents the mean values of the mechanical
properties for different series of aluminum:
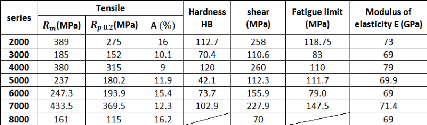
Table 2.4: Principal mechanical properties of different
series of aluminum
2.2.3.1. Static strength
Table 2.4 gives the mechanical strength obtained for each of
the series of aluminum alloys. In fact, those characteristics can be varied
depending on many factors.
2.2.3.2. Tenacity
Three categories of aluminum alloy can be considered on the
tenacity point of view:
- Tenacity of low- and medium-strength alloys: those alloys are
of 1000, 3000, 5000 series and
all of other series in the annealed state;
- Tenacity of alloys of the 6000 series: Al-Si-Mg alloys with
medium resistance of the 6000 series
are commonly used for working structures;
- Tenacity of high strength alloys: those alloys are of 2000 and
7000 series.
For the high strength alloys, it can be noted that:
- The tenacity increases when the yield point decreases.
- The newest alloys currently used for the construction of modern
structures of aircraft are
designed to offer a particularly high tenacity:
? The 7475 is the aluminum alloy which has the best tenacity;
? The alloys 7010, 7050, and 7150 offer the best compromise
between strength and
tenacity.
2.2.3.3. Endurance strength
The Wohler curves of aluminum alloys have the following
characteristics:
- There is no asymptote up to 108 cycles, so the
fatigue test must be kept running up to 108 cycles to determine the
fatigue limit;
- The ratio between the fatigue limit at 108 cycles
(in alternating stresses) and the tensile breaking limit is equal to:
- 0.35 to 0.45 for Peening alloys (1000, 3000 and 5000 series
alloys);
- 0.25 to 0.35 for heat treatment hardening alloys (2000, 6000
and 7000 series alloys); In general, this ratio decreases when the breaking
load increases. Different parameters can influence the rate of fatigue
cracking:
25
Chapter 2: Aluminum and its alloys
in
- The stress ratio R = Sm : the rate
of fatigue cracking increases when R increases;
- The medium: humid or salty aggressive medium
accelerates fatigue cracking;
- Overloads: during a fatigue test, if the stress
intensity factor is temporarily increased by a tensile overload, a significant
reduction in the rate of cracking is observed after suppression of the
overload.
2.2.3.4. Corrosion resistance
In practice, aluminum has an excellent corrosion
resistance, because of that it can often be used without coating. Adequately
chosen, aluminum alloys without coating can resist to freshwater, sea water,
and so many chemical products.
However, like the most common metals, corrosion damage
can occur in different forms, depending on the class of the aluminum alloy, its
metallurgical state, the exposure conditions, assembly and stressing
conditions.
The principal forms of corrosion that can be
encountered on aluminum alloys are:
- General corrosion or uniform
corrosion
The exposed aluminum instantly covers with an oxide
layer of 5 to 10 nm thick, and its corrosion resistance depends on the
stability of this oxide layer in the corrosive medium. General corrosion is
characterized by the uniform decrease of thickness over the entire metal
surface; the oxide layer is dissolved in a regular manner by the corrosive
agent.
In a natural, rural or marine atmosphere, the
corrosion rate of aluminum is extremely low, even insignificant, and does not
exceed 5 pm / year. In general, the general corrosion resistance of aluminum
depends on the pH of the corrosive medium, that corrosion cannot practically
occur in an acidic medium with pH <4 and in a basic medium with pH>
9.
In the most aggressive mediums such as marine mediums,
copper-containing alloys (2000 and 7000 series) require protection; On the
other hand, the alloys of the 3000, 5000 and 6000 series may have a corrosion
resistance at least equal to that of the non-alloyed aluminum.
- Pitting corrosion
Pitting corrosion is a much localized form of
corrosion, which appears by the formation of cavities or recesses on the
surface, in which the diameter and depth depend on the class of the alloy, the
corrosive medium and the exposure time.
The rate of deepening of the pits generally decreases
due to the formation of hydrated alumina which hinders considerably the
exchanges between the corrosive medium and the metal. Experiments show that the
rate of propagation of pits v is related to time t by a
relation of the type:
V= k
· t1/
3
All the aluminum alloys are sensitive to pitting
corrosion, the best results being obtained with a content of 1% of iron (it is
the case of alloys 8006, 8011 for example), likewise the presence of 0.1 to 0.2
% of copper improves the resistance for the penetration of pits (the case of
alloy 3003).
26
Chapter 2: Aluminum and its alloys
- Galvanic corrosion
When two different metals are in electrical contact in a
corrosive medium, they form a cell which produces current by consuming the most
electronegative metal which constitutes the anode. Aluminum is the most anodic
material compared to other metals (except zinc and magnesium). Aluminum will
therefore often be the victim of mixed assemblies.
In fact, the attack rate of aluminum depends on: the
difference of potential between the two metals present; on the electrical
resistance between the two metals and on the corrosive medium and more
particularly on its conductivity.
- Corrosion cracking or Intergranular corrosion
The intergranular corrosion encountered in various metals and
aluminum alloys is the corrosion that propagates in the metal by consuming only
the grain boundaries. This type of corrosion is due to the presence at the
grain boundaries of a continuous and anodic zone compared to the interior of
the grains.
For aluminum alloys, it mentioned that:
- Alloys of 1000, 3000, 4000 and 6000 series: are not sensitive
to intergranular corrosion;
- Alloys of the 5000 series: Al-Mg alloys with less than 3.5%
Mg are normally not susceptible to intergranular corrosion and Al-Mg alloys
with more than 3.5% Mg may be sensitive to intergranular corrosion especially
if the magnesium content is high;
- Alloys of the 2000 and 7000 series: have a good resistance
to the intergranular corrosion obtained by a quick quenching.
2.2.4. Standards defining aluminum alloys 2.2.4.1.
Wrought aluminum alloys
This family of aluminum alloys is the most widely used in
industry. It includes all commonly
rolled products.
The NF EN 573 standard defines two European systems for the
designation of these aluminum
alloys: the numerical system and the alphanumeric system.
The numerical system uses a 4-digit code which refers indirectly
to the chemical composition.
According to this system the designation of an alloy includes
successively:
4 letters: EN AW
EN refers to European standards;
A indicates that it is aluminum;
W specifies that it is wrought metal.
4 digits:
The first digit indicates the series of alloys
The second digit can be:
- 0 if it is the original metal,
- 1 to 9 if the alloy has certain particularity (purity of a
unalloyed aluminum, variant of an alloy,
etc.);
27
Chapter 2: Aluminum and its alloys
The third and fourth digits have different meanings depending on
whether they are:
- Of unalloyed aluminum; they are then the first two decimal of
the number expressing the
minimum Al content,
- Of an alloy: these two numbers serve only to differentiate the
grades of the same group.
Examples:
EN AW-1098 = aluminum with at least 99.98% purity;
EN AW-4015 = alloy wit 1.8% of Si and 0.9% of Mn;
In the alphanumeric system, unalloyed aluminum and aluminum
alloys are distinguished. For
the unalloyed aluminum, the designation begins with the chemical
symbol of aluminum Al
followed by the minimum content of the metal in % expressed in
one or two decimal.
Example: EN AW-Al 99.98 = Aluminum with at least 99.98%.
Normally this designation should be preceded by a numerical
designation and the minimum
content of the metal in % placed in brackets, the precedent
example is designed as EN AW-1098
[A 99-98].
For aluminum alloys, the designation begins with the chemical
symbol of aluminum Al,
followed by the chemical symbol (s) of the main alloying element
(s), each followed by a number
representing the average content in % of the indicated
element.
Examples:
Al Si2Mn = alloy of 1.8% of Si and 0.9% of Mn;
Al Si10 = alloy of 10% of Si.
Normally, this designation should be preceded by the numerical
designation and be placed in
brackets such as the following:
EN AW-4015 [AlSi2Mn];
EN AW-4045 [AlSil0];
2.2.4.2. Cast alloys
Most of these alloys are easy to mold (permanent mold or sand
casting). Many of these alloys contain sufficient silicon to cause a eutectic
reaction, which gives the alloys a low melting point, good fluidity and good
molding. The cooling in the die casting is faster than sand casting, which
results a grain refinement and improved mechanical properties. Grain refinement
is also caused by boron and titanium additives.
Designation according to the standard NF EN 1780, is given as:
prefix EN; space ; Letter A (for aluminum); Letter B (for remelting ingots) or
C (castings piece) or M (mother alloys); A dash ; followed by five digits
representing the position of the chemical symbols giving the composition of the
alloy ordered by decreasing content and limited to 4 elements.
Example:
EN AB-45400 [Al Si5Cu3] or EN AB-Al Si5Cu3; remelting ingots
in aluminum alloy with 5% silicon and 3% copper.
28
Chapter 2: Aluminum and its alloys
2.3. Aluminum-Silicon Alloys (4000 series)
The equilibrium diagram of the Aluminum-Silicon alloy is given in
Figure 2.1.
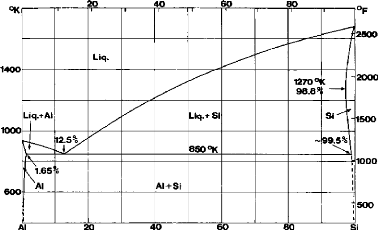
Fig.2.1: The equilibrium diagram of the Aluminum-Silicon
alloy
The eutectic point varies from 11.7% Si to 14.5% Si. The most
probable value is 12.5% Si. With rapid quenching the eutectic point can rise to
17% Si.
The main physical and mechanical properties of
aluminum-silicon alloys have been given in Tables 2.3 and 2.4.
Hardness increases with increase in silicon content almost
linearly and reach values between 500 and 700 MPa for 15% Si and 1000 MPa for
60% Si.
The modulus of elasticity has an average value between 85 and
95 GPa, this value increasing with temperature. The impact resistance also
increases with increasing temperature.
The endurance strength is relatively low; it varies from 50 to
70 MPa for the hypoeutectic alloys and from 70 to 80 MPa for the hypereutectic
alloys. The addition of cobalt and manganese increases the endurance strength.
This strength abruptly decreases with the temperature increasing until 327
° C.
The compression strength is 10 to 15% greater than the tensile
strength.
The wear resistance is very good, especially for hypereutectic
alloys. For alloys of 20 to 25% Si, the wear resistance is 10 times more than
that of the non-heat treated steel.
The presence of calcium and sodium in the alloys increases
their porosity. To reduce it, rare earths are added. Vacuum coatings are also
used.
The silicon is an inert element in most corrosive mediums, the
corrosion resistance of the aluminum-silicon alloy is the best compared to
other aluminum alloys.
The coefficient of thermal expansion is relatively low
compared to other aluminum alloys; it is decreased with the increase in silicon
content.
29
Chapter 2: Aluminum and its alloys
According to Table 2.5 it is noted that the coefficient of
thermal conductivity is decreased with the increase of the Silicon content.
|
Silicon content (%)
|
Temperature (K)
|
|
300 à 400
|
300 à 600
|
|
5
|
22.1 à 22.5
|
24.1 à 24.5
|
|
7 à 9
|
21.4 à 21.7
|
23.1 à 23.5
|
|
12
|
19.9 à 20.6
|
21.6 à 23.1
|
|
> 14
|
18 à 19
|
20 à 21
|
Table 2.5: Coefficient of the thermal conductivity
(10-6 K-1)
The alloy density is decreased with the increasing in Silicon
content. An alloy of 6 to 9% Si has a density of 2650 to 2700 ????/
??3 and with 10 to 13% Si has a density of 2600 to
2650????/??3.
Chapter 3
Vapor deposition and thin layer
characterization techniques
31
Chapter 3: Vapor deposition and thin layer
characterization techniques
3.1. Physical bases of the vacuum technique 3.1.1.
Vacuum and gaseous phase of the materials
Materials in the gaseous state are characterized by a
great mobility of their molecules. Because of this; they always occupy the
volume of the container in which they are enclosed. In physics and technology,
we call vacuum, the state of a gaseous volume whose pressure is below the
atmospheric pressure. For convenience, vacuum is divided into four ranges: low
vacuum, fine or medium vacuum, high vacuum, and ultrahigh vacuum.
Table 3.1 gives the general characteristics of
vacuum:
|
characteristics
|
Vacuum
|
|
Low vacuum
|
Medium vacuum
|
high vacuum
|
ultrahigh vacuum
|
|
Pressure range (bar)
|
1 à 10-3
|
10-3 à 5 · 10-5
|
·
5 1012 a
|
< 10-12
|
|
Number of molecules in
?? ??????
|
1019 à 1016
|
1016 à 1013
|
1013 à 1010
|
1010
|
|
Mean free path ??
|
A « ??
|
A = ??
|
A > ??
|
A » ??
|
|
Flow regimes
|
Viscous flow
|
intermediate flow
|
molecular Flow
|
Molecular Flow
|
|
Application
|
Packaging,
drying
|
CVD, plasma
|
PVD
|
Ion beams
|
Table 3.1 General characteristics of
vacuum
According to kinetic theory, the molecules of a gas
move in a continuous and chaotic manner. They collide and between their impacts
their movement is rectilinear. The distance between two successive impacts is
called the free path of the gas molecule. After each impact, the magnitude and
direction of the velocities of the molecules change.
When the gas occupies a limited volume, there are
molecular impacts on the walls of the container. So the gas pressure is the
result of the statistical mean of these impacts.
A general criterion characterizing the vacuum in a
system is the ratio of the mean free path ë of the molecule with a
characteristic dimension ?? of the vacuum chamber, that is to
say:
A
Kn = (3.1)
??
The Kn ratio is known as Knusden
number, when Kn » 1, i.e. X » l the
flow regime of the gas is molecular flow. When Kn « 1,
i.e. X « l the regime is called viscous flow.
The limiting temperature above which the gas cannot be
condensed, whatever the pressure, is called the critical temperature. This is a
fundamental criterion for distinguishing gases from vapors.
Chapter 3: Vapor deposition and thin layer
characterization techniques
Materials are in the gaseous state if the temperature
is above their critical temperature. If the temperature is below their critical
temperature, they are in the vapor state.
The pressure can be written in the form of the following
equations:
P= ??
· k
· T (3.2)
?? : The number density of the molecules
(m-3);
k : The Boltzmann constant (k 1.38
· 10-16 N
· m/K); T
: The gas temperature.
1
P = 3 ??v2 (3.3)
?? : The density of the gas (kg
· m-3);
vv2 : The-root-mean-square speed of
molecules.
When the gas system is a mixture of different gases,
each gas exerts its pressure Pi independently of the
others. The total pressure PE is then the sum of the
partial pressures (Dalton's law):
i=??
PE = ?Pi (3.4)
i=1
According to the kinetic theory, the mean kinetic
energy of the translation of molecules is proportional to the thermodynamic
temperature of the gas:
|
m
· v2
|
3
2
· k
· T (3.5)
|
|
2
|
3.1.2. Movement and speed of gaseous molecules
The molecules of a gas have different speeds. During
their thermal movement, the molecules collide. As a result the magnitude and
direction of their speed change. The distribution of molecules according to
their speed is described by a statistical law. It is generally assumed that
this distribution follows Maxwell's law.
According to Maxwell, the number of molecules whose
absolute speed is between v and v + ??v
for any direction of motion is given by the equation:
|
m )3/2
f (v)
· ??v = 4??N
· (2??kTl
|
????2
??-2????
v2??v
|
(3.6)
|
32
This function allows us to determine the most probable
speed v??. The speed
v?? corresponds to the maximum of the
function f(v)and is determined by the
condition:
33
Chapter 3: Vapor deposition and thin layer
characterization techniques
?? ????2
????(?? 2???? ??2) = 0 (3.7)
Resolution of
(3.7) gives ????:
2????
???? = (3.8)
??
In the calculations, the most often we use the arithmetic
mean speed ??:
?? =v8???? = 1.128 ???? (3.9)
????
The root mean squared speed v??2 can also be
used:
v??2 =v3k??= 1.223 ???? = 1.08 ??
(3.10)
??
Figure 3.1 shows the molecule speed distribution for two
different temperatures;
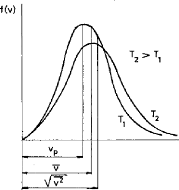
Fig.3.1 Function of gas speed distribution for two
different temperatures
The kinetic theory shows that each constituent of a
gas mixture has an independent speed distribution.
At great distances, the real molecules attract
themselves, while at smaller distances they repel each other. The number of
intermolecular impacts B can be calculated by the following
formula:
Chapter 3: Vapor deposition and thin layer
characterization techniques
?? = v2??????2?? = v2????2v 8??
?????? (3.11)
?? : The molecular diameter (if we consider the molecule as a
solid sphere). Finally we can give the mean free path ?? as:
|
?? =
|
1
=
v2????2??
|
????
v2??????2 (3.12)
|
34
This implies:
??
?? = (3.13)
??
The variation of the free mean path of some molecules with the
pressure is shown in figure 3.2.
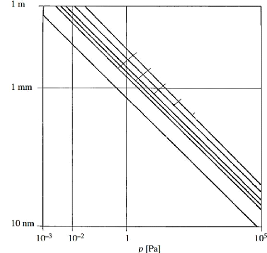
water vapor
nitrogen
oxygen, argon
Free mean path
oil
hydrogen helium
Fig.3.2 Free mean path of gas molecules as a function of
total pressure
3.1.3. Basics of vacuum technology
Each vacuum installation contains a chamber the vacuum is
obtained and maintained, a vacuum pump which evacuates the chamber and a piping
which connects them together. When the pump is switched on, the gas in the
chamber is directed towards the pump. The pump
35
Chapter 3: Vapor deposition and thin layer
characterization techniques
delivers the gas it contains. New quantities of gas from the
chamber replace the delivered gas and so on.
During pumping, the quantity of gas contained in the vacuum
installation decreases, its pressure obviously falls also because the volume
and temperature of the installation remain constants. In fact, the expansion of
the gas produces a lowering of the temperature, but because of the high thermal
inertia of the installation, it is considered that the gas temperature remains
constant.
During pumping the pressure decreases throughout the
installation, but the pressure in the chamber decreases more slowly than the
pressure at the suction port of the pump.
The variation in mass flow rat as a function of the number of
gaseous molecules passing through the section per unit time N is given by:
??= ?? · N' · ?? (3.14)
N': is The number of gaseous molecules
crossing a section in a time unit (m-2 · s)
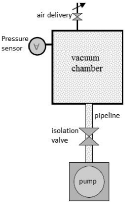
Fig.3.3 Principle of a vacuum installation
3.1.4. Duration of evacuation process
The evacuation process of a vacuum system is generally
non-stationary. During evacuation, the pressure and flow of each point of the
installation vary. The evacuation duration is the time it takes to obtain a
certain pressure in the vacuum installation.
For a piping with high conductance, we'll have:
V
??= ?? ????(??0 ?? ) (3.15)
V : The chamber volume (m3);
36
Chapter 3: Vapor deposition and thin layer
characterization techniques
P0 : The pressure of the gas at the initial instant
(N/??2);
P : The pressure of the evacuated gas
(N/??2).
In the general case, the pumping time can be obtained using
the nomogram shown in figure 3.4. To use it, first calculate the quotient V/??
by joining the points corresponding to V and Q on the respective straight
lines. The obtained point on the line V/?? is joined to the point of the line P
which corresponds to the pressure P which we wish to obtain. The point of
intersection on the line t gives the necessary pumping time.
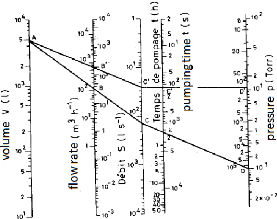
??/??
Fig.3.4 Nomogram for calculating the pumping time
3.2. The theory of plasmas
In their normal state, gases are electrical insulators. This
is due to the fact that they don't contain free charged particles, but only
neutral molecules. However, if they are given fairly strong electric fields,
they become conductors. The phenomena that occur are called discharges in gases
and are due to the appearance of electrons and free ions. The result of a
discharge in a gas is the production of an ionized gas.
The degree of ionization of a gas is defined by the ratio
á:
n
?? = (3.16)
n0 + n
n0 : The number of neutral particles per unit of volume;
n : The number of ionized particles per unit of volume.
The degree of ionization value varies from very low values (of
the order 10-10) to one. When the degree of ionization is equal to
unity, it is said that the gas is totally ionized or that it constitutes
plasma.
37
Chapter 3: Vapor deposition and thin layer
characterization techniques
The set of concepts, methods and results of the study of this
state of matter constitutes the physics of plasmas. In our environment, the
plasma phase is totally absent in the natural state, whereas on the cosmic
scale, more than 99.9% of the visible matter occurs in this phase.
When heating a gas at a sufficiently high temperature (of the
order of 104 K), the mean translated energy of its
molecules can become of the same order as their ionization energy. Under these
conditions, when two molecules collide, one of them can be ionized.
The probability of ionization as a function of energy is
characterized by a threshold. This is the ionization energy. The ionization
energies for all species are found in data banks.
Among all the weakly ionized gases we distinguish three
families:
- Lowly ionized gases: in which some ions and electrons move
in the middle of a sea of neutral molecules. Ions and electrons interact only
with neutral molecules;
- Highly ionized gases without interactions between particles:
in this plasma the charged particles follow without any collision a trajectory
determined by external electromagnetic fields; - Highly ionized gases with
interactions between particles.
Coating with plasma involves of modifying the state the
surface by one of the three following methods:
- The deposition on the surface a thin layer of a few
material;
- Chemical reaction with the surface itself (oxidation,
nitriding) or physicochemical transformation thereof (modification of adhesion,
surface energy);
- Erosion of the surface either by chemical action (formation
of pores between one or more atoms of the surface) or ion sputtering due to
plasma ion bombardment of the surface atoms or chemically-assisted sputtering,
which combines ion bombardment and chemical erosion.
The main types of plasma are: hot plasma and cold plasma.
The plasma is called «hot» when the temperature of
the ions and electrons is high (greater than 107 k ). In
this case, the medium is completely ionized.
The plasma is called «cold» when the electrons are
hot (on the order of 104 k), and the ions are cold (from
300 to 104 k). The medium in this case is weakly ionized
(ionization rate is close to 10-6 until 10-2
per neutral species).
3.3. Coating in the vapor phase (PVD, CVD)
Vapor deposition techniques allow us to have a deposit of thin
layers (generally less than 10ìm) with very interesting physical and
mechanical characteristics. Generally we distinguish two methods of deposition
from the vapor phase: physical vapor deposition (PVD) and chemical vapor
deposition (CVD).
In PVD processes, evaporation, sublimation or sputtering by
ionic bombardment are used to transform the material of deposition in the vapor
phase. These vapors are then condensed on the surfaces. The process can be
summarized by the formula:
???????? s??l??d ??????s
??????s ??????ld s??l??d
38
Chapter 3: Vapor deposition and thin layer
characterization techniques
The absence of a chemical reaction gave the designation:
physical deposition.
In CVD, one or more vapors (two in general) are used,
which react with each other on a surface to form a defined compound and
volatile products of the reaction:
AG + BGas + hot surface Csolide + DGas
+ "'
The various processes of the PVD and CVD techniques are
given in Table 3.2
|
Chemical vapor deposition(CVD)
|
Physical vapor deposition (PVD)
|
|
- Conventional chemical vapor deposition (CVD) -
Metalorganic chemical vapor deposition (MOCVD)
- Plasma-enhanced chemical vapor deposition
(PECVD)
|
- physical vapor deposition by evaporation: - PVD by
direct evaporation
- PVD by Ionic deposition
- physical vapor deposition by sputtering
|
Table 3.2 Various processes of the PVD and CVD
3.3.1. Chemical vapor deposition (CVD) techniques
3.3.1.1. Conventional chemical vapor deposition (CVD)
Two processes can be distinguished according to the
gaseous environment:
- Static processes:
It is an isothermal process, in which the bar to be
coated is placed in a closed chamber in contact with a mixture of a donor
eventually alloyed (metal powder containing the element to be deposited), an
activator (halogen compound) and an inert diluent which avoids self-sintering
of the assembly. At 400 ° C, the activator reacts with the donor element
to form the metal vapor. The subsequent heating at temperature between 800
° C and 1100 ° C under a hydrogen atmosphere allows ensuring the
production of the coating in a homogeneous manner.
- Dynamic processes:
For this process, the environment of the bar to be
coated is continuously renewed by the circulation of a gaseous mixture of the
material of the deposition formed outside the reaction chamber and carried by
forced convection on the surface of the bar.
The need for high temperature in conventional chemical
deposits to initiate the different chemical reactions leading to the metal
transfer, several paths has been followed to do so, and two are the most
developed for industry: the use of organic gaseous species (OMCVD) and the
assistance of plasma (PACVD).
3.3.1.2. Metalorganic chemical vapor deposition
(MOCVD)
The idea is to reduce the temperature of the
conventional CVD by substituting the halogenated compounds which have a higher
decomposition temperature than the new organometallic compounds.
The advantage of such a process is the lowering of the
processing temperature compared with conventional CVD processes, taking the
example of chromium deposition, the temperature is
39
Chapter 3: Vapor deposition and thin layer
characterization techniques
reduced from 1000 °C for the conventional CVD to 500
°C using by bis-benzene chrome Cr(C6H6)2, the rupture of the radical
bonding results in the formation of chromium carbide.
On the other hand, the disadvantages of this process are: the
high cost, the toxicity for a large number of them and the lack of stability
over time.
Electronics is the most favorable field for the development of
the OMCVD technique, with layers of some ten of nanometers.
3.3.1.3. Plasma-enhanced chemical vapor deposition
(PACVD)
A second way to reduce the temperature of the deposit to avoid
any further heat treatment (see table 3.3), is to use the assistance of plasma
and the use of chemically activated species such as ions and free radicals.
These species are produced in the gaseous phase by electron-molecule
collisions; the assistance of a plasma allows to obtain deposition speed
varying from 1 to a few tens of ìm/h in a temperature range comprised
between 150 and 500 ° C.
|
Deposition temperature (°C)
|
|
materiel
|
CVD
|
PACVD
|
|
Tungsten carbonate
|
1000
|
325-525
|
|
Poly silicon
|
650
|
200-400
|
|
Silicon nitride
|
900
|
300
|
|
Silicon dioxide
|
800-1100
|
300
|
|
Titanium Carbide
|
900-1100
|
500
|
|
Nitride of titanium
|
900-1100
|
500
|
Table 3.3 Typical temperature of deposition for CVD and
PECVD
3.3.2. Physical vapor deposition Processes
(PVD)
The PVD technique consists of the formation of a coating under
reduced pressure in three distinct stages: vaporization of the species to be
deposited, transport of these species and finally the condensation and the
growth of the deposit. There are two main processes of this technique, those
using evaporation and those using sputtering.
3.3.2.1. Physical vapor deposition by direct
evaporation
Evaporated species (atoms, molecules) propagate in a straight
line and condense on the cold zone (see figure 3.5). The transfer of the
species takes place in molecular flow under a pressure of less than
10-2 mbar, the rate of evaporation of the atoms can be found by the
hertz-knudsen equation:
??(??) = av ??
2??R?? (P??- P) (3.17)
a: Stricking coefficient, it is the probability of
having an adsorption; P: Gas pressure;
P??: Saturated vapor pressure;
R: Ideal gas constant.
40
Chapter 3: Vapor deposition and thin layer
characterization techniques
The advantages of this process are:
- High deposition rates (more than 200 ìm / h);
- Low processing temperature allowing deposits on plastic.
The disadvantage of this process is that the deposits have a
weak adherence and are often powdery, because they are made in a vapor phase
with a low energy. It is often necessary to heat the substrate towards 300 to
400 °C, or to use subsequent heat treatments to improve the adhesion.
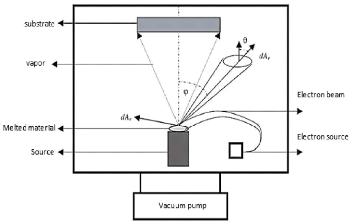
Fig.3.5 Schematic representation of physical vapor deposition
by evaporation 3.3.2.2 Physical vapor deposition by ionic
deposition
The ionic deposition differs from the direct evaporation by
the phase of transfer and condensation of the vapor. In this case the vapor
must pass through plasma to arrive into a state more or less excited and more
or less ionized. The plasma used to improve the regularity of the deposit on
bars with complex shape, energy exchanges are particularly important in the
presence of a reactive gas (see figure 3.6).
The vapor phase is created by electron beam at a pressure less
than 5 · 10-4 mbar, the working potential difference in the
deposition chamber is between 1 and 5 KV.
By introducing a reactive gas in the vapor phase such as
nitrogen or methane, it is possible to produce defined compounds of carbide or
nitride. The main application of this technique is the realization of
deposition of TiN, (Ti, Al)N and TiC.
In competition with the CVD technique, this technique is
widely used for protection against corrosion and erosion, the thicknesses are
limited by some ìm due to the presence of residual compressive
stresses.
|
|
|
Chapter 3: Vapor deposition and thin layer
characterization techniques
|
|
|
|
|
|
|
|
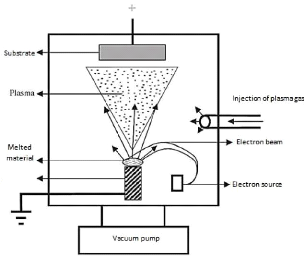
Source
41
Fig.3.6 Schematic representation of physical vapor deposition
by ionic deposition 3.3.2.3. Physical vapor deposition by
sputtering
Negative polarization in the order of 1 to 3 kV of an
electrode (target) in the presence of a rarefied argon atmosphere at a pressure
of about 1 to 10 Pa depending on the size of the reactor, leads to the creation
of an electrical discharge between the target and the walls of the reactor. The
walls of the reactor connected to the ground, act as an anode. The Ar + ions
created in the discharge are accelerated in the cathodic cover and acquire the
energy which they release when they impact on the surface of the target. This
can cause the ejection of an atom by transfer of momentum, the implantation of
the incident ion, the reflection of the incident ion neutralized by charge
transfer or the emission of electrons that will serve to maintain the discharge
(figure 3.7).
We can define two main characteristics that govern this
mechanism:
- The spraying rate or yield Y (Table 3.4): it's defined as
the number of spraying atom per incident ion. It grows linearly with the ion
energy, and inversely proportional to the energy of sublimation of the
material;
- The secondary electronic emission coefficient: defined as
the number of electrons emitted during impact with incident ion. Its value is
close to 0.1 for most metals but reaches very high values in the case of many
oxides or nitrides.
42
Chapter 3: Vapor deposition and thin layer
characterization techniques
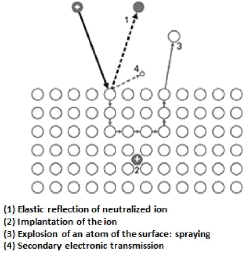
Fig.3.7 Main mechanisms resulting from the interaction of
an energy ion and a surface
|
element
|
Y
|
element
|
Y
|
element
|
Y
|
element
|
Y
|
element
|
Y
|
|
C
|
0,12
|
Ti
|
0,51
|
Cu
|
2,3
|
Pd
|
2,08
|
W
|
0,57
|
|
Al
|
1,05
|
Cr
|
1,18
|
Zr
|
0,65
|
Ag
|
3,12
|
Pt
|
1,4
|
|
Si
|
0,5
|
Fe
|
1,1
|
Mo
|
0,8
|
Ta
|
0,57
|
Au
|
2,4
|
|
in blue, Metals with very high sputtering yield
|
Table 3.4 Sputtering yield of different elements by argon
ions at 400 eV 3.3.2.4. Magnetron effect
Two main problems result from the diode process. On the one
hand, the low ionization rate of the discharge leads to low deposition speeds
(<0.1 ìm / h) and, on the other hand, the high heat of the sputtered
atoms leads to the synthesis of porous coatings. In order to avoid these two
disadvantages, the target is generally equipped with a magnetron device
consisting of two concentric magnets of opposite polarities (Fig. 3.8). A pole
piece closes the magnetic circuit on one side, while the non-magnetic target to
allow the magnetron effect; it leaves the field lines closed within the gaseous
phase, which affect the trapping of the secondary electrons and thus increasing
their possibility of encountering an argon atom in the context of an ionizing
interaction. Dense plasma is then generated at the gap of the magnets, which
leads, despite
43
Chapter 3: Vapor deposition and thin layer
characterization techniques
heterogeneous erosion of the target, to increase considerably
the discharge current and, subsequently, a deposition speed in the order of 10
ìm / h.
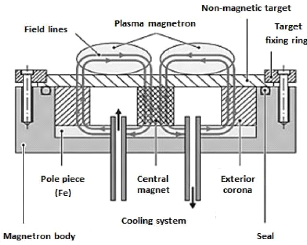
Fig.3.8 Principle of the magnetron device
3.3.3. Physical mechanism of a thin layer
formation
The formation of thin layers by physical vapor deposition is
the result of the condensation of the particles ejected from the target onto
the substrate. It is carried out by a combination of nucleation and growth
processes described in Figure 3.9.
At the moment of impact on the substrate, the incident atoms
lose their kinetic energies and produce the limiting of their ability to
diffuse into the substrate. This is true only if there is no external energy
supplied to these particles by heating the substrate or ion bombardment. Since
they are first adsorbed, they are known as adatoms. Those
adatoms move on the surface until the thermal equilibrium with the substrate is
reached.
During their displacement, the adatoms interact with one
another; creating nucleus called clusters which continue their
displacement by developing and colliding with each other. The clusters continue
to grow in number and size until a nucleation density known as saturation
density is reached.
The next step in the process of forming the thin layer is
called coalescence. The clusters begin to agglomerate with each other by
reducing the surface area of the uncoated substrate. The coalescence can be
accelerated by increasing the mobility of the adsorbed species, for example by
increasing the temperature of the substrate. During this step, new clusters may
be formed on surfaces released by the approach of older clusters. The clusters
continue to grow, leaving only holes or channels of small dimensions between
them. Gradually, a continuous layer forms when the holes and channels are
filled.
44
Chapter 3: Vapor deposition and thin layer
characterization techniques
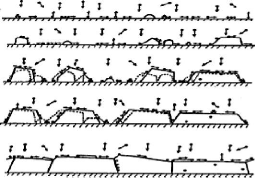
Fig.3.9 Layer growth process: nucleation and clusters
growth
There are three modes of clusters nucleation and growth:
- A cluster called Volmer-Weber (fig.3.10. (a)):
During three-dimensional growth, or Volmer-Weber growth, clusters
form and their coalescence forms a film. This mode of growth is usually favored
when the atoms forming the deposited layer are more strongly bonded to one
another than to the substrate.
- A cluster called Frank-Van der Merwe (fig.3.10 (b)):
The Two-dimensional (2D) growth, or Frank-Van der Merwe growth,
is favored when the binding energy between the deposited atoms is less than or
equal to that between the thin layer and the substrate. So, the films form
atomic layer by atomic layer.
- The mixed type called Stranski-Krastanov (fig.3.10. (c)):
The third mode of growth, called Stranski-Krastanov, is a
combination of the two preceding modes: after two-dimensional growth begins, a
change in growth mode is observed, while clusters formation becomes
energetically favorable.
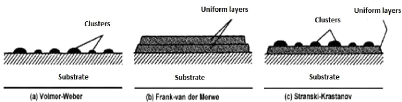
Fig.3.10 Main growth modes of thin films
3.3.4. Thin film morphology
The growth mode of layers as well as the deposition conditions
(substrate temperature, substrate nature, partial gas characteristics, etc.)
influence on the crystallographic orientations and the topographical details of
the clusters.
In fact, several models based on thin film growth approaches
have been developed to study the influence of the deposition parameters on the
microstructure of the layers. The first
45
Chapter 3: Vapor deposition and thin layer
characterization techniques
description of the morphology of thin layers obtained by
physical vapor deposition was presented by Movchan and Demchishin (fig.3.11)
[MOV69]:
- First zone: the working pressure is greater than or equal to
1 mbar and the deposition temperatures are between 0.1 and 0.2 times the
melting temperature of the deposited metal, this zone is favorable for
applications or wettability of the surface is sought but not suitable for
corrosion resistance or mechanical strength.
- Second zone: is called also the transition zone where the
crystallization of the deposit is very fine with good properties in terms of
resistance to corrosion and adhesion.
- Third zone: where the columnar crystallization is well
identified, this zone is preferred for mechanical applications because of the
good adhesion properties obtained.
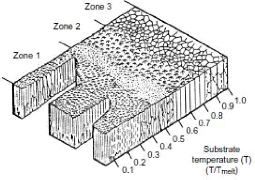
Fig.3.11 Movchan and Demchishin structural model
Thornton [THO77] proposes a model that complements the
previous one by considering the argon pressure in the sputtering. Its model
shows a transition zone, called zone T, between zones 1 and 2 (fig.3.12). In
this zone, the grains have a fibrous form without microporosities.
Later, Messier [MES84] showed that the fundamental process
controlling the morphology of the T-zone was not only the gas pressure but also
the effect of the gas pressure on the ionic bombardment of the growing film
surface during the deposition by cathodic sputtering. He proposed a fifth zone
M of morphology consisting of parallel columns with a domed surface
(fig.3.13).
Chapter 3: Vapor deposition and thin layer
characterization techniques
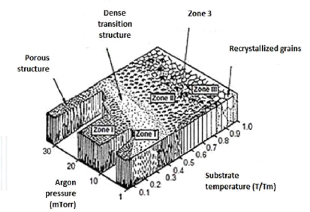
Fig.3.12 Structural modal of Thornton
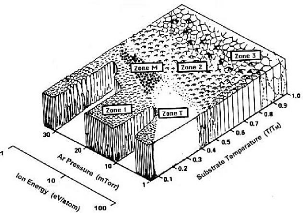
Fig.3.13 Structural modal of Messier
46
3.4. Methods of microstructural
characterization
After the application of the layer on the sample, this layer
must be characterized. First, we must study its morphology using chemical,
crystallographic and microstructural techniques (Table 3.5), and then we
characterize one or more properties of this deposit (mechanical, optical,
electrical, chemical properties, etc.). These properties are generally studied
with all
47
Chapter 3: Vapor deposition and thin layer
characterization techniques
results of morphological studies, in order to draw a
conclusion either to modify the deposition process or to apply it in
industry.
The greatest difficulty in the characterization phase is that
these techniques are indirect. So, the engineer's art consists in crossing the
results obtained, to constitute a global and synthetic vision of the most
realistic product possible, in order to be able to produce a list of functional
characteristics.
|
Chemical characterization
methods
|
Crystallographic
characterization
methods
|
Microstructural
characterization methods
|
|
- Auger Electrons Spectroscopy
|
|
|
|
(AES)
|
|
- Atomic force microscope
|
|
- Energy Dispersion Microscopy
|
|
(AFM)
|
|
(EDS)
|
|
- Scanning Tunnel microscope
|
|
- Electron Energy Loss
|
- Selected area diffraction
|
(STM)
|
|
Spectroscopy (EELS)
|
(SAD)
|
- Optical Microscope (LM)
|
|
- - Electronic microprobe analysis
|
- X-ray diffraction (XRD)
|
- Scanning electron
|
|
(EMPA)
|
|
microscope (SEM)
|
|
- Raman Spectroscopy (RS)
|
|
- Transmission electron
|
|
- X-Ray Photoelectron spectroscopy
|
|
microscope (TEM)
|
|
(XPS)
|
|
|
Table 3.5 the classification of main morphological
characterization techniques of a thin layer
3.4.1. Chemical characterization methods 3.4.1.1.
Auger Electrons Spectroscopy (AES)
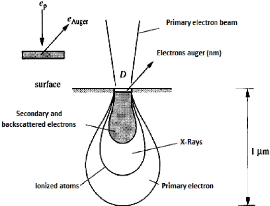
Fig.3.14 Distribution of the primary, Auger and backscattered
electrons, as well as X-rays under bombardment of a focused primary electron
beam of a diameter D
48
Chapter 3: Vapor deposition and thin layer
characterization techniques
This technique consists in bombarding the layer with an
energetic primary electrons (3 to 30 KeV), which penetrates into the matter at
depths of the order of some micrometers and excites the atoms of the layer, the
de-excitation can be carried out by emission of the secondary electrons, and of
the Auger electrons after the relaxation.
These electrons are characteristic for each atom, and the
study of their spectrum makes it possible to identify the chemical composition
of the deposit, the atlas of the spectrums of the Auger rays is available in
the literatures.
The AES technique is used to analyze the most superficial
atomic layers for conductive and semiconductive samples.
3.4.1.2. Energy Dispersion Microscopy
(EDS)
This technique involves bombarding the layer by a beam of
primary electrons; this beam can cause the emission of X-rays. The emitted
spectrum breaks down into two radiations: a continuous radiation and a
characteristic radiation which created after an inelastic impact between the
atom and the electron. The characteristic radiation is specific for each
element, and its detection allows for chemical analysis.
3.4.1.3. Electron Energy Loss Spectroscopy
(EELS)
This technique involves exposing sample to a primary electron
beam; some of these electrons will be subjected to inelastic impacts with the
atoms of the sample, which causes the loss of their energy and a weak or random
deflection of their trajectory. This loss of energy can be measured, and the
spectrum can be used to determine the chemical characteristics of the
sample.
3.4.1.4. Electron microprobe analysis
(EMPA)
This technique is based on the analysis of the X-rays emitted
by the atoms of the sample after inelastic impacts with the electron beam. The
X-radiation is sent to a monochromator which is a single crystal having
well-known crystalline planes. This radiation is then diffracted, and the
diffraction angle varies as a function of the wavelength.
3.4.1.5. Raman spectroscopy (RS)
The Raman effect results from the slight change in the
frequency of the monochromatic light projected on the sample, this modification
is caused by the vibrations and / or the rotations of the molecules. The
spectrum analysis of the scattered light gives information on the molecular
composition of the sample, because the spectrums of the vibrations are
characteristic for each molecule.
3.4.1.6. X-Ray Photoelectron spectroscopy
(XPS)
Also called ESCA (Electron Spectroscopy for Chemical
Analysis), this technique involves bombarding the sample with X-rays; the
photons y of these rays enter the sample and ionize
the atoms. The photons have kinetic energies E??
which correspond to the ionization energies E
of the different orbits of the atom by the relation:
49
Chapter 3: Vapor deposition and thin layer
characterization techniques
E = h?? - E?? (3.18)
h: Is Planck constant;
The energy of the electrons in each orbit is specific for each
atom, so the knowledge of the energy of the projected photons h??
and the analysis of the kinetic energy of the photons makes it
possible to identify the chemical composition of the sample. The average
analysis depth by this technique is from 1 to 5 nm.
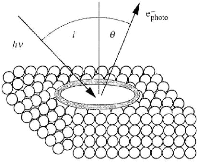
Fig.3.15 Principle of XPS analysis
3.4.2. Crystallographic characterization
techniques
Crystallographic analysis techniques are based on the
principle of X-ray diffraction (XRD) or electron-associated wave (SAD). These
techniques make it possible to determine:
- Crystalline phase composition;
- The orientation and degree of organization of the crystal
grains;
- Stress inside the repository.
3.4.2.1. Selected area diffraction
(SAD)
A primary beam of electrons passes through a thin sheet; the
wave associated with the electrons is submitted to diffraction on the
crystalline planes of the sample. The transmission electron microscope TEM
allows obtaining the image and the spectrum of this diffraction. The SAD
technique makes it possible to obtain the information for very small
crystalline grains.
3.4.2.2. X-ray diffraction (XRD)
The X-rays are diffracted on a crystalline plane according to
Bragg's law: A = 2d sin?? (3.19)
The diffracted X-Rays wavelengths vary between ë = 0.071
nm (source with molybdenum anode) and ë = 0.154 nm (source with copper
anode).
Chapter 3: Vapor deposition and thin layer
characterization techniques
The diffraction experiments are done differently for thick
layers (more than 10 ìm) and for thin layers. The thick layers are
tested with a diffractometer in which the radiation source and the detector
move circumferentially around a sample, placed at its center, the radiation
penetrates into the interior of the layer and the signal of the substrate is
low. This technique should not be applied to thin films because the signal of
the substrate would be dominant compared to that of the deposit. In this case,
the surface diffraction technique (GRXD) in which the incident beam interacts
with the surface of the layer at a small angle varying from 1 to 10 ° so
that to have a penetration depth of less than 1 ìm, the detector moves
to obtain the diffracted signal.
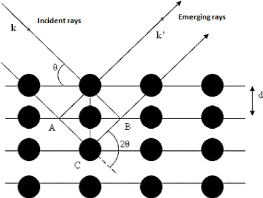
Fig.3.16 Bragg law principle
3.4.3. Microstructural characterization
methods
The microstructure analysis concerns the study of the layer
surface (AFM, STM) as well as the study of grains inside the deposit (LM) or
the internal grain morphology (TEM).
3.4.3.1. Scanning Tunnel microscope
(STM)
The STM is used to characterize the surface of conductive or
semiconductive materials. This microscope has a tip whose end has the size of
an atom.
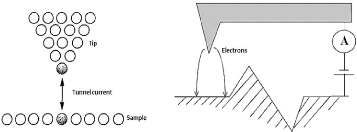
50
Fig.3.17 operating principle of the STM
Chapter 3: Vapor deposition and thin layer
characterization techniques
The principle (figure 3.17), is to set a distance less than 1
nm (interatomic distance) between this tip and the surface of the sample, which
allows the exchange of electrons and cause an electrical voltage of U = 2mV to
2V, the resulting current is called the tunnel electron current. Since this
current is very sensitive to any changing in the distance between the tip and
the surface, so this distance must be kept constant. This principle allows
obtaining a map with a very good vertical resolution of the surface.
3.4.3.2. Atomic force microscope
(AFM)
Unlike the STM, the AFM was developed to obtain surface
profiles of non-conducting materials. The tip of the probe is equipped with a
small diamond that touches the surface of the layer with a small force varying
between F = 10-6 and 10-9 N to avoid any damage to it.
The diamond is attached to a lever of which while the displacement occurs, the
measurements are made by very sensitive sensors (fig.3.18).
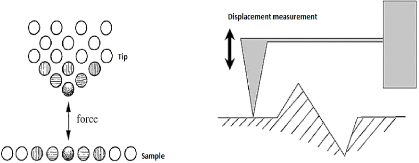
51
Fig.3.18 Operating principle of the AFM 3.4.3.3.
Optical or Light microscope (LM)
The use of the optical microscope requires special preparation
of the layer surface. This microscope allows observing the porosity and the
distribution of the pore size, the size of the unfused particles and their
distributions, the thermal and mechanical deformation of the substrate at the
interface with the deposit, the phase distribution in a composite deposit, etc.
. .
3.4.3.4. Scanning electron microscope
(SEM)
The operating principle of the SEM is the projection of a
primary electron beam which scans the sample surface and which accelerates by a
voltage of U = 1 to 30 kV. The beam of electrons interact with the atoms of the
sample either by inelastic impacts followed by their ionization and by the
generation of secondary electrons with a kinetic energy of E?? < 50 eV
coming from the superficial region of the deposit (some nanometers), or By
elastic impacts with these
52
Chapter 3: Vapor deposition and thin layer
characterization techniques
atoms and the generation of backscattered electrons with a
kinetic energy of E?? > 50 eV coming from the deeper regions
(hundreds of nanometers).
The secondary electrons are detected by a scintillation
detector equipped with a grid carried at the positive potential to attract
these electrons at low energy. The backscattered electrons are detected by a
semiconductor detector.
3.4.3.5. Transmission electron microscope
(TEM)
The operating principle of this microscope is the emission of
a beam of primary electrons passing through the sample. The image in this
microscope is obtained by electrons that have not interacted with the sample.
The electrons are accelerated by a voltage of several hundreds of kV to be able
to cross slides, which must have a thickness less than 100 to 200 nm.
3.4.4. Mechanical characterization 3.4.4.1.
Hardness
Three types of hardness are defined depending on the depth of
indentation (Table 3.6). The loads used depend on the type of hardness. In
nanohardness these charges range from some micronewtons to several hundredths
of millinewtons, while microhardness requires loads ranging from a few tens of
millinewtons to a few Newtons, in macrohardness the loads range from a few
Newtons to several tens of Newtons.
|
nanohardness
|
microhardness
|
macrohardness
|
|
Depth of indentation (rim )
|
0.001 - 1
|
1 - 50
|
50 - 1000
|
Table 3.6 Types of hardness
The use of each type of hardness depends on the material being
tested, so the nanohardness is used to characterize thin layers with
thicknesses of less than one micrometer, whereas the microhardness used to
study certain surface treatments such as shot blasting or Thermo-chemical
treatments (carburizing, nitriding, etc.). The macro hardness is used to
measure the hardness of the steels after a heat treatment for example.
With the appearance of nanohardness since 1990, it was
possible to understand different mechanical characteristics of materials at the
sub-micron scale. However, although this test is fairly simple to carry out in
principle, its technological implementation remains delicate, and the
interpretation of the results is not simple. Indeed, it is a test, although
extremely powerful, which requires a particular attention during the testing,
and the analysis of the information.
The nanohardness test consists in the simultaneous measurement
of the force F applied to the indenter and of its
penetration h into the material under investigation. The representation
F = f (h) for the charge and the discharge
constitutes the nanoindentation curve.
The inverse analysis by finite elements analysis of the
indentation curves allows, to some extent, to have mechanical properties such
as: modulus of elasticity, hardness tensile strength, etc.
53
Chapter 3: Vapor deposition and thin layer
characterization techniques
The interpretation of the measured characteristics (and in
particular the hardness) by the nanoindentation test requires simultaneous
consideration of the ISE (Indentation Size Effect) and the exact shape of the
indenter tip (Berkovich or Vickers), and without forgetting the effects of
roughness.
We can observe hardness variations of the order of few
percents due to the presence of internal stresses in the materials tested, this
is particularly true for thin films.
3.4.4.2. Adhesion of coatings
It is assumed that the adhesion of protective film is an
indispensable condition, because of that, the deposition of a coating film is
always preceded by a mechanical and / or chemical treatment intended to clean
and activate it in order to optimize the adhesion of the film to the substrate.
It is also often the practice to deposit an intermediate film (bonding layer)
between the substrate and the final coating, for example, a layer of silicon is
deposited on steels before being coated with a DLC layer.
For the characterization there are two main families of
techniques: non-destructive and destructive techniques. The first uses an
optical or acoustic probe that explores the coated material and detects any
defect or inhomogeneity (cracks, porosities, bubble etc.) at the film-substrate
interface. The most used amongst these methods are the ultrasonic methods.
Destructive techniques can be divided into two categories:
- Techniques used for ductile or weakly adherent coatings
(paints, varnishes, polymers, etc.): like the peeling test, the swelling
test...
- Techniques for metallic or ceramic coatings or when the
adhesion is strong: as the scratch test.
- Peeling test
This test consists in applying a force F, at an angle
è, to a band of length b, deposited on a substrate (Figure. 3.19). This
force increases gradually over time until the force F??
corresponds to the initiation of the flow of the film. The operation
is then continued at constant speed until the complete flow. At the end of the
test, it is necessary to check the condition of the uncoated strip and that of
the substrate in order to check that there is no elongation or plastic
deformation and that all the energy expended during the flow of the band
interface was used to break the bonds at the substrate-band interface.
The rate of release energy is given by:
G = (F??? ?) (1 - ????????) [??m-2]
(3.20)
Chapter 3: Vapor deposition and thin layer
characterization techniques
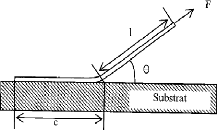
Fig.3.19 principle of the peeling test
54
- Blister Test:
This test consists in making an opening in the substrate in
such a way to retain the initial thickness of the film. A pressure P on the
deforming film is then applied using an incompressible fluid. The film will
begin to swell progressively up to a certain critical height ????
corresponding to a pressure P?? and then begin to peel
off from the substrate (Fig.3.20).
The rate of return of energy is given by:
G = ??P?????? (3.21)
?? : Constant having a value between 0.5 and 0.65;
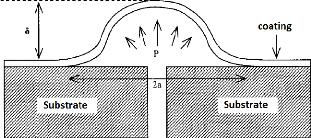
Fig.3.20: Principle of the Blister Test
- Scratch Test
This test consists in applying, perpendicularly to the surface
to be tested, a sharp Rockwell-type indenter (cone with an angle of 120 °
and a radius of curvature of 200 ìm) supporting a load of between 1 and
200 N which increases linearly over time with a loading rate of 10?? ·
m????-1. When the indenter sinks into the surface of the
material, it is made to slide with a velocity of 10 mm.
m????-1 (fig.3.21).
55
Chapter 3: Vapor deposition and thin layer
characterization techniques
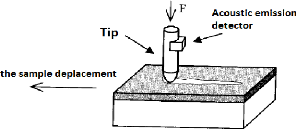
Fig.3.21 Principle of Scratch Test
3.4.4.3. Residual stresses in the
coatings
In the production of a high-temperature coating ( PVD or CVD),
at the time of return to ambient temperature, due to the difference in the
coefficient of thermal expansion between the coating and the substrate,
internal stresses can appear in the film, and the deposition-substrate assembly
can deform if the substrate is sufficiently thin (some tens to a few hundreds
of micrometers thick), in this case the direction of convex or concave
deformation indicates, whether they are tensile or compressive stresses .
The internal stresses have an important role because they can
influence both the hardness of the coating, its adhesion to the substrate and
also its resistance to wear and cracking.
The two main techniques used for the determination of internal
stresses are X-ray diffraction and the Stoney method. The two methods consist
in reducing the thickness of the substrate by machining to such a value in
which the action of the residual stresses is manifested.
- The Stoney method (the determination of the
internal stresses by measuring the radius of curvature):
From this technique, the mean internal stresses ó can be
calculated using the expression:
h?? 2????
?? = ????h??(1 - ????) (3.22)
h??, ????, ????: Are the thickness, the Young's modulus and the
Poisson's ratio of the substrate;
h??: The coating thickness; ??: The radius of curvature.
This relation makes sense only when the ratio (h??/h??) is of the
order 5 to10 % .
3.5. Thin films deposits properties
PVD and PACVD thin films are used to improve friction and wear
resistance. Table 3.7 gives the main mechanical and tribological
characteristics of the layers produced:
56
Chapter 3: Vapor deposition and thin layer
characterization techniques
|
coating
|
TiN
|
(Ti,Al)N
|
TiCN
|
CrN
|
DLC
|
|
Color
|
Yellow gold
|
black
|
purple
|
silver
|
back
|
|
Hardness (HV)
|
2300 à 2500
|
2500 à 3200
|
3000 à 3400
|
1800 à 2200
|
3500 à 5000
|
|
oxidation résistance (°C)
|
400
|
800
|
300
|
600
|
400
|
|
Elaborating temperature (°C)
|
250 à 400
|
450
|
450
|
600
|
200 à 400
|
|
thickness (um)
|
2 à 5
|
2 à 5
|
2 à 6
|
3 à 8
|
1 à 4
|
|
Dry friction on 102 Cr6
|
0.55 à 0.65
|
0.50 à 0.60
|
0.45
|
0.40 à 0.55
|
0.05 à 0.07
|
- The coating of (Ti,Al)N is the most resistant to oxidation, so
it will be used under severe thermal conditions.
- The DLC coating is the one which have the best tribological
characteristics because of the presence in its microstructure of a large
proportion of graphite bonds; it is therefore used for delicate lubrication
conditions.
- The TiCN coating has a good hardness property, with good
conductivity; it will therefore be used with strong mechanical stresses such as
steels.
- The CrN coating has good ductility and good resistance to
oxidation.
Chapter 4
Experimental Process
54
Chapter 4: Experimental Process
4.1. Determination of the sample grade
The piston used in our study as a substrate is HATZ E780. The
materials used to make this piston are: Cast iron and aluminium-silicon
eutectic alloy, the main production processes are: melding, forging
[GER/https].
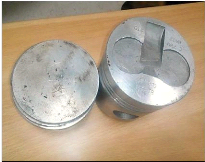
Fig.4.1: The piston HATZ E780 studied
According to the XRD analysis it can be ensured that the material
used for piston manufacture is the eutectic Al-Si alloy fig. 4.2.
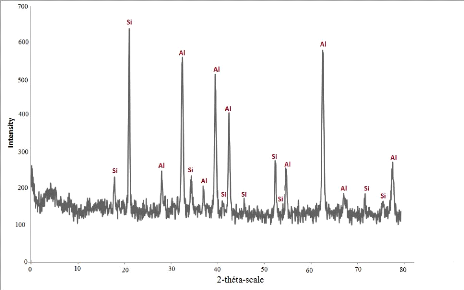
Fig.4.2: XRD spectra of a sample of the piston HATZ
E780
55
Chapter 4: Experimental Process
The silicon content in aluminium for a eutectic Al-Si alloy is
varied between 11.7 % and 14.5 % the average
value is generally 12.5%. The most commonly used eutectic
alloys for the manufacture of pistons are given in table 4.1
[EUR/http]:
|
Continent
|
4032 (AW-AlSi12,5MgCuNi)
|
4047A (AW-AlSi12 (A))
|
4045 (AW-AlSi10)
|
|
Si %
|
11-13.5
|
11.0-13.0
|
9.0-11.0
|
|
Fe %
|
1.0
|
0.6
|
0.8
|
|
Cu %
|
0.8-1.3
|
0.3
|
0.3
|
|
Mn %
|
|
0.15
|
0.06
|
|
Mg %
|
0.8-1.3
|
0.1
|
0.05
|
|
Zn %
|
0.25
|
0.2
|
0.1
|
|
Ti %
|
|
0.15
|
0.2
|
|
others %
|
0.2
|
0.2
|
0.2
|
|
Al %
|
Rest
|
Rest
|
Rest
|
Table 4.1: most commonly used eutectic alloys for the
manufacture of pistons
4.2. Preparation of samples
4.2.1. Samples Cutting
The piston with cylindrical shape is cut in the workshop in order
to obtain samples with dimension of (20×10×6) mm; the cutting
operation is divided into two stages:
First stage: Consists of piston separation in
two sections (Head and skirt) By means of a metal chainsaw
Second stage: Consists in cutting the upper part
of the piston obtained by the preceding method with the aid of a hacksaw into
samples of well-defined size.
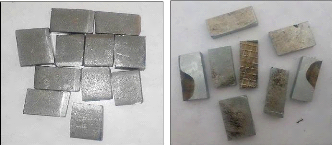
Fig.4.3: cutting samples, on the left stainless steel, on
the right aluminium
56
Chapter 4: Experimental Process
4.2.2. Samples polishing
In the process of surface preparation operations, polishing is
essentially a finishing operation, the purpose of which is to:
- reduce roughness and surface topology by eliminating surface
defects such as microcracks, porosities and inclusions.
Using a MECAPOL 230 polisher (fig.4.4), The 304 stainless steel
substrates and the Al-Si substrate are polished, using abrasive papers with
particles size varied from (200 to 1200) it is a kind of sandpaper, but with a
larger particle size Fine and controlled.
Obtaining of the polished surface finish is done progressively
(from the big size to the small one) in the presences of the water for the
cooling and the evacuation of the debris.
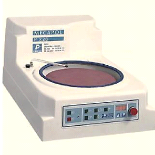
Fig.4.4 : MECAPOL 230 polisher
Characteristics of the device
- The polishing head makes it possible to process up to 6 samples
Ø 50 mm flanged in a plate by central pressure.
- Pressure force between 0.5 à 30 daN.
- Time between 10s to 99 minutes.
- Rotating speed between 20 à 600 rpm/mn.
4.2.3. Chemical cleaning
The purpose of chemical cleaning is to remove contamination or
impurities formed after polishing to ensure good adhesion of the deposit.
The samples are immersed in an acetone bath for about 5
minutes; then rinsed with distilled water and then dried with the aid of
compressed air.
4.3. Thin film elaboration process
In our work, we will deposit a thin layer on three types of
samples with different substrates in
order to better characterize the layer obtained:
- Four samples of a substrate obtained from an Al-Si alloy piston
HATZ E780;
- Four samples of 304 stainless steel substrate;
- Five samples of a 304 stainless steel substrate on which an
Al-Si layer is deposited;
57
Chapter 4: Experimental Process
- In four of the previous five samples, a layer of Ti-W-N is
deposited.
We use the PVD sputtering technique to deposit thin layers of
Ti-W-N on Al-Si, stainless steel 304 and stainless steel with intermediate
layer of Al-Si, the evaporation technique was used to create the intermediate
layer
4.3.1. Description of PVD sputtering installation and
working parameters
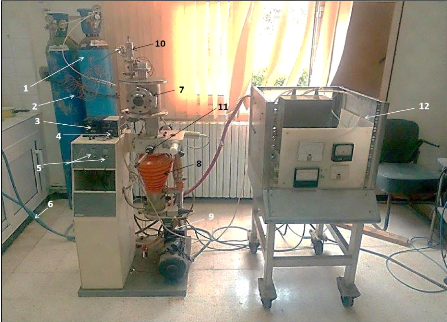
Fig.4.5. PVD sputtering installation of the CDTA
1) Bottle of nitrogen gas - 2) Nitrogen passage line - 3)
Primary pressure gauge - 4) secondary pressure gauge - 5) Primary and secondary
pump ignition switches - 6) Secondary Pump Cooling Water Pipe - 7) deposition
reactor - 8) Secondary diffusion pump - 9) Pallet primary pump - 10) Gas
pressure control valve (nitrogen and argon) - 11) Throttle valve - 12) Power
supplies
The deposition chamber is cylindrical in shape, with a high of
230 mm, diameter of 210 mm, the interelectrode distance is 45 mm, and the lower
part of the chamber is connected to the pumping system.
The primary pump is an Alcatel-type pump that can achieves a
vacuum of up to2 · 10-2???????? (2.67 ·
10-2????????) And a flow rate of0.5 à 70
????3 /?? .
The secondary diffusion pump used allows a vacuum to reach
10-5???????? (1.33 · 10-5????????) And a
flow rate of 250 ????3 /?? .
Chapter 4: Experimental Process
The primary pressure gauge is Priani type, it measures pressures
up to 10-3Torr (1.33 · 10-3 mbar). The secondary
pressure gauge is a Penning type gauge, the measured pressure can
reach10-5Torr (1.33 · 10-5 mbar).
The power generator supplies the system with a maximum electrical
power of 20 Watt, a voltage of 2 kV and an electrical current of 10 mA.
The working parameters are:
- The application of argon alone for 5 minutes with a pressure of
9.5 · 10-2Torr ; (0.127 mbar). Argon ions spray directly the
target, allowing surface cleaning;
- The introduction of nitrogen into the plasma for one hour with
the pressure of 0.1 Torr (0.133 mbar);
- The percentage of nitrogen introduced into the plasma is 5%
;
- The working voltage is 2 kV.
|
a)
|
|
b)
|
|
|
Fig.4.6: the deposits obtained on the PVD sputtering
installation:
- a) on Al-Si,
- b) on stainless steel,
- c) on stainless steel with
intermediate layer of Al-Si
|
c)
|
b)
|
58
4.3.2. Description of PVD evaporation installation
and working parameters
The working parameters are:
- The limiting pressure of the primary pallet pump is 10-2
mbar ;
- The limiting pressure of the secondary diffusion pump is 3
· 10-5 mbar ;
- in order To have a thin layer on stainless steel similar to
aluminium-silicon eutectic alloy (of 12.5 % Of silicon content see chapter 2),
il faut Put on the crucible 60 mg of powder contains 52.5 mg of the aluminium
powder and 7.5 mg of the silicon powder.
59
Chapter 4: Experimental Process
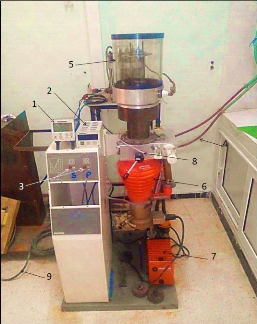
Fig.4.7: The PVD by evaporation installation of
CDTA
1) Primary pressure gauge - 2) Secondary pressure gauge - 3)
Primary and secondary pump ignition switches - 4) Secondary Pump Cooling Water
Pipe - 5) Deposition reactor - 6) Secondary diffusion pump - 7) Pallet primary
pump - 8) Throttle valve - 9) To power supply
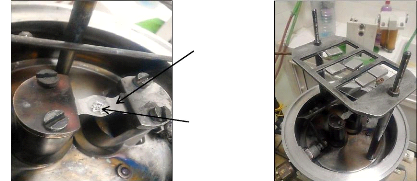
a)
b)
The crucible of the evaporator
Al-Si powder To evaporate
Fig.4.8: Inside the reactor chamber: a) Al-Si powder on the
crucible, b) The samples of stainless
steel on the substrate port
60
Chapter 4: Experimental Process
4.4. X-ray diffraction
An indispensable complement to elemental chemical analysis for
the identification of compounds, X-ray diffraction allows the fine
characterization of massive crystallized materials
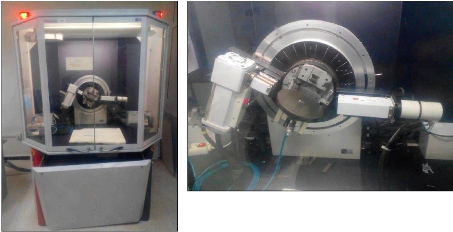
Fig.4.10: Our sample at the interior of the
diffractometer
Fig.4.9: Diffractometer D8 ADVANCE of CDTA
4.4.1. Characteristics of the device
· The diffractometer uses the BRAGG-BRENTANO assembly;
· Source (anticathode) of copper;
· Point scintillation detector;
· Acquisition range between 0 ° and 90 °. With
precision of steps up to 0.01°;
· Grazing incidence configuration, with a minimum angle of
incidence of 0.1 °;
· Eva operating software.
4.4.2. Working Principle [CDTA/http]
X-ray diffraction gives access to many information contained
in the arrangement of atoms within a crystallized material and The 3D
geometrical type of arrangement (network), the distances between atoms (mesh
size, typically a few Å) which constitute schematically a "unique"
identity card for each compound.
The BRUKER D8 Advance diffractometer is equipped with a
BRAGG-BENTANO geometry goniometer. In this type of diffractometer, an incident
monochromatic X-ray beam is diffracted by the sample at certain specific
angles, According to Bragg's law: 2dhkl
sinè = A, in which dhkl Refers to the
interreticular distance of family plans (hkl), è Is the angle of
incidence taken from the surface of the planes (hkl) ,ë The wavelength of
the scattered photons.
61
Chapter 4: Experimental Process
As Lambda does not vary during a measurement, it is enough to
vary the angle Theta to locate all diffraction angles. By means of a converter
- a scintillation counter, the intensity of each point of the measurement is
thus observed.
When the X-ray beam is diffracted, its representation is a
peak. A Theta scan produces an X-ray diffraction pattern.
The recording of the signal by a suitable detector makes it
possible to visualize the angles and Intensities of the diffraction peaks
obtained. The indexing of these peaks is carried out using specific databases
that have more than 350 000 records. Allowing the identification of the
compound (s).
4.5. Raman Spectroscopy
4.5.1. Principle of RAMAN spectroscopy
During the interaction of a light beam with the material,
several phenomena can occur. A part of the light beam is reflected, a part is
diffused and a part can be transmitted through the sample (figure 4.11). During
propagation in a dense medium, different phenomena appear: refraction,
absorption, diffusion, and possibly other non-linear effects. The absorption
may then induce photoluminescence or non-radiative de-excitation processes.
The scattering of light is manifested by the deflection of a
part of the light beam in multiple directions. The majority of the scattered
light is of the same energy as the incident light. This phenomenon of elastic
diffusion is called Rayleigh scattering. However, a small portion of the
scattered light (about one photon out of 106) present gain or loss of energy
relative to the incident light. This is the phenomenon of Raman scattering. In
a classical approach, this phenomenon of inelastic diffusion is explained by
the creation of an induced dipole which oscillates at a frequency different
from that of the incident light. Indeed, under the action of a monochromatic
electromagnetic wave of frequency ù whose electric field oscillates
according to:
??= ??0 cos(????) (4.1)
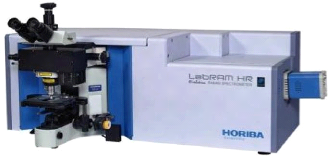
Fig.4.11: Spectrometer Raman HORIBA of CDTA
62
Chapter 4: Experimental Process
The Stokes diffusion and the anti-Stokes diffusion would be of
the same intensity. However, experimentally the intensity of the Stokes
diffusion is always (outside resonance) higher than that of the anti-Stokes
diffusion.
4.5.2. The information accessible by Raman
spectrometry
The information provided by Raman spectroscopy is relatively
extensive:
- Identification of phases or chemical compounds ·
- Characterization of materials ·
- Determination of the molecular structure ·
- Study of amorphous and crystalline systems.
The Raman spectrum of a compound indicates both the type of
binding of a compound and its crystalline structure.
4.6. Scanning electronic microscope (SEM)
The scanning electron microscope provides surface images of
virtually all solid materials at scales ranging from the magnifying glass (x10)
to that of the transmission electron microscope (x 500,000 or more).
Conventional SEM operates in an ordinary vacuum (10-5 to 10-6
mbar); The samples may be massive, ranging in size from a few ìm
(particles) to about tens of cm in diameter, or even more (industrial samples).
They must endure the vacuum. The preparation is generally simple.
The SEM at low pressure allows observation in a vacuum of up
to 30 mbar, making it possible
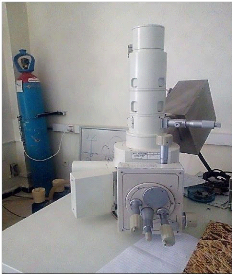
fig.4.12: scanning Electronique microscope JEOL JSM 6360LV de
CDTA
Chapter 4: Experimental Process
to examine moist or oily samples, insulators without prior
metallization (ceramics, corroded metals).
Characteristics of the device
? A maximum resolution of 50 nm.
? The SEM is coupled to the EDS for the elementary
microanalysis.
? Maximum voltage 30 kV.
4.7. The nanoindentation
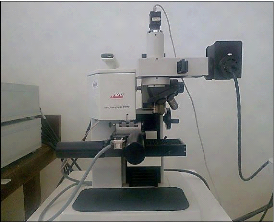
Fig.4.13: The nanoindentation device CSM_NHT of CDTA
The indenter used on our characterization equipment CSM_NHT
(Nano-Hardness Testers is a Berkovich indenter (pyramidal with triangular base
geometry). We can apply a normal force between 0.3mN and 500mN.
|
h
cos65.27° = b
a = 2v3 h ??a??65.3°
|
|
63
Fig.4.14: The geometry of Berkovich Point
Chapter 4: Experimental Process
64
Fig.4.15: the footprint of the Berkovich tip
During an indentation test an acquisition system records the
applied force as a function of the penetration depth of the tip. These two
parameters are measured during a charge phase and a discharge phase. The result
is a load-displacement curve.
The two main properties measured by the nanoindentation are
the modulus of elasticity (E) and the hardness (H). The model used for the
calculation of these two properties is that developed by Oliver and Pharr.
According to this model the hardness is given either geometrically (fig.4.16)
or analytically by:
????????
H = (4.2)
????
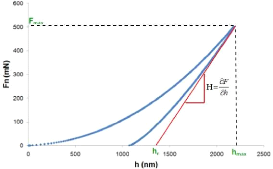
Fig.4.16: The determination of the hardness from the
charge-discharge curve
Fmax : Maximum applied load;
Ac : The contact area between the indenter and the
sample which is given in the case of a Berkovich indenter by:
65
Chapter 4: Experimental Process
A?? = 24,56 · hC 2 (4.3)
????????
hC= h?????? - ??· (4.4)
??
???? 2
?? = ??h = · ???? · vAC (4.5)
vit
Er : reduced Modulus of elasticity.
The modulus of elasticity of material is given by:
?? = (1 - v2) ( ???? · ???? )
(4.6)
????(1 - v??2) - ????
ui: Poisson's ratio of the indenter; u:
Material Poisson's ratio;
Ei : Modulus of elasticity of the indenter.
In our nanoindentation tests, we used the Oliver-Pharr model with
the following parameters:
- Spherical diamante Berkovich indenter ( r =
10ìm) in diameter
- approaching speed: 2500 nm/min
- Time of charge and discharge: 10.0 s
- Linear load increment
- Slope to contact: 80%
- Load Speed: 2.00 mN/min
- Speed of discharge: 2.00 mN/min
- Material Poisson's ratio u = 0.30
This device is equipped with an optical microscope to select the
area to be indented. An X-Y
motorized table with a repositioning accuracy of 1 ìm
allows the programming of complex
indentation networks.
4.8. The tribometer analysis
On the CSM tribometer (fig.4.18), a ball, a tip or a plane is
placed in contact with the surface of the sample under a predetermined load.
The device is mounted on a lever arm, and associated with a displacement
sensor.
The coefficient of friction is determined during the test by
measuring the deflection of this elastic arm. The wear rates for the ball and
the pawn are calculated by determining the loss of volume during the test. The
formula for determining the wear rate WS is given by:
??
????= ?? · ???? (4.7)
66
Chapter 4: Experimental Process
??: The volume of lost matter
(mm3) ;
D: The covered distance (mm)
;
F??: The normal force applied to the sample
(N).
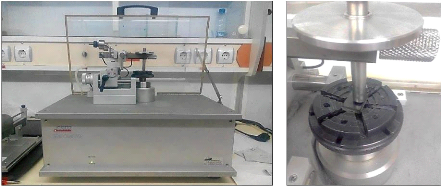
fig.4.17 : Tribometer of the USTHB
The volume of the waste material is calculated by the
formula:
?? = 2??R [r2 aresi?? (d2r) -
(4d) · v4r2 - d2] (4.8)
R: Radius of the wear track
(mm);
r: Radius of the ball (mm);
d: Width of the wear track
(mm).
Tribometer analysis facilitates the study of friction
mechanisms for a wide variety of material couple with or without lubricating
agent. In addition, the control of test parameters such as speed, contact
pressure, frequency, test duration and environmental parameters make it
possible to reproduce the actual stresses of use of these
materials.
Instruments can provide rotational or alternative
movement of the sample. A particular point of these instruments is based on the
possibility of interrupting the test as soon as the coefficient of friction
reaches a predefined value or, when a number of cycles is realized. In
addition, the tribometer is equipped with a containment enclosure in order to
use the instrument under controlled atmospheric temperature
conditions.
The Tests performed by tribometer conforming to ASTM G99
& DIN 50324.
The specifications of the CSM tribometer are:
67
Chapter 4: Experimental Process
|
Nano
|
Micro
|
|
Normal Strength Range
|
50 ìN - 1 N
|
until 60 N
|
|
Maximum tangential force
|
10 ìN - 1 N
|
10 N
|
|
Maximum temperature
|
-
|
1000 oC
|
|
Rotation speed
|
1 - 100 rpm
|
0.3 - 500 rpm
|
|
Rotating test radius
|
30 ìm - 10 mm
|
30 mm
|
|
Linear travel speed
|
10 - 500 ìm
|
60 mm
|
|
Length of linear travel
|
Until 10 mm/s
|
until 100 mm/s
|
|
Frequency
|
0.1 - 10 Hz
|
1.6 Hz
|
|
Penetration depth measurement
|
20 nm - 50 ìm
|
until 1.2 nm
|
Table 4.2: The specifications of the CSM tribometers
The characteristics of our work:
- Geometry of the tip: Ball;
- Material of the tip: alumina????2??3 ;
- Radius of the ball: 3.00 mm;
- Linear speed: 0.50 cm/s;
- Normal load: 1.00 N;
- Stop condition: 10.00 Meters travelled or if ii > 1.00 ;
- Temperature: 20.00 °C ;
- Humidity: 40.00 %.
4.9. Electrochemical techniques
4.9.1. Equipment
The polarization measurements were carried out in a
three-electrode glass cell: a working electrode, a platinum counter electrode
and a saturated calomel reference electrode (SCE). This cell, shown in figure
4.18, is designed to maintain a fixed distance between the three electrodes.
The passage of the current in the cell is carried out through the
counter-electrode.
68
Chapter 4: Experimental Process
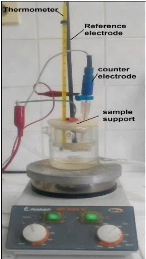
Figure 4.18: the Cell used in electrochemical test
Electrochemical measurements were conducted using a
computer-controlled, potentiostat, model parstat 4000 (Fig.4.19).
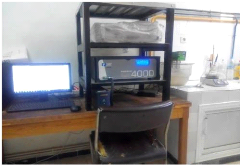
Fig.4.19: Assembly for electrochemical testing
4.9.2. Establishment of EVANS diagrams
The purpose of the EVANS diagram is to rapidly obtain, by a
laboratory measurement, the corrosion rate and the corrosion current density
denoted icorr from the polarization curves
69
Chapter 4: Experimental Process
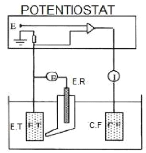
Fig.4.20 Diagram of the electrochemical cell
The potential measurement is carried out in a given aggressive
medium at a given temperature by means of a potentiostat to which are connected
three electrodes.
? The working electrode E.T constituted by the metal
studied,
?
· The reference electrode E.R which serves as a
reference for the dissolution potential, ?
· The counter electrode
C.E, which is a platinum electrode used to drain the major part
of the current flowing through the circuit when the working
electrode is subjected to an
overvoltage.
4.9.3. Diagram E=f (log/i): EVANS Diagram
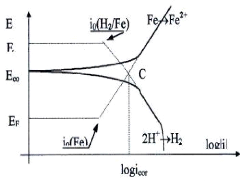
Fig.4.21: a polarization curve modal
To measure the corrosion current density, the representation E
= f (i) is modified, we switch
coordinates to E = f (log / i) or EVANS
diagram in order to linearizes the polarization curve and
Chapter 4: Experimental Process
makes it possible to determine Experimentally the value of
corrosion current density icorr. THE CURRENT is obtained by
extrapolating the linear parts of the anodic and cathodic polarization curves.
This point of assistance, in cases where it is quite clear, gives access to the
characteristics of corrosion (corrosion potential and the corrosion current
density), these two linear parts, respectively called the anodic and cathodic
Tafel branches.
We see clearly on this diagram the Tafel domain in which the
potential varies linearly with the logarithm of the intensity according to the
equations of Tafel
For the anodic process:
i
(4.9)
i0(Fe)
i
(4.10)
i0(H2/Fe)
E = EFe + ba log For the cathodic process:
E = EH + bC log
70
EFe,i0(Fe),EH, i0(H2/Fe) are respectively The
equilibrium potentials and the exchange current of the couples Fe2+/Fe et H+/H2
; ba et bc Are the Tafel constants of oxidation and
reduction, (ba>0)
This graphic construction therefore provides access to these two
important corrosion data. The calculation of Tafel's equations is based on
equality:
i i
Ecorr = EFe + ba log i0(Fe)= EH + bC log
i0(H2/Fe) (4.11)
Chapter 5
Analysis of the results
Chapter 5: Analysis of the results
72
5.1. Analysis of XRD results
- Stainless steel bars:
The phases of the thin film were evaluated by the XRD analysis,
and the results are shown in the figure 5.1.
We can see that the deposited layer is an amorphous layer which
does not have a crystallographic alignment with a random orientation of the
grains, so it is inaccessible by X-ray diffraction.
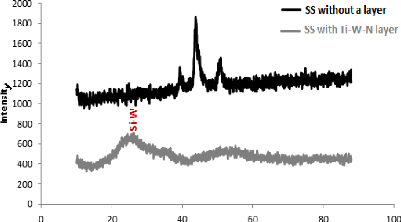
Fig.5.1: XRD spectra of the Stainless steel bars with and
without a layer of Ti-W-N
According to fig. 5.1, a bump can be observed on the angular
value 2è = 23.5°, which corresponds to tungsten silicon (Si-W) in
its amorphous form, which is requiring a subsequent heat treatment to obtain
the crystal structure of layer.
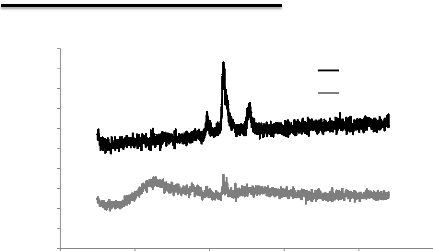
Chapter 5: Analysis of the results
2000
Fe y
vierge
SS without a layer
ss evapo Al-Si+ Ti-W-SS with double layer
1800
1600
1400
1200
1000
800
600
400
200
0
Intensity
Si-W
Fe y
Fe á
73
0 20 40 60 80 100
2-théta-scale
Fig.5.2: XRD spectra of the Stainless steel bars with and
without double layers of Al-Si and Ti-W-N
In the XRD spectra of fig.5.2, we can see again the bump
correspond to the silicon of tungsten (Si-W) at 2è = 23.5
°, we notices also iron peaks belonging to the substrate
which are iron á in 46 ° and iron y at 44
°, which means that the covering of the surface is not perfect and the
formation of an amorphous layer.
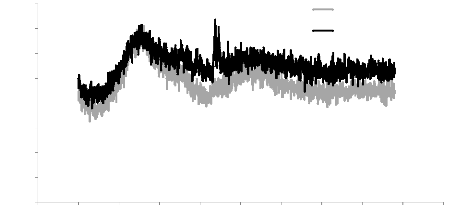
SS withTi-WN Ti
-W-N layer
ss evapo AlSi+ TiWN
SS with Al-Si and Ti-W-N double
layers
700
600
500
400
300
200
100
0
Intensity
800
0 10 20 30 40 50 60 70 80 90 100
2-théta-scale
Fig.5.3: XRD spectra of the Stainless steel bars with double
layers of Al-Si and Ti-W-N and with a layer of Ti-W-N
74
Chapter 5: Analysis of the results
Figure 5.3 shows that the intermediate layer deposited by
evaporation between the substrate and the Ti-W-N layer influences in the layer
diffraction properties in a manner which permits the appearance of peaks
corresponding to the substrate.
- Aluminum bars:
The diffraction spectra of Ti-W-N layer are shown in figure
5.4.
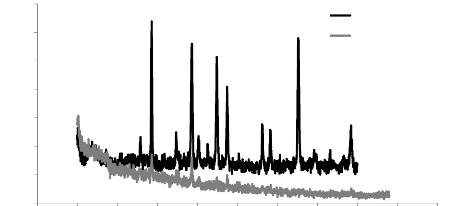
700
l-i vierge
Al-Si without a layer
Ti-W-N
Al-Si with a Ti-W-N layer
600
500
400
300
200
100
0
Intensity
0 10 20 30 40 50 60 70 80 90 100
2-théta-scale
Fig.5.4: XRD spectra of Aluminum-Silicon bars with and
without a layer of Ti-W-N
The spectra obtained by the XRD analysis of the Ti-W-N layer
on the aluminum substrate shows that a layer with peaks similar to that of the
substrate with an amorphous structure was formed.
5.2. Analysis of RAMAN results
The results obtained by the RAMAN on the Ti-W-N layer for
different substrates are given by the following curves:
Chapter 5: Analysis of the results
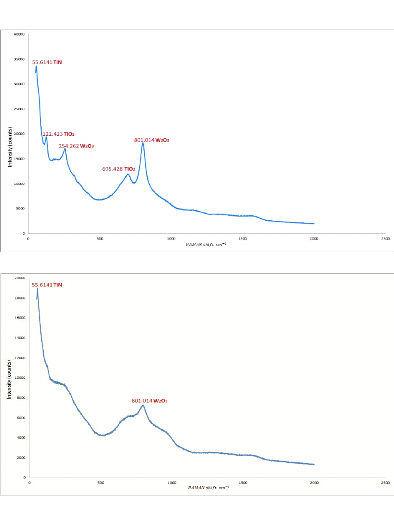
Fig.5.5: RAMAN specter of Al-Si bar with Ti-W-N layer
Fig.5.6: RAMAN specter of stainless steel bar with Ti-W-N
layer
75
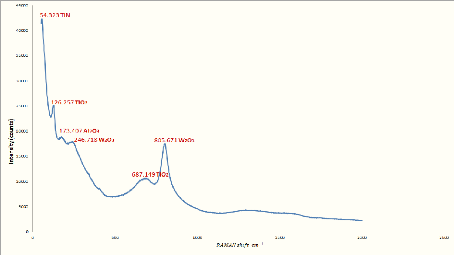
76
Chapter 5: Analysis of the results
Fig.5.7: RAMAN specter of stainless steel bar with double
layers of Al-Si and Ti-W-N
It is good to notice that the spectrum obtained for different
bars are almost the same, which means that the same elements have been observed
in the deposited layer for different substrates.
We can identify the spectrums peaks as the following:
- Peaks with the wavenumber 125 ????-1 and
675 ????-1 can be corresponded to titanium dioxide
????02 peaks [IOP/http];
- Peak with a wavenumber close to 62.5
????-1 can be corresponded to a titanium nitride ??????
peak [CHE94];
- Peak with a wavenumber close to 807
?`??-1 can be corresponded to a tungsten oxide
W203 peak [COU64];
- Peak with a wavenumber close to 172 172
????-1 observed in the spectra of stainless steel with
double layers of Al-Si and Ti-W-N can be corresponded to an aluminum oxide
????203 peak [AND02].
From the RAMAN spectrum results, it can be said that our layer
contains titanium Ti, tungsten W and nitrogen N, in the form of tungsten oxide,
titanium nitride and titanium dioxide. All of these peaks (except the
????02 peak in stainless steel substrate) are observed in different
bars.
In the contrary of the XRD results in which amorphous results
are obtained, the RAMAN results are identified all the elements of the thin
layer, which can be explained by the operating principle of each instrument.
The XRD gives results for a crystallographic analysis, so it allows us
essentially to determine the crystalline composition of the layer, which is
practically difficult without a recrystallization of the deposition by an
appropriate heat treatment.
77
Chapter 5: Analysis of the results
RAMAN, on the other hand, is used for chemical analysis. It
allows us directly to observe the chemical composition by the diffusion of the
light at the frequency of the radiation caused by the vibrations of the
molecules.
5.3. Morphological analysis
Figure 5.8 shows pictures from the Scanning Electron
Microscopy of a stainless steel bar with the double thin layer of Al-Si and
Ti-W-N.
In the picture b) we observe the formation of a layer made up
with a small nanoparticle of the order of 50 nm in diameter, and particles of
large diameter which can reach 500 nm incorporated in the surface, the
interaction of these particles creates a form of deposition called the
clusters, those clusters collide one another in order to increase their number
and size until the coalescence density where the agglomeration commences, and
the uncoated substrate surface reduces.
a) b)
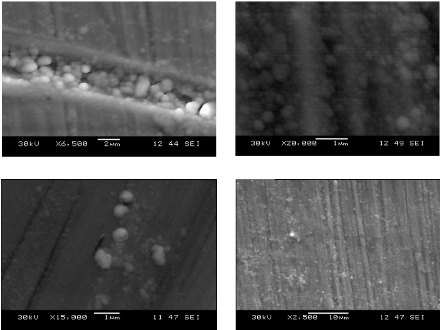
c) d)
Fig.5.8: SEM pictures, magnification of the double layers
Al-Si and Ti-W-N on stainless steel with apparition of
nanoparticles
78
Chapter 5: Analysis of the results
The morphology and the topography of the layer were studied by
the SEM on a cross section of a silicon bar with the thin layer (fig.5.9). The
cross section of the bar shows a columnar structure terminating with domes at
the surface, with grain diameter between 50 and 400 nm.
The mean thickness measured is about 1.1 rim, which lasted one
hour of deposition, what means that the growth rate is equal to 0.30 nm/ s.
That rate is a very large, which means that the deposition is not an atom by
atom layer. It is reasonable to assume that non-uniform nucleation at the
substrate surface at the beginning of deposition is the main cause of the
nonuniform growth of the layer, which cause to the random Nano-crystallization,
and this can explain the XRD results.
a) b)
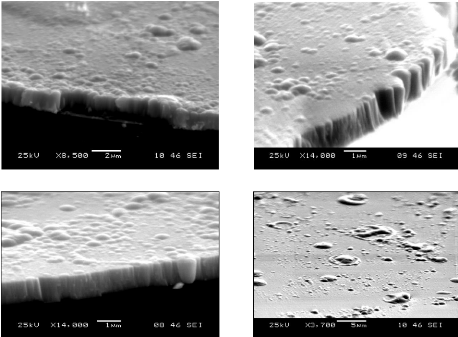
c)
d)
Fig.5.9: SEM pictures; cross section of a silicon bar with
a Ti-W-N layer
5.4. Interpretation of nanoindentation
results
The charge-discharge curves of different bars for different
depths and effort are given in the
annex, the mechanical properties obtained for each test are
given in the following curves, besides the tables of the results are given in
the Annex II.
Chapter 5: Analysis of the results
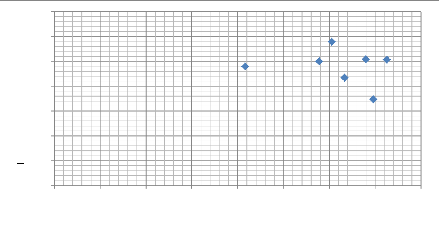
Modulus of elasticity E (G Pa )
140
120
100
40
80
60
20
0
0 50 100 150 200 250 300 350 400
Max depth (nm)
79
Fig.5.10: Scatter plot of modulus of elasticity as a
function of the max depth (nm)
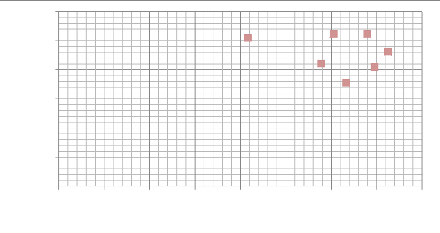
Hardness (GPa)
3000
2500
2000
1500
1000
500
0
0 50 100 150 200 250 300 350 400
max depth (nm)
Fig.5.11: Scatter plot of hardness as a function of the max
depth (nm)
Chapter 5: Analysis of the results
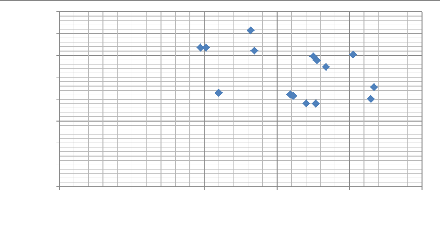
Modulus of elasticity E (G Pa)
4000
8000
7000
6000
5000
3000
2000
1000
0
0 50 100 150 200 250
max depth (nm)
80
Fig.5.12: Scatter plot of modulus of elasticity as a
function of the max depth (nm)
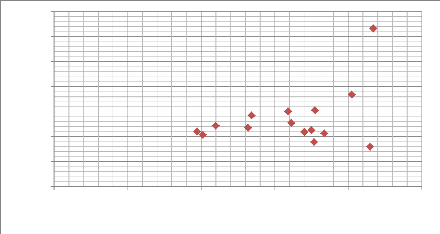
Hardness H (MPa)
350
300
250
200
150
100
50
0
0 50 100 150 200 250
max depth (nm)
Fig.5.13 Scatter plot of hardness as a function of the max
depth (nm)
Chapter 5: Analysis of the results
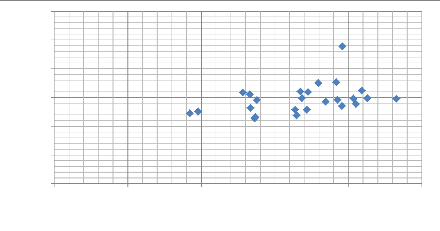
Modulus of elasticity E (GPa)
300
250
200
150
100
50
0
0 50 100 150 200 250
max depth (nm)
81
Fig.5.14 scatter plot of modulus of elasticity as a
function of the max depth (nm)
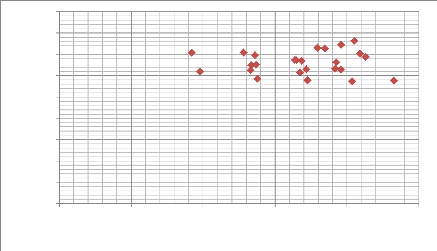
Hardness H ( M Pa)
4000
9000
8000
7000
6000
5000
3000
2000
1000
0
0 50 100 150 200 250
max depth (nm)
Fig.5.15 scatter plot of hardness as a function of the max
depth (nm)
There are in fact four factors to optimize in order to
increase the hardness of a layer: the nature of the material of deposition; its
microstructure and its architect which are more or less interdependent, and
also there is the ionic bombardment during the growth of the film.
If we make a comparison between The hardness values obtained
and the hardness values of layers with titanium, we find that our values are of
low hardness, this can be explained by the low content of interstitial element
(nitrogen) which is 5%, what means a large percentage of
82
Chapter 5: Analysis of the results
substitutional elements (the transition elements of titanium
and tungsten). Indeed, when the content of transition elements increase, the
average size of the crystallites decreases [TAK08/A], the decrease in the size
of the crystallites is the origin of the decrease in the hardness. This effect
is found in the Hall and Petch law, which reflects the fact that the tensile
stress of material is inversely proportional to the square root of the mean
crystallite size [TAK08/A].
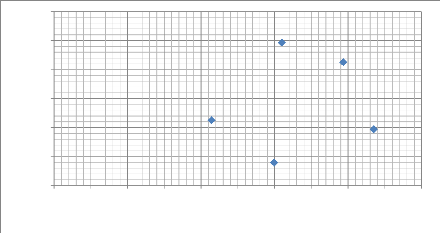
Modulus of elasticity E (G Pa )
170
165
160
155
150
145
140
0 20 40 60 80 100 120 140 160 180 200
max depth (nm)
Fig.5.16: Scatter plot of modulus of elasticity as a
function of the max depth (nm)
Hardness H (MPa)
20000
18000
16000
14000
12000
10000
4000
8000
6000
2000
0
0 20 40 60 80 100 120 140 160 180 200
max depth (nm)
Fig.5.17: Scatter plot of hardness as a function of the max
depth (nm)
We can see in this latter bar, that its hardness is very high
compared to that measured in the preceding bars and reach a value of 17172 MPa.
Indeed, large harnesses are measured in the
83
Chapter 5: Analysis of the results
case of multilayers, and the cause of this phenomenon is
generally attributed to a combined effect including the blocking of the
dislocations at the interfaces between the layers and the intrinsic structural
differences in each layer [CIE99].
5.5. Interpretation of tribometer results 5.5.1. The
coefficient of friction
The coefficient of friction is not an intrinsic property
for a single material, but it is a value which depends on a couple of
materials. In our study, the antagonist material of our bars is the
aluminaAl2O3. The conditions of the study are given
in the previous chapter.
Figure 5.18 shows the coefficient of friction variation
for the Al-Si bare in terms of distance traveled, and Table 5.5 shows the
statistical results of the coefficient of friction obtained.
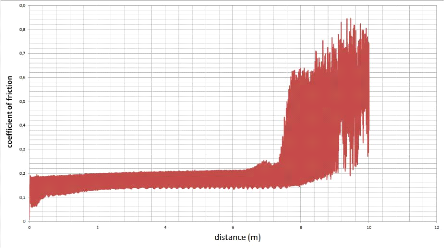
Fig.5.18: Curve of the coefficient of friction
variation for the Al-Si bare as a function of distance
traveled
|
u min
|
u max
|
u moyen
|
Standard deviation
|
|
0,00753824645653367
|
0,845997452735901
|
0,233906209468842
|
0,138767600059509
|
Table5.1 statistical results of the coefficient of
friction obtained
According to the curve, it can be seen that, from 0 m
to 7.4 m, the coefficient of friction value is low (between 0.06 and 0.26),
after that it increases abruptly to reach higher values (between 0.62 and
0.85), this is due to the existence of an aluminum oxide (alumina) layer on the
substrate surface with very low thicknesses, and which has a low coefficient of
friction. If the values corresponding to the alumina are eliminated, the
following results are obtained:
84
Chapter 5: Analysis of the results
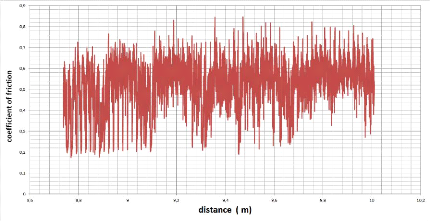
Fig.5.19: Curve of the coefficient of friction variation
for the Al-Si bar as a function of distance traveled
without the alumina
values
|
u min
|
u max
|
u moyen
|
Standard deviation
|
|
0,1744
|
0,846
|
0,5253
|
0,1154
|
Table5.2 statistical results of the coefficient of friction
obtained
The curve in Figure 5.20 shows the friction coefficient
variation for the Al-Si bar with the Ti-W-N layer, and Table 5.7 gives the
statistical results obtained.
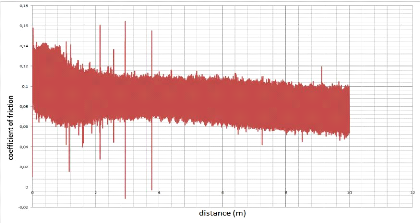
Fig.5.20: Curve of the coefficient of friction variation for
the Al-Si bar with Ti-W-N layer as a function of distance
traveled
85
Chapter 5: Analysis of the results
|
u min
|
u max
|
u moyen
|
Standard deviation
|
|
-0,0074
|
0,1644
|
0,0857
|
0,0145
|
Table5.3: Statistical results of the coefficient of friction
obtained
Comparing the results obtained for a piston without
and a piston with a thin layer of Ti-W-N, we noticed that the coefficient of
friction decreases from 0.5253 to 0.0857, that is to say the use of this thin
layer Allows us to reduce piston friction (if we consider that the antagonist
material is alumina) by about 613%.
By way of comparison of the coefficient of friction of
the layer for different substrates, we can give the results obtained from this
layer deposited on the stainless steel 304 and on a layer of Al-Si deposited by
evaporation on the stainless steel 304.
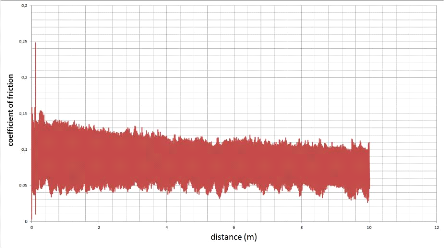
Fig.5.21: Curve of the coefficient of friction variation for
the stainless steel bar with Ti-W-N layer as a function of
distance traveled
|
u min
|
u max
|
u moyen
|
Standard deviation
|
|
0,0031
|
0,2477
|
0,0839
|
0,0182
|
Table5.4: Statistical results of the coefficient of
friction obtained
86
Chapter 5: Analysis of the results
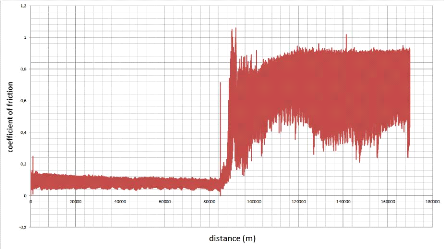
Fig.5.22: Curve of the coefficient of friction variation for
the stainless steel bar with double layers of Al-Si and Ti-W-N as a function of
distance traveled
|
u min
|
u max
|
u moyen
|
Standard deviation
|
|
0,0031
|
0,2477
|
0,0839
|
0,0182
|
Table5.5: Statistical results of the coefficient of
friction obtained
From these results it can be estimated that the mean
value of the coefficient of friction for the torque Ti-W-N / Al2O3 is 0.08,
which represents in fact a low value.
If we compare the results obtained between the bar
with and a without the thin layer of Ti-W-N in terms of dissipated energy in
the contact during the work, using the Coulomb's law:
Es= u
· Fn
·Ds
u represent the sliding friction coefficient
which has a value of 0.52 for the Al-Si bar without Ti-W-N layer and 0.08 for
the Al-Si bar with Ti-W-N layer;
Fn is the normal load applied on
the contact and has a value of 1 N;
Ds is the distance traveled
between the torque and it's equal to 10 m.
The dissipated energy in the torque Al-Si/Al2O3 is
equal to 5.2 Joules for every 10 meters of piston movement i.e. 0.52 J/m, but
in the torque Ti-W-N/Al2O3 it's equal to 0.8 joules for each 10 meters that is
to say 0.08 J/m.
It should be noted that the most of this dissipated
energy in the torque (more than 95%) [COU64] is a heat energy, which requires
for the piston without layer more expense in lubrication and cooling. The
reduction of these losses results a gain in the output and therefore in the
size and mass of the cooling systems and so of the engine.
87
Chapter 5: Analysis of the results
We can add that the propagation of this heat inside the piston
under the effect of the thermal conduction causes the initiation of the
cracking and the creation of thermal stress inside the piston.
The reduction of the friction coefficient by about 613% can be
explained by the studies done by BUCKLEY [BUC67] and COURTEL [COU64] which
point that the friction is minimal on the crystalline planes with the maximum
atomic density, and on these planes in the directions of maximum atomic
density.
If we make a comparison of the friction factors in different
atomic structures we can notice that the crystalline materials with a hexagonal
structure have generally lower values of the coefficient of fiction than those
in cubic structures.
The origin of this phenomenon is that the atoms of the
hexagonal structures are strongly bound with all their neighbors and have just
some freedom to establish interfacial bonds with the atoms of the antagonistic
materials. On the other hand, the coefficient of friction depends on the force
required to break the interfacial binding between the torque surfaces
[GRA08].
The structure of aluminum is a face-centered cubic structure,
but Titan and nitrogen have a hexagonal structure, and tungsten has a centered
cubic structure, that structure has sliding planes less than those of
face-centered cubic structure.
5.5.2. Wear Rate
The method allows us to obtain the wear rate was given in
chapter 4. This method based on the measurement of the wear track using the
optical microscope. The representation of the wear track for the different bars
is given in the following figures, and the values of volume of tearing mater
and that of wear rates are given in Table 5.6.
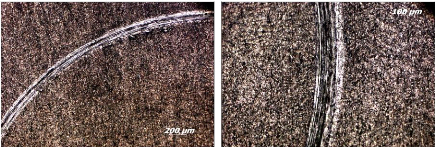
Fig.5.23 the wear track on the Al-Si bar without
layer
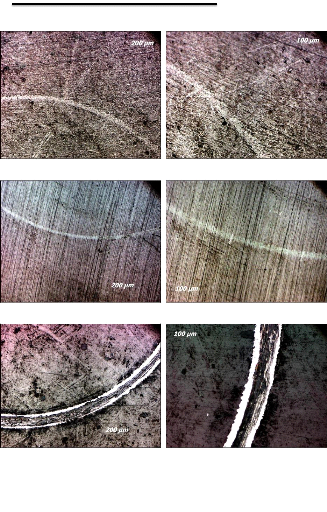
88
Chapter 5: Analysis of the results
Fig.5.24 The wear track on the Al-Si bar with the layer of
Ti-W-N
Fig.5.25 The wear track on the stainless steel bar with the
layer of Ti-W-N
Fig.5.26 The wear track on the stainless steel bar with
double layers of Al-Si and Ti-W-N
89
Chapter 5: Analysis of the results
|
Al-Si without layer
|
Al-Si with Ii-W-N
|
|
volume of tearing
mater (mm3)
|
Wear rate (mm2/N)
|
volume of tearing
mater (mm3)
|
Wear rate (mm2/N)
|
|
2325.52
|
0.2326
|
1309.18
|
0.1309
|
|
Stainless steel with Ii-W-N
|
Stainless steel with Al-Si and Ii-W-N
|
|
volume of tearing
mater (mm3)
|
Wear rate (mm2/N)
|
volume of tearing
mater (mm3)
|
Wear rate (mm2/N)
|
|
798.79
|
0.08
|
3614.29
|
0.3614
|
Table 5.6 Volume of tearing mater and the wear rate of
different bars
We can see from these results that the wear rate for a piston
without a layer has an acceptable value of 0.2326 mm2 / N, but it can be
reduced by almost the half when we add the Ti-W-N layer.
For the Ti-W-N layer, the wear rate value is varied between
0.08 and 0.13, which represents very good results for a torque of metal / metal
which has an average of values between 1 to 0.1 mm2/N [HOL58].
5.6. Corrosion test results
In this test, we search to resolve the question of whether the
thin layer of Ti-W-N is able to protect the metal substrate against corrosion
in a solution of 5% NaCl at 25° C.
The results presented in this paragraph concern the thin layer
of Ti-W-N produced by the cathode sputtering process which is shown in the
EVANS diagrams in order to obtain the corrosion rate of the layer.
The polarizability curve log(i) = f(i) allow us to determine
the corrosion potential E(I = 0) using the Tafel lines and also the corrosion
current. This quantity has a huge importance to evaluate the corrosion rate by
the Faraday law.
We can notice that the two curves are parallel, which indicate
that the two bars have an identical corrosion mechanism.
Nevertheless those results are totally in contradiction with
the fact that the different compounds formed in the layer (TiN, TiO2, W2O3...)
have good corrosion resistance characteristics in aggressive medium. We can
explicate this contradiction by saying that this layer is deposited in the form
of column with significant porosity between the grains formed, and this will
cause to concentrate the phenomenon of corrosion on small zones, that type of
corrosion called pitting (see chapter 2), which acceleration the degradation of
the layer .
These results can be overcome by:
? Variation of the layer deposition parameters, the increasing
of the deposition energy lead to more compact and denser structure;
Chapter 5: Analysis of the results
? Variation of nitrogen concentration.
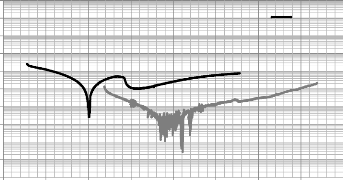
SS + TI-W-
N
1
0,1
0,01
log(i), i en A
0,001
0,0001
,00001
0,000001
0,0000001
1E-08
1E-09
1E-10
90
-0,4 -0,3 -0,2 -0,1 0 0,1 0,2 0,3 0,4
Potential (V)
Fig.5.31: Curve of polarizability of the bars of the
stainless steel with and without the layer on a logarithmic scale
Chapter 6
Piston's loads study
92
Chapter 6: Piston's loads study
6.1. Mechanical analysis of the internal combustion
engine piston using SOLIDWORKS
The piston is one of the most important components of the
internal combustion engine. Piston fails mainly due to mechanical stresses and
thermal stresses. In this paper is determined by using the finite element
method, stress and, deformation and displacement distribution.
6.1.1. Initial data
The study considers a flat sample of aluminium - silicon alloy
with dimension of (20X20 mm), subjected to 50 KN of normal force which is
equivalent to 100 bar.
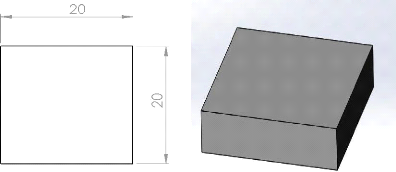
Fig.6.1. Dimensions of the piston (a) and 3D model of the
piston (b)
The material used for the piston is aluminium -silicon
eutectic alloy. The properties used are in table 1.
properties of the material value
Density 2670 kg/m3
Young's modulus 95.88 Gpa
Poisson `s ratio 0,33
Tensile yield strength 66.13 Mpa
Table 6.1.properties of the sample
93
Chapter 6: Piston's loads study
The material properties used for the Ti-W-N thin layer, are in
table 2.
properties of the material value
Density 4810 kg/m3
Young's modulus 122.73 Gpa
Poisson `s ratio 0,33
Tensile yield strength 160.8 Mpa
Table 6.2 Properties of the Ti-W-N thin layer
6.1.2. Finite element analysis of the sample 6.1.2.1.
Sample with thin coating
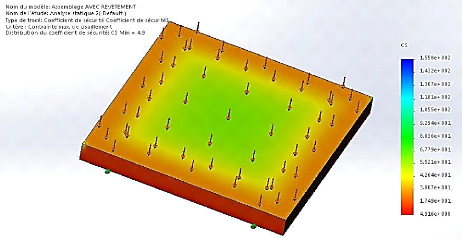
Fig.6.3. shear stress due to mechanical load for the sample
with the thin film coating
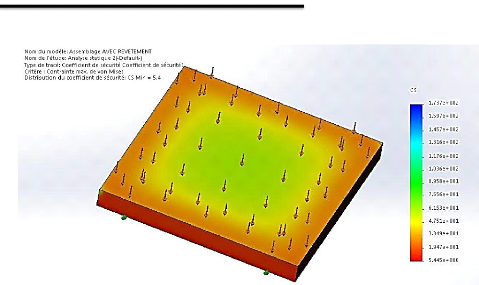
Chapter 6: Piston's loads study
94
Fig.6.4. VON MISES stress due to mechanical load for the
sample with the thin film coating
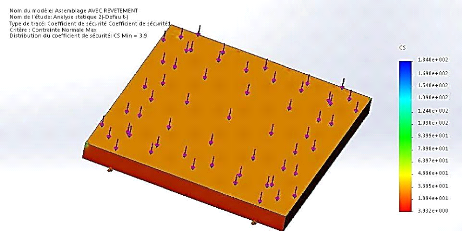
Fig.6.5. Normal stress due to mechanical load for the
sample with the thin film coating
95
Chapter 6: Piston's loads study
6.1.2.2. Sample with thin coating
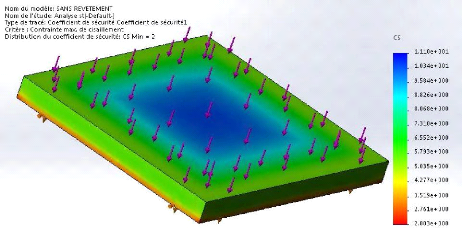
Fig.6.6. Shear stress due to mechanical load for the bare
sample
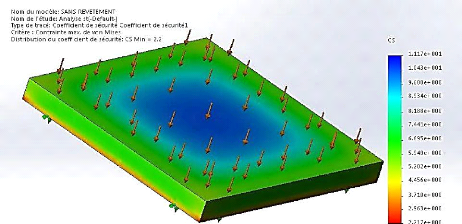
Fig.6.7. VON MISES stress due to mechanical load for the bare
sample
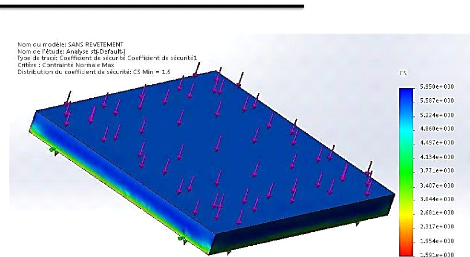
Chapter 6: Piston's loads study
96
Fig.6.8: Normal stress due to mechanical load for the bare
sample
|
Sample without coating
|
Sample with coating
|
|
Shear stress
|
Sc = 2
|
Sc =4.9
|
|
VON MISES stress
|
Sc = 2.2
|
Sc = 5.4
|
|
Normal stress
|
Sc = 1.6
|
Sc = 3.9
|
Table.6.3. table summarizing the minimum values of safety
coefficient 6.1.3. Analysis of the result
Table 6.3 shows clearly the impact of the thin films to the
resistance characteristic of the sample, just by using a 1um of hard thin films
the minimum value of safety coefficient jumped with 2.5 times to a much safer
zone
Analysing the figures 6.4 and 6.8 we noticed a small drop on
the VON MISES stress in the sample with the thin coating, even if this result
is not what we hoped for, but it proof that a thin film can provide much
greater characteristic just by using a small amounts of materials.
Conclusion
103
Conclusion
Conclusion
In this study our main purpose is to have very thin coating
with high mechanical and thermal properties ( hardness and low friction
coefficient) in order to use it in the car industry to limit the energy losses
by friction between the piston and the cylinder , the used samples are taken
from a real piston to have more realistic results.
In the way of searching to upgrade the mechanical
characteristics of ordinary surfaces (the wear and the abrasive resistance ),
we chose to deposit a thin layer based on titanium and tungsten in a medium
containing 5% of nitrogen gas and the rest is argon gas, the choice in its se
is innovative because this coating is not a very well-known one in the
industrial field , the combination of titanium which is relatively a light
material with excellent corrosion resistance and in the other side the hardness
of the tungsten and its very high melting point provide the necessary
improvement for the engine pistons to reach a very high efficiency .
We noticed that The thin film layer grow mainly from a
nanoparticles with a diameter less than 1um, the interaction of this
nanoparticles with each other form a micro particles called clusters, the
growth of this clusters will form a columnar structure which will end by
creating a granular structure with an inter-granular space which is in direct
relation with the used energy and the deposition speed.
The measurement of the thin film thickness indicate that the
deposition speed have a value of 0.30nm/s which is a very high speed if we take
in consideration that the diameter of the atoms is a few Angstroms , so the
growth of the thin film layer is taking place by accumulation of macro
molecules with different orientation on the top of the surface which will cause
a none Crystallographic alignment to appear, so in order to have a uniform
structure we recommend to increase the energy of deposition in in order to
break the molecules bond to a small one which will increase significantly the
density and the porosity of the thin film enabling us to reach a higher
mechanical and thermal properties
The obtained structure present a low hardness of 2 Gpa with a
value of 0.9 for the friction coefficient which is very good if we take in
consideration that the deposited thin layer have an amorphous and heterogeneous
structure and low density.
Even if the result of the Ti-W-N thin layer deposited on a
sample of aluminum -silicon sample are not what we hoped for because they
didn't reach the hardness of the usual hard thin films, in the other side the
samples of stainless steel with the same deposition condition of temperature
and pressure gave much greater value than the aluminum samples
104
Conclusion
In order to a better characterization of the surface we
established a corrosion test for the samples with and without thin layer , the
results were significant , and they confirmed the previous results , the
corrosion rate for the coated area were much greater than the bare ones which
is mainly due to the high porosity of the surface
This study enable us to break into the nanomaterials world and
to discover the and to discover the large potential of this field and for our
study it's still promising in order to achieve the hardness of the ultra-hard
materials, and also the part that we didn't get into it which is the thermal
conductivity of the surface mainly because the lack of the necessary equipment
to measure the thermal conductivity which is a very important parameter to
determine if the coating represent a thermal barrier between the combustion
chamber and the aluminum piston, and if its right it will decrease the energy
losses through the piston enabling us to reach high thermal efficiency.
Appendices
AI 2
Appendix I: nanoindentation loading-unloading
curves
Appendix I: Nanoindentation loading-unloading
curves
1. Aluminum-silicon without a layer
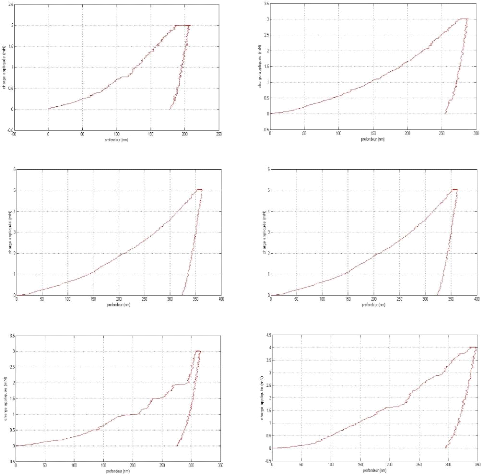
Appendix I: nanoindentation loading-unloading
curves
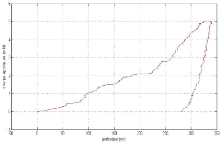
Fig.I.1: loading-unloading curves for 7 tests of
aluminum-silicon sample without a layer
2. Aluminum-silicon with a Ti-W-N layer
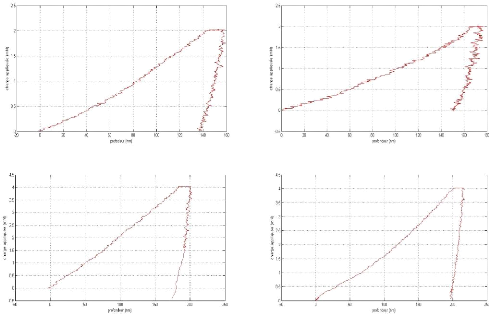
AI 3
AI 4
Appendix I: nanoindentation loading-unloading
curves
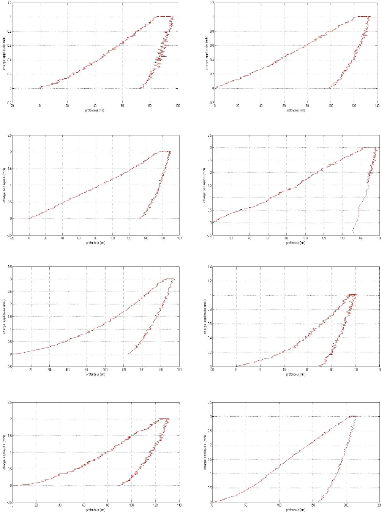
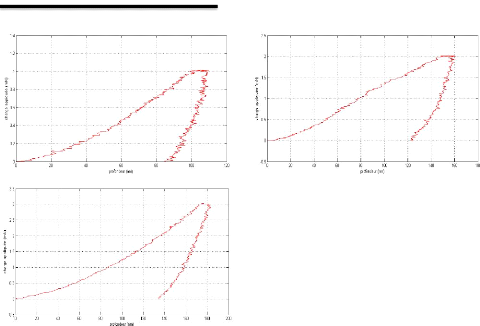
Appendix I: nanoindentation loading-unloading
curves
AI 5
Fig.I.2: loading-unloading curves for 15 tests of
aluminum-silicon sample with a Ti-W-N layer
3. Stainless steel with a Ti-W-N layer
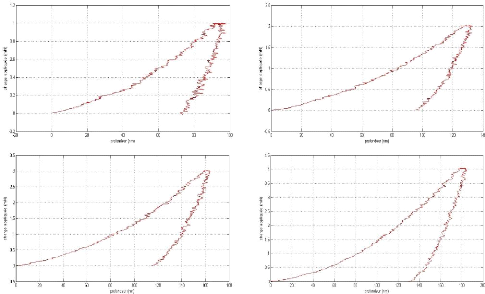
AI 6
Appendix I: nanoindentation loading-unloading
curves
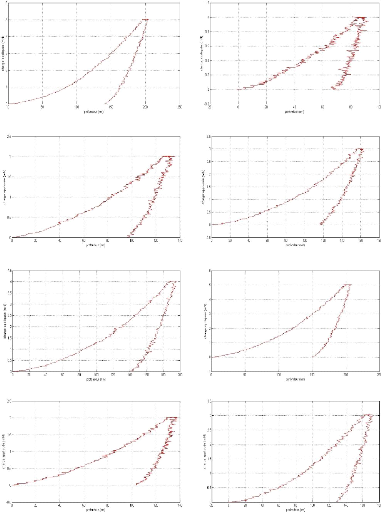
AI 7
Appendix I: nanoindentation loading-unloading
curves
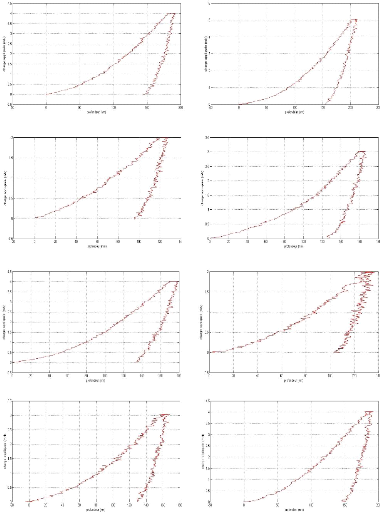
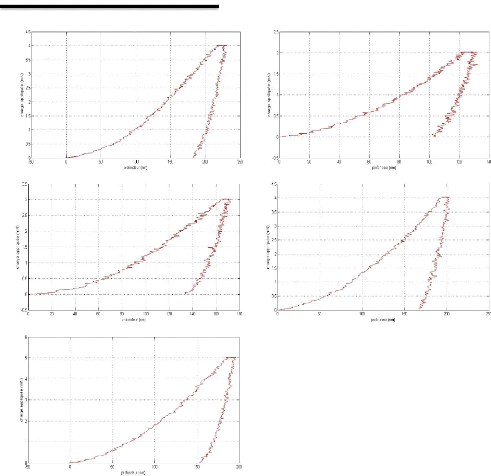
Appendix I: nanoindentation loading-unloading
curves
AI 8
Fig.I.3: loading-unloading curves for 25 tests of stainless
steel sample with a Ti-W-N layer
4. Stainless steel with double layers of Al-Si and
Ti-W-N
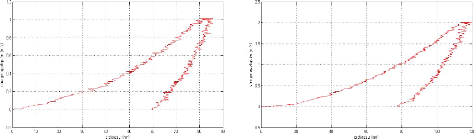
Appendix I: nanoindentation loading-unloading
curves
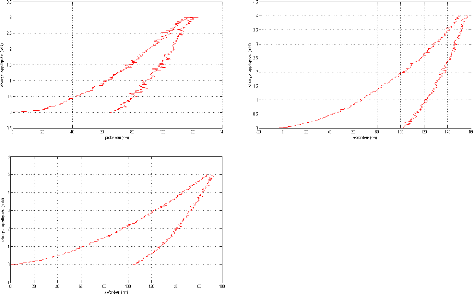
AI 9
Fig.I.4: loading-unloading curves for 05 tests of stainless
steel sample with double layers of Al-Si and Ti-W-N
AII 1
Appendix II: Nanoindentation results
Appendix II: Nanoindentation results
1. Aluminum-silicon without a layer
|
Tests
|
Modulus of elasticity E (GPa)
|
Hardness H (MPa)
|
Hardness HV
|
|
#01
|
95.921
|
2550.3
|
236.18
|
|
#02
|
100.03
|
2105.9
|
100.03
|
|
#03
|
115.81
|
2615.5
|
242.23
|
|
#04
|
101.34
|
2309.9
|
213.93
|
|
#05
|
86.902
|
1774.4
|
164.33
|
|
#06
|
69.493
|
2051.5
|
189.99
|
|
#07
|
101.67
|
2615.5
|
242.23
|
Table II.1 results of 7 tests of the aluminum-silicon
sample without layer
2. Aluminum-silicon with a Ti-W-N layer
|
Tests
|
Modulus of elasticity E (GPa)
|
Hardness H (MPa)
|
Hardness HV
|
|
#01
|
150.87
|
4214
|
390.26
|
|
#02
|
89.186
|
3795.2
|
351.48
|
|
#03
|
184.44
|
6037
|
559.09
|
|
#04
|
316.43
|
4546.2
|
421.03
|
|
#05
|
109.92
|
6358.7
|
588.89
|
|
#06
|
142.71
|
6218.1
|
575.86
|
|
#07
|
109.32
|
3810.1
|
352.86
|
|
#08
|
153.16
|
5774.6
|
534.79
|
|
#09
|
112.85
|
5957.7
|
551.75
|
|
#10
|
103.58
|
6354.5
|
588.49
|
|
#11
|
117.62
|
7143
|
661.52
|
|
#12
|
79.703
|
4012.2
|
371.57
|
|
#13
|
121.8
|
4289.5
|
397.25
|
AII 2
Appendix II: Nanoindentation results
|
#14
|
127.34
|
4149
|
384.24
|
|
#15
|
106.49
|
5476.3
|
507.17
|
Table II.2 results of 15 tests on the aluminum-silicon bar
with a Ti-W-N layer
3. Stainless steel with a Ti-W-N layer
|
Tests
|
Modulus of elasticity E (GPa)
|
Hardness H (MPa)
|
Hardness HV
|
|
#01
|
125.53
|
6187.7
|
573.05
|
|
#02
|
131.93
|
6494
|
601.41
|
|
#03
|
118.86
|
6714.9
|
621.87
|
|
#04
|
142.77
|
7271.3
|
673.4
|
|
#05
|
138.92
|
7634.4
|
707.03
|
|
#06
|
122.4
|
7072
|
654.95
|
|
#07
|
113.57
|
6949.6
|
643.61
|
|
#08
|
128.51
|
6735.1
|
623.74
|
|
#09
|
134.99
|
6289.6
|
582.49
|
|
#10
|
162.25
|
7032
|
651.24
|
|
#11
|
145.59
|
5856.7
|
542.4
|
|
#12
|
128.83
|
6301.8
|
583.61
|
|
#13
|
176.64
|
6328.8
|
586.12
|
|
#14
|
148.6
|
6880.3
|
637.19
|
|
#15
|
158.82
|
7079.3
|
655.62
|
|
#16
|
160.43
|
6146.1
|
569.19
|
|
#17
|
175.3
|
7308.6
|
676.85
|
|
#18
|
115.72
|
6513.4
|
603.21
|
|
#19
|
149.03
|
6701.1
|
620.6
|
|
#20
|
145.26
|
6627.9
|
613.81
|
|
#21
|
147.96
|
5767.6
|
534.15
|
|
#22
|
155.61
|
6252.9
|
579.09
|
|
#23
|
159.42
|
5783.1
|
535.58
|
AII 3
Appendix II: Nanoindentation results
|
#24
|
148.23
|
5736.4
|
531.26
|
|
#25
|
239.02
|
7450
|
689.96
|
Table.II.3 results of 25 tests on the stainless steel bar
with a Ti-W-N layer
4. Stainless steel with double layers of Al-Si and
Ti-W-N
|
Tests
|
Modulus of elasticity E (GPa)
|
Hardness H (MPa)
|
Hardness HV
|
|
#01
|
151.25
|
8561.6
|
792.9
|
|
#02
|
143.94
|
8780.6
|
813.18
|
|
#03
|
164.64
|
17172
|
1590.3
|
|
#04
|
161.26
|
10408
|
963.9
|
|
#05
|
149.71
|
11397
|
1055.5
|
Table.5.4 results of 05 tests on the stainless steel bar
with double layers of Al-Si and Ti-W-N


