5. Problem and hypotheses
5.1 Problem
As mentioned earlier in this report, climate change is causing
the recent multiplication of both drought and canicular events during summer in
the Médoc region. Therefore, more and more grape sunburn has been
observed, resulting in yield and economic losses. Global warming has caused a
modification of the typical Médoc climate, forcing the producers to
change their production habits. Producers indeed have the choice between
choosing to change the way they produce their wines (change the grape variety
for example) at the risk of producing wines with different organoleptic
profiles, or to adapt to climate change by finding short term solutions to
reduce sunburn.
Château Margaux being an iconic figure of the
Médoc vineyard, and being known worldwide for its exceptional wines, it
seems impossible for them to entirely change their wines profiles. Their only
option is to find solutions to adapt at a production level, without affecting
their grapes and wines quality.
In the long-term, they plan on reorienting their plots of land
to reduce the grapes exposure to the sun on the afternoon. Before being able to
do so, they need to find short-term solutions.
The objective of this study is to find short-term solutions to
adapt and reduce the effects and consequences of grape sunburn on Château
Margaux's wine production.
The problem that will be addressed in this report is:
What short-term solutions can be applied to a
Médoc vineyard to significantly reduce its losses linked with grape
sunburn?
- Will the spraying of a kaolin-based solution on the
grapevine allow to protect the vineyard against grape sunburn?
o Are the symptoms of grape sunburn reduced with the kaolin
spraying on high-temperatures periods?
o Is the microclimate of the bunch lower with the kaolin
spraying?
o Will the sprayed kaolin improve the grapevine physiology and
its hydric state in stressing conditions?
- Will the early defoliation of grapevine allow to protect the
vineyard against grape sunburn?
o Are the symptoms of grape sunburn reduced with the early
defoliation of the grapevine on high-temperatures periods?
o Will the early grapevine defoliation increase the berries'
secondary metabolites production to protect them against sunburn?
- Is there a significant difference between the tested
methods? Which solution seems to be the most efficient against grape
sunburn?
- Will berry quality be impacted by kaolin treatments and early
canopy defoliation?
- What effects the implementation of these potential solutions
will have on the current vineyard management strategy?
The mission of this report will be to prove the efficacity of
two different methods to potentially reduce grape sunburn. Both methods will be
tested in the vineyard to evaluate their effect on grape sunburn, for the 2022
vintage.
It can be proposed to test both the use of a kaolin-based
solution, as well as the use of early moderate plant defoliation before berry
set on the vineyard to evaluate their impact on sunburn.
24
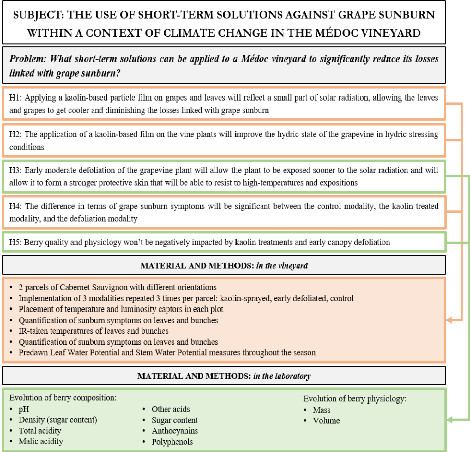
5.2 Hypotheses
Based on the bibliographic review conducted, and on the studied
problems, different hypotheses were formulated:
H1: Applying a kaolin-based particle film on grapes and leaves
will reflect a small part of solar radiation, allowing the leaves and grapes to
get cooler and diminishing the losses linked with grape sunburn.
H2: The application of a kaolin-based film on the vine plants
will improve the hydric state of the grapevine in hydric stressing
conditions.
H3: Early moderate defoliation of the grapevine plant will allow
the plant to be exposed sooner to solar radiation and will allow it to form a
stronger protective skin that will be able to resist to high-temperatures and
expositions.
H4: The difference in terms of grape sunburn symptoms will be
significant between the control modality, the kaolin treated modality, and the
defoliation modality.
H5: Berry quality and physiology won't be negatively impacted by
kaolin treatments and early canopy defoliation.
A study was therefore conducted at the scale of Château
Margaux in order to verify those hypotheses.
25
Figure 5: Scheme of the scientific process to verify
hypotheses
26
PART 2: MATERIAL AND METHODS
1. Study presentation
The study was carried out between March and September 2022 to
evaluate the effect of kaolin and early defoliation on Cabernet Sauvignon at
Château Margaux. The long-term objective will be to find alternative
solutions against grape sunburn on the parcels that can't be replanted at a
favorable orientation.
In order to validate the hypotheses, it will need to be
proven that sunburn can be significantly reduced by short-term solutions such
as early defoliation and kaolin spraying. An experimental set-up was therefore
designed in different parcels, allowing to compare different modalities.
The objective of this set-up is to conduct tests and measures
on grapevine to help Château Margaux to find adapted solutions to their
sunburn problem. Once the measures were conducted, they were analyzed and
compared to validate or eliminate hypotheses.
2. Experimental set-up
For the experimentation to start, different choices had to be
made. Among the decisions, the parcel choice and studied modalities were the
most important, as they can affect the results of the study. The parameters
that affected those decisions will be described in the experimental set-up.
2.1 Vineyard parcel choice
The choice of parcel for this study was made based on
different factors. The row orientation, the grape variety, and the frost damage
were the main variables that were considered for this choice.
2.1.1 The influence of row orientation for our
study
First, to expect some significant results, parcels with a
great intensity of sunburn damage from the previous years were chosen, to make
sure the results wouldn't be altered by the lack of sunburn.
In 2020, studies were conducted at Château Margaux to
evaluate if row orientation had an impact on grape sunburn. As a result, they
found that the best orientation to limit grape sunburn was North-East / South
-West (Porte, 2020). In order to make sure that the plot chosen for the study
would be the worst scenario case, plots with different exposures were chosen,
allowing more grape sunburn.
The first parcel chosen is called «Jean Brun Ouest»
(JBO) and is oriented East / West. It is part of the «Devant le
Château» production block. The second parcel chosen is called
«Les 4 Vents Sables» (L4VS) and is oriented North-West / South-East.
It is part of the «Plateau» production block. A map with every
parcel's orientation is available in Annex 6, and a map with the blocks
is available in Annex 4.
2.1.2 The grape variety studied
Both grapevine parcels produce red grapes from the Cabernet
Sauvignon grape variety. Both parcels are planted with a density of 10 000
plants/ha and are older than 10 years old. Those parcels were chosen for their
soil homogeneity, to avoid biases.
This specific variety was chosen to study because it
represents 52% of the total vineyard and is therefore the most important part
of the grape production at Château Margaux. Two parcels were chosen
rather than one in case differences in grape sunburn symptoms were observed
between orientations.
2.1.3 Frost damage evaluation
In order to make sure that the grape production would be
homogeneous in the plots chosen, a frost damage counting was performed
beforehand. The frosts occurred at the very beginning of April, and the
counting was done during this same month, to evaluate if many fruit-bearing bud
might be
27
affected. To do so, a scale from 1 (<30% of buds dead) to 3
(>75% of buds dead) was established. A few rows in the parcels were then
chosen where a note to each vine plant was given. Finally, the results were
calculated and mapped, so that the company has an idea of which plots were
affected by frost.
Both chosen parcels weren't affected by frost, which is an
additional reason as for why they were chosen.
2.2 Studied modalities and plan
For each parcel of land, three modalities were studied. The
first is the kaolin sprayed modality (K), the second is the early defoliation
modality (ED), and the last one is the control modality (C). To compare
modalities, it was decided to combine them all on one same parcel of land,
instead of allocating one parcel per study. By doing so, it reduced the
uncertainty of the results linked with the homogeneity and type of soil.
To reduce the incertitude linked with the heterogeneity of the
plot of land, each modality was repeated 3 times per parcel. By doing so, there
were a total of 9 blocks in one parcel, and 18 blocks in total (Figure 6
and Figure 7).
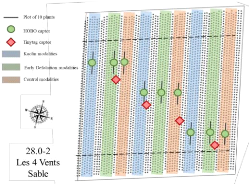
Figure 6: Scheme of the experimental plan of Les 4
Vents Sable, including the repartition of the modalities in the parcel,
the
plots chosen, and the captors location
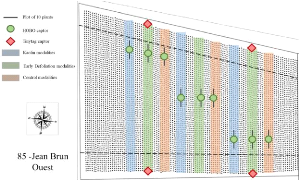
Figure 7: Scheme of the experimental plan of Jean
Brun Ouest, including the repartition of the modalities in the parcel,
the
plots chosen, and the captors location
Inside each block, a plot of 10 selected plants was followed
during the rest of the study. Plots were chosen so that there wasn't any
missing plant around and inside the plot, to avoid false results. For example,
one missing plant just in front of the studied plot would increase its sun
exposure period, and therefore induce error into the results.
2.2.1 The kaolin modality
The kaolin modality received different sprayings during the
season. The spraying solution was prepared with a 20kg/ha dose of kaolin power
(Sokalciarbo by AgriSynergie), water, and adjuvant (Vizir by AgriSynergie) at a
dose of 20mL/100L of water as advised on the notice. The solution was mixed
using a Mixbox mixing tank (Annex 7). The dates of treatment were
defined based on the conditions observed. According to the kaolin powder's
technical data sheet (Agrisynergie, 2022), the sprayings had to be done between
bunch closure and veraison, before any heat wave, and after a leaching above
15mm. The maximum number of sprayings mustn't exceed 4 per year, and the last
spraying had to be done at least 15 days before harvest to avoid residues
(E-Phy, 2022).
The kaolin sprayings were done on the 14th of June,
the 7th of July, the 22nd of July, the 29th of July and
the 9th of August. A calendar is available in Annex 8, and
dose calculations were reported in Annex 9.
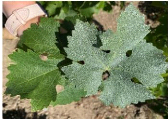
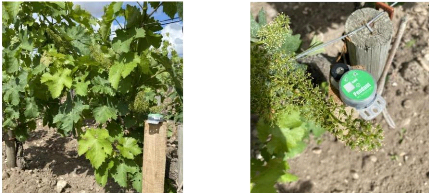
Figure 8: Photograph of Cabernet Sauvignon leaves
before (on le left) and after (on the right) the first kaolin spraying
in
June 2022
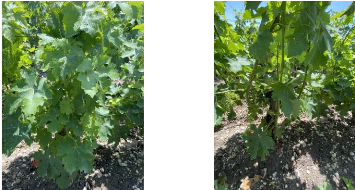
2.2.2 The early defoliation modality
For the early grapevine defoliation, a few leaves were
suppressed on only one side of the canopy, the North-Eastern side, exposed to
sun on mornings. The process was moderate and not drastic, in order to
gradually expose the grapes to the sun (Gaviglio 2022). Mostly the side shoots
of the plant were suppressed, to allow a better sun exposure, without exposing
too much the bunches (Figure 9).
According to bibliography, the defoliation had to be done
right after the flowering period, during the fruit setting stage to obtain
berries with a higher sun resistance (Serrano, 2018). The defoliation was done
in June the 1st for the Jean Brun Ouest parcel, and June the
2nd for Les 4 Vents Sable parcel. Early defoliation was performed
for both experimental parcels when more than 50% of the parcel was at the fruit
setting stage.
28
Figure 9: The same plant, before and after moderate
defoliation in June 2022
29
3. Material and measures
For each studied variable, its definition will be reminded, it
will be linked with one of the hypotheses/problems, the protocol and the
material needed will be presented, and finally the date of data acquisition
will be given.
3.1 Characterization of the 2022 vintage
Vintage characterization is done by analyzing the rainfall as
well as the different types of temperature for a defined period. The
meteorological data will help characterize the 2022 vintage to make sure the
conditions were conducive to sunburn.
Meteorological data were provided by Sencrop weather stations
located in the «Enclos» and «Plateau» blocks (their
location can be found in Annex 4), as well as a global Margaux station.
Values of under-shelter temperatures, humidity, rainfall and wind speed were
collected for the 2022 growing season.
The following meteorological data: minimum temperature,
maximum temperature, average temperature, and rainfall were recorded for each
day to characterize the specific conditions of each parcel. Meteorological data
collected of each parcel defined the climatic conditions along the growing
season.
Based on the collected data, the number of days from March to
the end of August with a maximum temperature higher than 30°C was
calculated, in order to compare it with the previous years. Sunburn usually
happens when temperature is higher than 30°C, so this computation will
give information about previous sunburn events. The objective of this measure
is to verify the hypothesis that the 2022 weather conditions were conductive to
sunburn.
The vegetation zero is the minimum temperature from which a
plant can develop. For grapevine, the vegetation zero is 10°C (Ephytia,
2022), meaning that grapevine usually develops faster when temperatures are
higher than 10°C. The 10°C base temperature sum is therefore an
indicator for grapevine growth over a defined period. Red grape berries are
more sensitive to sunburn when mature, due to their darker color, and lower
radiation reflectance. The objective of this measure is to verify the
hypothesis that the 2022 weather conditions impacted the growth, and therefore
the phenological stages precocity of grapevine, resulting in higher sunburn
sensitivity.
Since grapevine growing season starts in March, along with the
budburst, and ends with harvest, the weather data was only analyzed between
March and August 2022.
3.2 Grapevine physiology
3.2.1 Phenological stages
A plant's phenological stage is characterized by the plant's
development during its life cycle. The phenological study of a plant consists
of observing the date at which those stages appear (Roussey et al., 2021). The
objective of this variable is to define the precocity of both studied parcels,
to evaluate their potential impact on the results.
Phenological stages of reference parcels were evaluated using
a counting method. The most important stage that needed to be followed for our
study is the fruit setting stage when the flowers start to form berries after a
successful fertilization.
For the fruit setting stage, the percentage of bunches for one
reference plant that were set was counted and calculated. Then, at the parcel's
scale, an average was calculated. By repeating this evaluation at different
dates, the exact date of the mid-fruit setting stage was defined, to start
defoliating the grapevines. The exact same calculation method was done for the
other stages.
The results were then compared to previous years, to define the
precocity of the 2022 vintage.
30
3.2.2 Plant vigor
Plant vigor is observed by an increase in plant height and
density through time (Short and Woolfolk, 1956).
This variable reflects the canopy density and is therefore
supposedly negatively correlated with sunburn. This variable was measured to
make sure that they weren't any difference between the 3 studied modalities in
terms of vigor, that could potentially affect the results.
To evaluate the vigor of the grapevine plants, aerial images
were used. The vigor was estimated with an Enhanced Vegetation Index (EVI)
based on the exact measurement of reflected light off the plants at different
wavelengths, using Vineview (Vineview, 2022). The EVI values range from 0 to 1.
Values close to 0 correspond to a bare ground, whereas values close to 1
correspond to a complete vegetation cover (Fraga et al., 2014).
The EVI maps extracted from Vineview dated from May 2022, so
that the data was before any kaolin treatment or defoliation.
3.2.3 Vegetation porosity
Vegetation porosity can be defined as the measure of blank
spaces in the canopy's vegetation, and is the fraction of the blank portion per
the non-blank portion of the canopy (Bélanger, 2017). The higher the
porosity, the higher the sun exposure, and the higher sunburn sensitivity
(Southey and Jooste, 1991). Vegetation porosity is evaluated by measuring the
Leaf Area Index (LAI) for different plants.
The objective of this measure is to control the homogeneity of
the followed plots, to make sure that significant differences aren't observed
between modalities that could affect the results.
To conduct this measure, the height, length and percentage of
blanks in one plant's foliage were evaluated. For each block, this measure was
conducted on 1 plant every 3 plants (3 plants out of the 10 reference plants).
The measures were done in August the 3rd, during the grapevine
maturation process, when it was evaluated that canopy had stopped its
growth.
3.2.4 Grapevine water status
Grapevine hydric condition can be estimated my measuring the
water potential of the vine. There are different types of water potentials.
Both potentials are measured using a Scholander pressure chamber (Annex
10). The grapevine water status of the plant is defined by estimating the
cell capacity to retain water, using the pressure of a neutral gas applied on
the leaf, at different points of the soil-plant-atmosphere system (Ojeda and
Saurin, 2014). The more the plant will be stressed, the more pressure will need
to be applied to extract sap. The pressure needed represents the current hydric
state of the leaf (Dufourcq, 2022; Deloire et al., 2005).
Both measures of water potential will be conducted in order to
answer to the hypothesis that spraying kaolin can positively impact the
grapevine hydric state in stressing conditions.
3.2.4.1 Predawn Leaf Water Potential
Predawn Leaf Water Potential (PLWP) is an estimator to assess
soil water availability for species like grapevine at the scale of a parcel
(Suter et al., 2019).
This measure gives an estimation of the basic hydric condition
of the parcel, to make sure that there are no signs of water stress that could
influence results. It is done predawn (from 2am to 6am) and represents a state
of balance between the vine plant hydric state and the soil hydric condition.
It gives a threshold reference of the current soil water availability for the
plants at the scale of the parcel (Deloire et al., 2005).
31
Only the PLWP for the reference plant of the control
modalities of the parcel (3 reference plants) was measured, so that it gives an
idea of the evolution of the global hydric condition of the parcel.
For this measure, one leaf of each control modality is cut off
the plant, and the petiole is inserted through the lid of the pressure chamber,
its cut end remaining exposed. The chamber is then activated, and the petiole
is examined until liquid is observed on its surface. When there is liquid, the
chamber is turned off and the pressure on the gauge at which water was observed
corresponds to the PLWP.
The PLWP measure was taken at different periods during the
growing season to obtain an evolution of the water availability through the
summer. The PLWP was measured in June the 16th, July the
11th and 13th, and July the 26th.
3.2.4.2 Midday Stem Water Potential
The Midday Stem Water Potential (MSWP) is a measure that
represents the state of water tension during the plant transpiration, under
stressing conditions. This method is usually more precise than the PLWP and is
used to compare the hydric constraints of different modalities (Dufourcq,
2022).
The objective of this measure is to compare it between
modalities, to define whether or not using kaolin helped reducing the hydric
stress of the plant.
This measure is done at the solar noon (around 2pm) after at
least 4 days without rain, so it remains precise. The objective of the stem
water potential is to give an idea of the grapevine hydric condition during the
experimentation period (Dufourcq, 2022).
The chosen leaf is placed in an opaque bag for at least two
hours. Then, the leaf is cut off the plant, and the petiole is inserted through
the lid of the chamber, its cut end remaining exposed. As for the PLWP, the
chamber is then activated, and the petiole is examined until liquid is observed
on its surface. When there is liquid, the chamber is turned off and the
pressure on the gauge at which water was observed corresponds to the stem water
potential.
For this experiment, one reference plant per block for each
modality was defined (9 reference plants per parcel). The MSWP of each
reference plant was measured, in the Scholander pressure chamber.
Like for the PLWP, the MSWP measure was taken at different
periods during the growing season, on June the 13th, July the
12th, and August the 11th.
3.2.4.3 Leaf surface temperature
Leaf surface temperature can be defined as the measure of
grapevine's canopy temperature. This measure was proven to be a good indicator
of water stress.
Stomatal closure is one of the earliest responses to hydric
stress for grapevines. In constant environmental conditions, the leaves'
temperatures should decrease because of stomatal conductance increase. The
higher the leaves' temperatures, the less the vine plant has access to water
(Grant et al., 2016). In normal conditions, grapevine should be able to reduce
its leaves temperature with transpiration through stomatal conductance. When
the hydric stress becomes important, plant transpiration ceases, and the leaves
temperatures rise. Leaves temperature is therefore a good indicator of
grapevine water stress (Jackson et al., 1981).
The objective of this measure is to verify the hypothesis that
kaolin allows the leaves to reduce their temperatures by reducing the stress of
the plant. By comparing the leaf surface temperature between modalities, we can
potentially put into light differences of hydric stress.
Additionally, the temperature of sun-exposed leaves was taken
during different afternoons in the season, at the bunch level. 30 leaves per
modality were randomly chosen (10 leaves per block x 3 blocks) and their
temperatures were measured using a manual infrared thermometer (IM8823,
iMesure).
For the choice of date to measure the temperatures, the
external air temperature should be around 30°C, which is the temperature
around which leaves stop their photosynthesis and rise in temperature as they
cannot continue to perform evapotranspiration. As kaolin reflects light,
studies on grapevine reported that it can reduce the leaves temperature up to
3-8°C (Agrisynergie, 2022), enough for the plant to continue its
photosynthesis.
Temperature was measured when kaolin was still present on the
leaves, and not after a period of rain where it could have been washed-out.
After the first heatwave in June, it rained, washing kaolin off the leaves, not
allowing the measure leaf temperature with kaolin. Consequently, this measure
was conducted after the other kaolin treatments on July the 11th to
the 13th, July the 26th and 28th, and August
the 9th.
3.3 Bunches microclimate
Bunches microclimate was evaluated throughout the season. The
main variables evaluated were the bunch temperature and the received
luminosity.
3.3.1 Temperature of the bunch of grapes
The bunch temperature can be defined as the temperature
measure of the bunch of grapes at a specific moment of time during the growing
season.
Bunch temperature was used in order to verify the hypothesis
that applying a kaolin-based particle film on grapes and leaves will reflect a
small part of solar radiation, allowing the bunches to get cooler. It was also
used to verify the impact of early defoliation on bunch temperature, as no
bibliography clearly stated a significant difference.
The microclimate temperature of the fruit zone was measured on
the 9 plots of each parcel (3 modalities x 3 repetitions). To measure this
temperature, temperature and luminosity captors (HOBO Pendant MX2202, ONSET)
were placed on the afternoon sun-exposed side of the row (Figure 10).
32
Figure 10: Photographs of a HOBO captor position
next to a bunch of grapes
The captors were positioned so that they were in the same
exposure and temperature conditions as the
studied bunch of grapes. The
chosen position of the captors was near bunches of grapes with high
33
sunburn risk. Those bunches are indeed shady in the morning
but exposed on the afternoon. One HOBO captor per block was positioned,
representing 9 captors per parcel.
Additionally, 4 under-shelter temperature and relative
humidity Tinytag captors were positioned on each parcel. They were placed at
different places of the parcel so that they give the mesoclimate of the parcel.
Both captor types were programmed so that the data is captured continuously
during the season, every 15 minutes. Tinytag captors' results were used to
obtain the under-shelter temperature and humidity at a smaller scale than the
weather stations to verify if there were differences at the scale of the
parcels.
Before activating both the HOBO and Tinytag captors on the
parcels, they were calibrated to make sure their data was similar and remove
the ones with odd results.
To verify the bunch temperature difference between modalities,
the temperature of 30 bunches of grapes per modality was taken with the
infrared thermometer (IM-8823, iMesure) at given times. The bunches were chosen
randomly and had to be sun-exposed during the afternoon. The measures took
place during high-temperature days before and during fruit ripening on the
13th to 17th of June, and on the 3rd of August
during maturation, when kaolin was visible on the canopy. Different measures
were done in June to calibrate the bunch temperature model at a more precise
degree, and later measures were done in August to evaluate the bunch
temperature difference after Véraison.
3.3.2 Luminosity of the microclimate
The measure of luminosity can be defined as an estimation of
the received luminosity by the bunches of grapes, a factor that can greatly
influence the apparition of sunburn symptoms.
The objective of this measure is to give an idea of the
received solar radiation for each modality, at the bunch level. This measure
should verify the hypothesis that applying a kaolin-based particle film on
grapes and leaves will reflect a small part of solar radiation, and that
moderate early defoliation will allow sooner and higher sun exposure.
The luminosity data was used to verify those hypotheses, by
comparing acquired luminosity between modalities.
Using the HOBO captors, luminosity received by the canopy was
measured every 15 minutes of every day of the growing season. This data was
used to enrich the bunch temperature calibration model to compare modalities,
in order to find for each modality, the correlation degree between luminosity
and bunch temperature. The objective of this measure is to give a more precise
bunch temperature for each modality, based on the fact that luminosity
influences bunch temperature and sunburn symptoms.
3.4 Quantification of sunburn symptoms
Quantifying grape sunburn will help to evaluate the influence
of both kaolin and early defoliation on the symptoms. The objective of this
measure is to verify if both methods will positively impact sunburn symptoms
apparition.
This measure will have the role to verify the hypothesis that
the difference in terms of grape sunburn symptoms will be significant between
the control modality, the kaolin treated modality, and the defoliation
modality.
In order to quantify sunburn symptoms, counts in the vineyard
were done throughout the season on both bunches and leaves. For each parcel, 10
grapevine reference plants per block (30 per modality) were observed and their
symptoms were evaluated.
34
3.4.1 Bunch counting
Bunch counting is a measure that estimates the number of
bunches one grapevine plant will produce. The objective of this measure is to
evaluate the average number of bunches per grapevine plant, in order to weight
the results, based on the average number of bunches per reference plot.
To do so, for each parcel 5 plots of 10 consecutive plants
were defined in different parts of the parcel, and for each plant the number of
clusters were counted. By doing so, it gives an idea of the average number of
grape bunches per parcel, and therefore an idea of the future yield.
A first count occurred in June the 14th. Thinning
operations took place on both parcels between July the 5th and July the
8th, leading to another count on July the 13th.
3.4.2 Quantification of bunch sunburn
symptoms
As mentioned earlier, grape sunburn can lead to two forms of
symptoms: the first one being the browning of the berries, and the second one
being the withering of the bunch. Bunch sunburn can greatly affect the quality
of the berry, as well as the yield, as it can dry up entire bunches.
The objective of this measure is to verify the influence of
the modalities on the bunch sunburn symptoms, and to define whether or not the
applied methods are working.
To quantify the sunburn symptoms on the bunches of berries,
each affected bunch out of the reference plots were counted and the intensity
of sunburn symptoms in percentage was visually estimated. The frequency was
then calculated by dividing the number of affected bunches by the total number
of bunches. Finally, damages caused by sunburn (Frequency*Intensity) were
estimated, to give an idea of the losses linked with sunburn.
To obtain the total number of bunches per block, the
previously calculated average number of bunches per grapevine plant per parcel
(3.4.1) was used. It was then multiplied by 10 (as there were 10 plants
per block) to obtain the total number of bunches.
The first bunch sunburn symptoms evaluation counts took place
on: June the 22nd and 27th. Other visual counts were
performed later in July the 20th and August the 17th
after two main sunburn episodes. In between, another evaluation was performed
in July the 8th and 11th because thinning was done by
hand on the 5th and 8th of July for JBO and L4VS
respectively.
3.4.3 Quantification of leaves sunburn
symptoms
Although leaf sunburn doesn't have a negative effect on the
berry yield and quality, it is a great indicator of heat stress undergone by
the plant.
Quantifying leaf sunburn will allow us to verify the effects
of both kaolin and early defoliation on the canopy. Under hot and dry
conditions, stomata must close to prevent dehydration (Brodribb and Holbrook,
2003). However, as kaolin should reduce canopy temperature by causing stomatal
opening, it could potentially cause superior leaf dehydration.
In order to quantify the sunburn symptoms on the leaves out of
the 10 reference plants per plot, the number of plants with leaf sunburn were
counted and sunburn intensity was visually estimated. By doing so, it gives an
intensity and frequency evolution during the followed period of time.
The frequency was calculated by dividing the number of
affected plants by the total number of plants per block (10). Just as for the
bunch sunburn evaluation, total damages were calculated by multiplying the
frequency of leaf sunburn by the average intensity of affected plants. The
leaves sunburn symptoms evaluation counts took place on: June the
8th, July the 26th, and August the 17th.
35
3.5 Berries quality evaluation
Berry quality evaluation is a process that will help verify
the hypothesis that berry quality won't be negatively impacted by kaolin
treatments and early canopy defoliation. Quality evaluation will be based on
different criteria such as: the berries mass and volume, and the measure of
primary and secondary metabolites per modality.
3.5.1 Berries mass and volume
Berries mass represents the weight of the berries while their
volume can be defined as the space they occupy.
Because kaolin and early defoliation can significantly reduce
sunburn symptoms, they can consequently reduce the number of withered berries,
and therefore increase the average berries volume compared to the control
modality. However, the volume difference linked with sunburn often isn't
significative on grapevine, as berries are small (Brillante et al., 2016).
The objective of this measure is to verify the hypothesis that
berry physiology won't be negatively impacted by kaolin treatments and early
canopy defoliation.
To evaluate the mass and volume of the berries, the berries
that were picked for primary and secondary analysis were used. They were
weighted to obtain an approximation of the mass of 100 berries per modality.
The average berry volume was precisely calculated using a
Dyostem (by Oenosens). Berries were inserted in the machine for each modality,
and their volume was precisely measured.
Berries mass and volume were measured from July the
21st to August the 22nd.
3.5.2 Primary and secondary metabolites
Grape quality is determined by the contents of the primary and
secondary metabolites (Pavlouek and Kumta, 2011).
The objective of evaluating the berries metabolites between
modalities is therefore to verify the hypothesis that berry quality won't be
negatively impacted by kaolin treatments and early canopy defoliation.
To do so, primary and secondary metabolites have been measured
and studied during the maturation phase of the berries, to make sure no
significant differences could be observed between modalities.
3.5.2.1 Primary metabolites
Primary metabolites come from the primary metabolism that
regroups synthesis paths necessary to growth and plant development. Grape
primary metabolites involve sugars and organic acids (Chaabani, 2019; Pavlouek
and Kumta, 2011).
The objective of comparing primary metabolites levels between
modalities is to verify that both treatments won't affect wine quality.
The total acidity of a berry should reduce as it is maturing,
while the sugars and pH should increase, as a response to the ripening process.
Consequently, the higher the sugar and pH levels, and the lower the acidity
levels, the more mature the berry.
To evaluate the primary metabolites per modality throughout
the season, tests were run on berries samples. Samples of 200 to 300 berries
per modality were collected in plastic freezer bags. Berries were randomly
picked on both sides of the canopy, at 4 levels of the bunches.
36
The samples were then taken to Château Margaux's
laboratory where analyses were conducted. The berries were pressed to extract
their juice. The pH and density were measured using an automatic titrator.
Total and malic acidity were measured using a sequential titrator. Malic
acidity measure has a major consequence on the final produced wine acidity. If
the measures of malic acidities are significantly different modalities, it will
affect the final produced wine.
The sugar concentration in the berries was followed by modality,
using the juice density measure.
From July the 21st to August the 22nd,
analyses were conducted on the berries once a week to follow their evolution
until they reach full maturity.
3.5.2.2 Secondary metabolites
Secondary metabolites come from the secondary metabolism that
regroups synthesis paths that aren't necessarily linked with plant growth.
Grape secondary metabolites involve phenolic compounds and aromatic substances
(Chaabani, 2019; Pavlouek and Kumta, 2011).
As seen earlier in this report (4.2.4), grapevine defoliation
is supposed to increase the berry's production of polyphenols and anthocyanins
due to a higher sun exposure and protect the berry from sunburn symptoms. To
make sure that the berries of the early defoliation modality have a stronger
protective skin than the other berries from different modalities, they were
analyzed. Measuring the accumulation of polyphenols and anthocyanins in the
berries will also give information on potential maturity differences between
modalities during the season.
At the same maturity level, the higher the polyphenols and
anthocyanins level, the thicker the berry skin.
To evaluate the primary metabolites per modality throughout
the season, tests were run on berries samples. Samples of 200 berries per
modality were collected in plastic freezer bags. Berries were randomly picked
on both sides of the canopy, at 4 levels of the bunches.
The samples were then taken to an external laboratory (Excell)
where analyses were conducted. The berries were crushed and centrifuged to
analyze their juice using spectrophotometry. For both the anthocyanins and the
phenolic compounds, the concentration in the berry was measured, and indexes
were calculated. As a result, total anthocyanins, Folin-Ciocalteu
index6, and total polyphenols / total polyphenols index levels were
given.
Analyses were conducted on August the 3rd and the
10th, to make sure berries were ripe enough.
3.6 Managerial and organizational
implications
When trying to implement new solutions into the current
organization, it is important to take into account the managerial and
organizational implications linked with these new practices.
The objective of measuring managerial and organizational
implications is to answer the following problem: what effects the
implementation of these potential solutions will have on the current vineyard
management strategy?
To evaluate the managerial implications linked with the
implementation of such preventive solutions against grape sunburn, an interview
of the vineyard manager of the company was conducted to understand how it will
affect the vineyard's activity.
6 Measure of optic density based on phenolic
compounds oxidation. Reflects the total level of phenolic compounds in
berries.
37
To evaluate the impact of climate change on the production
management and on the wine typicity, an interview was conducted with the
vineyard manager of Château Margaux.
The interview was completed on July the 19th, and its
content transcribed in Annex 2.
4. Statistical data processing of the results
For the characterization of the 2022 vintage, different graphs
and tables were produced. To analyze the weather stations data, a graph was
modelized representing for each weather station the maximum, minimum, and
average temperatures, and rainfall evolution throughout the growing season. To
compare the last growing seasons to our results, a table was done to compare
the number of days with a maximum temperature higher than 30°C for the
last 5 growing seasons. A 10°C base temperature sum was also calculated
for the last 5 growing seasons to see when the plant's development was at is
highest and lowest, and reported in a graph for comparison. To calculate the
10°C base temperature sum, the average temperatures of each day of the
studied period above 10°C were added.
The phenological stages dates results were reported in a table
for each parcel, and their results were compared to one another.
To evaluate the plant vigor of out three studied modalities,
the EVI values were extracted from the studied plots in Vineview and an average
EVI value was calculated for each modality out of their three repetitions. The
values were then reported in a table. Then, a one-way ANOVA analysis was
conducted using XLSTAT to determine if there are any significant differences
between the modalities (XLSTAT, 2022a). If plots were noticed as significantly
different from the others in terms of vigor, they were removed from the other
results.
For the porosity measure, once the measurements were taken,
the Leaf Area Index (LAI) was calculated
using the following formula:
LAI (in m2/soil m2) = (2*H + L) *
(1 - B) / S
With:
- H: height (in m)
- L: length (in m)
- B: blank space percentage (in %)
- S: row spacing (in m) (Prezman 2022)
The LAI results per modality were reported in a table and a
one-way ANOVA analysis was conducted using XLSTAT, to highlight any possible
significant differences between modalities (XLSTAT, 2022a). The means resulting
from the ANOVA were compared using the LSD function of the Fisher Test on
XLSTAT, at a trust level of 0,95.
Both types of water potential measures (PLWP and MSWP) were
reported in histogram graphs. Bounds between different hydric intensity values
were also implemented into the graph, based on data provided by a study on vine
water status (Leeuwen et al., 2009). Differences between MSWP values for each
modality were evaluated with a LSD Fisher test at a trust level of 0,95 by
conducting an ANOVA, in order to define if values are significantly different
between modalities, at different periods of the season.
The leaf temperature data was measured then entered into
databases. A one-way ANOVA was then conducted on these measures using a LSD
Fisher test at a trust level of 0,95 between the three modalities for each
parcel, using XLSTAT, to highlight any significant differences in leaf
temperature (XLSTAT, 2022a).
Before implementing HOBO and Tinytag captors into the
vineyard, they were calibrated. The calibration consisted in leaving the
captors in the same conditions for a few hours, and comparing their results,
in
38
order to make sure that they were homogeneous. The results
were modelized in a graph using Excel where we plot the temperature, light and
humidity data depending on the time.
The Tinytag captors' data was exported, and the results were
plotted using an Excel graph for each parcel. Captors were compared to one
another to verify potential intra-parcel temperature differences. The
comparison dates chosen (between June the 17th and the
19th) correspond to the first heatwave event in June, to make sure
that captors data do not differ with high temperatures.
The IR manually taken temperatures between modalities were not
only used for the bunch temperature model, but also for punctual comparison
between modalities, during hot sunny days. The results were reported in a graph
where measured bunch temperatures were compared between modalities for each
studied parcel. A one-way ANOVA was also conducted on those results, using
XLSTAT, to verify if the bunch temperature was significantly different between
modalities (XLSTAT, 2022a).
To acquire the bunch temperature for the studied period of
time, the IR manually taken temperatures needed to be compared to the HOBO
light and temperature data at given days and hours to produce a database. In
the database, data was analyzed by modality and parcel at different stages of
the growing season.
Based on the HOBO and IR temperature and light data, multiple
linear regression analysis for each modality (6 in total: 3 modalities * 2
parcels) were done using XLSTAT to give the degree of influence of each
variable on the bunch temperature (XLSTAT, 2022b). By doing so, XLSTAT gave us
correlations between data in order to produce an equation for the bunch
temperature. Before using the formula produced, the p-values were checked to
make sure they were significant. Once the IR bunch temperature equations were
obtained, they were used to produce a bunch temperature calibration model to
apply to the HOBO data. The modelized bunch temperatures between modalities
were then compared to define if there were significant differences justifying
the use of kaolin or canopy defoliation. Those bunch temperatures were compared
using a graph in Excel, and the control modality was used as a reference.
The bunch luminosity data was used for the bunch temperature
calibration model where it was implemented into the multiple linear regression
analysis as a variable.
Bunch counting data was used to be implemented into the
calculation of sunburn symptoms frequency and damages on both bunches and
leaves. The frequency was calculated by dividing the number of bunches with
sunburn in the reference plot by the total number of bunches in the reference
plot (calculated by multiplying the average number of bunches per plant by the
number of plants by reference plot). The number of bunches was also reported in
a table.
The quantification of bunch and leaf sunburn symptoms were
processed the same way. Graphs were produced in order to compare the evolution
of sunburn frequency, intensity and damages between modalities throughout the
season. One-way ANOVAs were also done using XLSTAT and LSD Fisher tests at a
trust level of 0,95 were done to verify the damage significance between
modalities, to be able to conclude if both methods were actually efficient
(XLSTAT, 2022a). The results were reported in tables.
Primary and secondary metabolites, as well as mass and volume
data were used to produce graphs using pivot tables in Excel, where the
evolution of all measures were plotted throughout maturation. To evaluate the
sugar concentration in the berries, a table was used to convert the measured
juice density value in sugar level (g/L) (Schaeffer 2018).
39
The interview conducted for the managerial and organizational
implication part was used to report information about the consequences of
implementing new solutions in the vineyard practices.
For each LSD Fisher test conducted using an ANOVA in XLSTAT,
two groups with no letter in common are considered as statistically different
(p-value < 0,001). The values reported in tables in the results regroup the
average, the error margin, and the group letter.
40
PART 3: RESULTS
After the study was set up, it started along with essential
measures for each parameter. The objective of this part is to remind the
studied data for every parameter, present the measured indicators, compare the
data to references, and finally interpret the data to answer our problems and
validate our hypotheses.
1. 2022 vintage characterization during the wine growing
season
Vintage characterization is an essential factor that will help
define the conditions of the study and their influence on its results. The 2022
vintage will be characterized based on its weather conditions as well as on the
dates of its phenological stages.
1.1 Weather conditions of the 2022 season
To characterize the 2022 vintage weather conditions, two
graphs were produced with data from the two weather stations near the studied
parcels. Because the data from both weather databases are very similar due to
the geographical proximity of both parcels, only the data from the Enclos
weather station will be presented on Figure 11, while the data from the
Plateau station will be available in Annex 11.
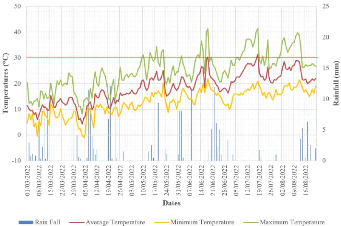
Figure 11: Evolution of the maximum, minimum and
average temperatures as well as the rainfall for the 2022 growing
season,
from March the 1st until August the 22nd, based on the
Enclos weather station data.
Based on Figure 11, the 2022 wine growing season in
Margaux can be characterized by important rainfall episodes between March and
April with low temperatures. The season also faced a frost episode in April
between the 3rd and the 5th. Those episodes didn't
prosper during the season, and temperatures rose until they reached heat waves
mid-June, mid-July, and mid-August. Overall, the 2022 growing season can be
characterized as rainy until May, then hot and dry from June to September. The
maximum reached temperature was 41,4°C on July the 18th.
From 30°C (red line on Figure 11), the sunburn
risk increases (3.1). According to the Margaux weather station database, there
were 34 days during the 2022 wine growing season where the temperatures were
higher than 30°C and the sunburn risk was growing. Consequently, the 2022
growing season can be characterized as favorable to sunburn development, making
this study more significant.
41
In order to compare the risk of sunburn linked with
temperature peaks, the last 5 growing seasons were compared, and the number of
days that reached a maximum temperature higher than 30°C were reported in
Table 2, according to the Margaux local Sencrop weather station.
Table 2: Comparison of the number of days where the
maximum temperature (Tmax) was higher than 30°C, for the last 5
growing
season, from March the 1st to August the 22th, according
to the Margaux Sencrop weather station data
|
Vintage
|
2018
|
2019
|
2020
|
2021
|
2022
|
|
Number of days where Tmax > 30°C
|
25
|
20
|
22
|
12
|
34
|
More days above 30°C were observed in 2022 than in the
last 5 years. In 2021, the number of days with a maximum temperature above
30°C were lower than the other years, resulting in less sunburn. This
could lead to think that the 2022 growing season was more affected by grape
sunburn.
To compare and evaluate grapevine's plant growth over the 2022
growing season, the 10°C base temperature sum was calculated for the last
5 growing seasons in Figure 12.
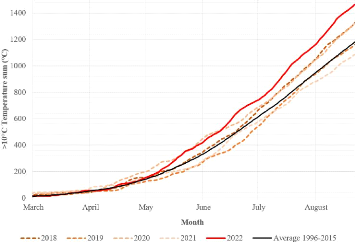
Figure 12: Comparison of the 10°C base
temperature sum for the last 5 growing seasons, from March the 1st to August
the
22th, based on the Margaux Sencrop weather station data
Based on Figure 12, the 10°C base temperature sum
seems to be higher during the 2022 growing season compared to the other
seasons. It is higher than the average temperature sum between 1996 and 2015.
The 2021 and 2019 seasons seem to be lower in terms of temperature sum than the
other years.
Thus, the phenological stages of the 2022 growing season could
have been shifted resulting in a higher berry sunburn sensitivity.
Overall, the 2022 growing season in Margaux can be
characterized by important heatwaves causing intense plant growth. This season
was hotter than the last 5 seasons, and the 10°C base temperature was
higher than the other seasons. All the results show that the 2022 vintage
meteorological data were conducive to grape sunburn.
42
1.2 Phenological stages of the 2022 season
The dates of the key phenological stages for the two studied
parcels were reported in Table 3. The dates of those stages for the last
4 growing seasons for both parcels were reported in Annex 12.
Table 3: Dates of key phenological stages for the
study
|
Key phenological stages
|
|
Mid-bud burst
|
Mid-flowering
|
Mid-ripening
|
|
Parcel
|
Les 4 Vents Sables
|
April, the 9th
|
May, the 22nd
|
July, the 31st
|
|
Jean Brun Ouest
|
April, the 11th
|
May, the 24th
|
July, the 31st
|
Based on the Annex 12, the mid-bud burst dates were
tardive as temperatures remained low during April and March, but the
mid-flowering date was early due to high temperatures in May. A frost-freeze
event occurred in April, but no late frost event was observed. The mid-ripening
dates were also early, due to the high 10°C temperature sum, compared to
the other years. As the mid-ripening stage was shifted, the berries started to
change color earlier, and were therefore more sensitive to solar radiation,
affecting their sunburn sensitivity.
Globally, both parcels' phenological stages were close to one
another. The parcels can therefore be compared without their phenological
stages affecting the results.
2. Homogeneity verification between
modalities
2.1 Plant vigor homogeneity
The EVI maps from Vineview (Annex 13 and Annex
14) show that the Jean Brun Ouest parcel is more vigorous than Les 4 Vents
Sable. They also show that there are zones inside the parcels where the vigor
isn't homogeneous with the rest. For example, in Jean Brun Ouest, the East part
of the parcel is vigorous whereas the West part isn't.
The left of Les 4 Vents Sable parcel is an important
non-vigorous zone. To make sure that our observations remain homogeneous, plots
with higher EVI values were chosen, apart from this zone, so that it doesn't
affect the study. To verify that the EVI differences between modalities were
minor, a Fisher Test at a trust level of 0.95 was conducted using the LSD
function. The results of this test were reported in Table 4 and Table
5.
Table 4: Results of the LSD Fisher Test on Enhanced
Vegetation Indexes (EVI) of the different modalities in the JBO parcel
Kaolin 0.455 #177; 0.012 A
Early Defoliation 0.478 #177; 0.012 A
Control 0.455 #177; 0.012 A
Table 5: Results of the LSD Fisher Test on Enhanced
Vegetation Indexes (EVI) of the different modalities in the L4VS parcel
Kaolin 0.397 #177; 0.010 A
Early Defoliation 0.393 #177; 0.010 A
Control 0.415 #177; 0.010 A
Based on the averaged EVI data per modality and on the Fisher
Test results, the differences of EVI between modalities aren't significant (all
modalities were classified in the same group).
43
Consequently, there are no significant differences in plant vigor
between modalities that could potentially affect the results. Plant vigor is
therefore homogeneous in the studied plots and won't impact the results of
sunburn symptoms.
2.2 Vegetation porosity homogeneity
To make sure that the different modalities were studied in
similar conditions, the canopy porosity values calculated from the photographs
taken were reported in Table 6 and Table 7.
Table 6: Results of the LSD Fisher Test on Leaf Area
Indexes (LAI) of the different modalities in the JBO parcel
Kaolin 1.661 #177; 0.113 A
Early Defoliation 1.614 #177; 0.113 A
Control 1.579 #177; 0.113 A
Table 7: Results of the LSD Fisher Test on Leaf Area
Indexes (LAI) of the different modalities in the L4VS parcel
Kaolin 1.786 #177; 0.146 A
Early Defoliation 1.683 #177; 0.146 A
Control 1.878 #177; 0.146 A
Based on the results from the Fisher test, there aren't any
significant differences between the average vegetation porosities on both
parcels (all modalities were classified in the same group).
Consequently, it can be concluded that all the modalities
inside both parcels are on average equally exposed to sun. Porosity won't
affect the results on sunburn symptoms between modalities.
3. Plant hydric state evaluation
To determine the hydric state of the grapevine plants, two
types of indicators were used to evaluate the potential impact of kaolin
spraying and vine defoliation: water potentials, and leaf temperature.
3.1 Stem and Predawn Leaf Water Potentials
To start with, the Predawn Leaf Water Potential measure was
evaluated throughout the season, and the values were reported in Figure
13.
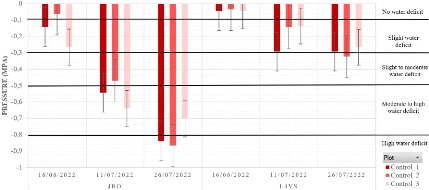
Figure 13: Evolution of predawn leaf water potential
for both studied parcels
44
Because of the weather conditions of the 2022 vintage, the hydric
constraint grew at the scale of the parcel from June to August. The JBO parcel
has on average a higher water deficit than the L4VS parcel.
Both parcels were in stressing conditions by the end of the
growing season. Consequently, it can be concluded that there were signs of
water stress during the season, that could potentially influence the
results.
Then, the Stem Water Potential was evaluated throughout the
season as well, and the values were reported in Figure 14.
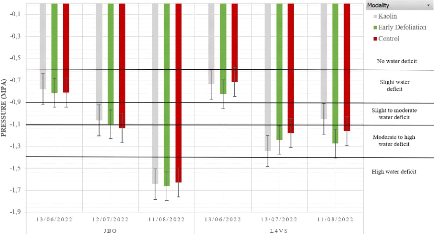
Figure 14: Evolution of stem water potential for
both studied parcels
For every modality on both parcels, the water constraint was
initially low and became moderate to high later in the season.
By comparing this variable between modalities, it shows that for
both parcels the water constraint is on average lower for the kaolin modality,
in stressing conditions. To verify this hypothesis, an LSD Fisher test was
conducted, and its results were reported in Table 8 and Table
9.
Table 8: Results of the LSD Fisher Test on August
the 11th Stem Water Potentials (SWP) of the different modalities in the
JBO parcel
Kaolin -1.645 #177; 0.066 A
Early Defoliation -1.663 #177; 0.066 A
Control -1.630 #177; 0.066 A
Table 9: Results of the LSD Fisher Test on August
the 11th Stem Water Potentials (SWP) of the different modalities in
the
L4VS parcel
Kaolin -1.052 #177; 0.045 A
Early Defoliation -1.276 #177; 0.045 B
Control -1.163 #177; 0.045 AB
Based on the Fisher test results, the kaolin modality is
significantly less stressed than the early defoliation modality for the L4VS
parcel. However, based on the PLWP results, the JBO parcel was more stressed
than the L4VS parcel, making it harder for kaolin to improve water use.
Consequently, it can be concluded that both water potential
measures validated the hypothesis that spraying kaolin can slightly improve the
grapevine hydric state up to a certain degree of stressing conditions.
3.1 Leaf temperature
The leaf temperature data was taken with an IR thermometer for
each modality and the results were reported in Figure 15.
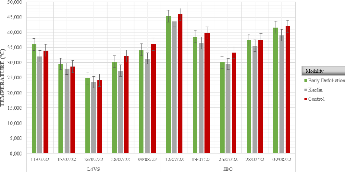
45
Figure 15: Leaf temperature per modality for both
parcels, taken with an infrared thermometer, between July the 11th and
August the 9th
Figure 15 shows slight differences in leaf temperature
between modalities. It can be observed that the kaolin modality is on average
cooler by 2 to 3°C than the other modalities. However, based on the
uncertainty bars on Figure 15, the temperature differences do not seem
to be significant.
In order to verify this hypothesis, an ANOVA was conducted
using an LSD Fisher test, and its results were reported in Table 10 and
Table 11.
Table 10: Results of the LSD Fisher test on leaf
temperature of the different modalities in the JBO parcel
|
Date
|
Kaolin
|
Early Defoliation
|
Control
|
|
July the 11th
|
43.62 #177; 0.54 B
|
45.35 #177; 0.54 A
|
45.91 #177; 0.54 A
|
|
July the 13th
|
36.50 #177; 0.75 B
|
38.53 #177; 0.75 AB
|
39.80 #177; 0.75 A
|
|
July the 26th
|
29.47 #177; 0.83 B
|
30.12 #177; 0.83 B
|
33.31 #177; 0.83 A
|
|
July the 28th
|
35.57 #177; 0.57 B
|
37.38 #177; 0.57 A
|
37.42 #177; 0.57 A
|
|
August the 9th
|
31.33 #177; 0.76 B
|
34.27 #177; 0.76 A
|
36.09 #177; 0.76 A
|
Table 11: Results of the LSD Fisher test on leaf
temperature of the different modalities in the L4VS parcel
|
Date
|
Kaolin
|
Early Defoliation
|
Control
|
|
July the 11th
|
32.12 #177; 0.71 B
|
36.03 #177; 0.71 A
|
33.97 #177; 0.71 B
|
|
July the 13th
|
27.90 #177; 0.55 B
|
29.51 #177; 0.55 A
|
28.66 #177; 0.55 AB
|
|
July the 26th
|
23.54 #177; 0.49 A
|
24.87 #177; 0.49 A
|
24.18 #177; 0.49 A
|
|
July the 28th
|
27.33 #177; 0.75 B
|
30.25 #177; 0.75 A
|
32.14 #177; 0.75 A
|
|
August the 9th
|
39.03 #177; 0.51 B
|
41.61 #177; 0.51 A
|
41.93 #177; 0.51 A
|
46
Based on the ANOVA results, leaf temperature measurements
showed a significative difference between modalities based on their group
classification. Overall, it can be observed that the kaolin modality is
significantly lower in leaf temperatures than the two other modalities for most
measurements. Significative differences in terms of leaf temperature between
the early defoliation and the control modalities were rarer, and both
modalities were considered close.
Consequently, this does prove that kaolin reduces
significantly leaf temperature, and validates the hypothesis that kaolin allows
the leaves to slightly reduce their temperatures by reducing the stress of the
plant, even by just a few degrees.
4. Fruit zone microclimate
As seen earlier in this report (4.2.3), kaolin-spraying
can influence bunches temperature, due to a higher reflection of the radiation.
To verify if kaolin significantly reduces the bunch temperature, bunch
temperature was measured during the growing season to conduct statistical
comparisons between modalities. Moreover, those measures helped calibrate a
bunch temperature model for the growing season.
4.1 Reduce error risks by calibrating the
captors
In order to diminish the risks of error, the captors chosen to
be placed in the plots were calibrated to make sure they wouldn't produce wrong
values. The IR thermometer, the HOBO captors, and the Tinytag captors were all
calibrated to reduce risks of errors.
4.1.1 Infrared thermometer calibration
To reduce the risks of error of berry and leaf temperature
between modalities, all the measures were conducted with the same thermometer.
For one given parcel, only one person was in charge to take all the
measurements, to avoid the uncertainty linked to the observer.
Consequently, the measures done with the IR thermometer were
precise.
4.1.2 HOBO captors' calibration
Before implementing HOBO captors in the reference plots to
acquire data, they were calibrated. Two additional captors were ordered in case
some weren't working. The results of the temperature and light data were
reported in Figure 16 and Figure 17.
Figure 16: Comparison of temperature data between 20
potential usable HOBO captors, on the 2nd and 3rd of
June
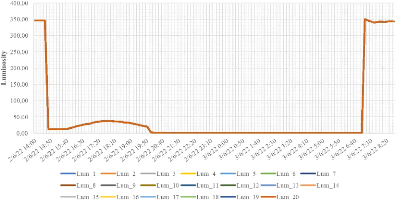
47
Figure 17: Comparison of light data between 20
potential usable HOBO captors, on the 2nd and 3rd of June
Based on those graphs, results are overlaid, and the maximum
difference in temperature between captors was 0.002°C, and 0.01 for the
luminosity data. No captor showed values significantly different than the
others, so the captors needed for the reference plots were randomly chosen.
Consequently, all differences between values under 0.002°C
and 0.01 luminosity will not be considered as significant for
interpretation.
4.1.3 TinyTag captors' calibration
Before starting the study, there were 10 TinyTags but the study
only needed 8. This calibration helped to determine which ones were going to be
used and which ones weren't.
The temperature and humidity data were plotted on Figure
18 and Figure 19 using an Excel pivot chart.
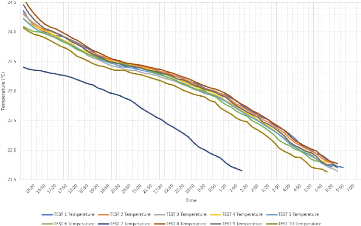
Figure 18: Comparison of temperature data between 10
potential usable TinyTag captors, on the 23rd and 24th of
May
48
Figure 19: Comparison of relative humidity data
between 10 potential usable TinyTag captors, on the 23rd and
24th of May
Based on the results, the values of the TinyTag number 7 were too
different from the rest of the captors. Captor number 7 was therefore not
included in the study.
When comparing all the other values, excluding captor number 7, a
maximum difference of 0,458°C and 4,553%RH was observed between captors.
Captor number 10 was also excluded, whose temperature values were slightly
under the rest of the lot.
Therefore, all differences between values under 0,458°C and
4,553%RH will not be considered as significant for interpretation.
4.2 Climate of the parcels
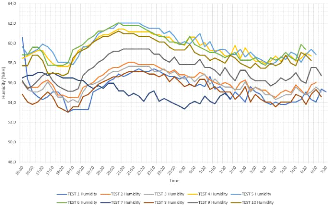
The parcels under-shelter temperature and humidity were measured
using Tinytag captors at different positions. As both parcels results were
similar, only the results from JBO were reported in Figure 20, and the
rest of the results are available in Annex 15.
Figure 20: Tinytag captors temperature and humidity
results on the JBO parcel between July the 17th and the 19th
Based on Figure 20, no significant differences were
observed between captors in terms of temperature and humidity at the scale of
the parcels.
Consequently, this verifies the hypothesis that the
under-shelter temperature and humidity values are homogeneous and couldn't have
affected the measured temperature differences between modalities.
4.3 Sun-exposed bunches of grapes punctual temperatures
comparison
The bunch temperature was punctually manually measured for
each modality at different moments of the growing season. The infrared measured
temperatures were compared at one precise moment for the three modalities
during warm and sun-exposed days, and the results were reported in Figure
21.
49
Figure 21: Comparison of average bunch temperature
per modality at different times of the day, on the sun-exposed side of
the
canopy, taken by an infrared manual thermometer, between June the
13th and August the 3rd
At the beginning of the measures, a slight difference in
temperatures was observed between modalities. During the berries ripening, the
same tendency was observed, but the differences stayed minimal.
The defoliation of the grapevine reduces its porosity.
Consequently, the early defoliation modality should have higher bunch
temperatures than the other modalities, because of the higher sun exposure.
Based on the graph, the bunch temperatures differences do not seem
significantly different between modalities.
In order to verify this hypothesis, the significance of the
values was evaluated by conducting an ANOVA using the LSD Fisher test method.
The results of the Fisher test can be found in Table 12 and Table
13.
Table 12: Results of the LSD Fisher test on bunch
temperature of the different modalities in the JBO parcel
|
Date
|
Kaolin
|
Early Defoliation
|
Control
|
|
June the 13th
|
27.75
|
#177; 0.31 A
|
26.83
|
#177; 0.31 B
|
27.71
|
#177; 0.31 A
|
|
June the 15th
|
36.70
|
#177; 0.34 A
|
36.07
|
#177; 0.34 A
|
36.70
|
#177; 0.34 A
|
|
June the 16th
|
22.12
|
#177; 0.24 A
|
22.01
|
#177; 0.24 A
|
22.43
|
#177; 0.24 A
|
|
June the 17th
|
30.06
|
#177; 0.35 A
|
30.30
|
#177; 0.35 A
|
30.64
|
#177; 0.35 A
|
|
August the 8th
|
39.36
|
#177; 0.34 B
|
41.35
|
#177; 0.34 A
|
40.68
|
#177; 0.34 A
|
Table 13: Results of the LSD Fisher test on bunch
temperature of the different modalities in the L4VS parcel
|
Date
|
Kaolin
|
Early Defoliation
|
Control
|
|
June the 13th
|
29.78 #177; 0.31 A
|
28.71 #177; 0.31 B
|
28.92 #177; 0.31 AB
|
|
June the 15th
|
32.4 #177; 0.39 B
|
34.05 #177; 0.39 A
|
34.24 #177; 0.39 A
|
|
June the 16th
|
20.63 #177; 0.11 A
|
20.85 #177; 0.11 A
|
20.83 #177; 0.11 A
|
|
June the 17th
|
25.78 #177; 0.26 A
|
25.80 #177; 0.26 A
|
25.66 #177; 0.26 A
|
|
August the 8th
|
34.63 #177; 0.44 B
|
35.99 #177; 0.44 A
|
35.67 #177; 0.44 A
|
The results show that the punctual bunch temperature measures
weren't always significantly different between modalities as they were often
classified in the same group. There aren't enough measures where the kaolin
modality was significantly lower in bunch temperature than the other modalities
to conclude that kaolin reduces significantly bunch temperature. When the
measures are significantly different, the differences are very low (1 to
2°C).
Consequently, it doesn't verify the hypothesis that applying a
kaolin-based particle film on grapes will reduce bunch temperature, due to the
lack of measures. The result might have been significant if measures were done
continuously for one day. To verify this hypothesis, the bunch temperature
model measured temperatures all day long.
4.4 Bunch temperature model
To obtain the precise bunch temperature model for each
modality, the model was first calibrated, then applied to data during heatwave
events in the season.
4.4.1 Bunch temperature calibration
To produce a bunch temperature simulation, the bunch
temperatures weren't measured during nighttime, and only the daytime
temperatures differences will be taken into account. The model is based on the
pre-véraison bunch temperatures.
To model the average bunch temperature for each modality at
different moments of the day, the followed equation was synthetized by
XLSTAT:
TBunches = Constant + CTemp_Hobo*Temp_Hobo +
CLight_Hobo*Light_Hobo
With:
TBunches: Modelized temperature of the
bunches
Constant: Value given in the model's
parameters
CTemp_HOBO: Coefficient Temp_HOBO given in the
model's parameters CLight_HOBO: Coefficient Light_HOBO given
in the model's parameters Temp_HOBO: Temperature of the bunch
microclimate recorded by the HOBO captor Light_HOBO: Light of
the bunch microclimate recorded by the HOBO captor
For every of the 6 produced models, the HOBO temperature and
light variables of the bunch microclimate were considered in the model as being
significative.
Figure 22 represents the result of the bunch
temperature model for the control modality of the L4VS parcel. The other
results of the significant linear regressions can be found in Annex 16
to Annex 20.
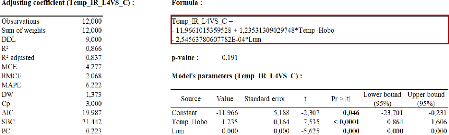
50
Figure 22: Multiple linear regression model from
XLSTAT between the IR thermometer bunch temperature and the HOBO
captor
recorded light and temperature data for the control modality in the Les 4 Vents
Sable parcel
51
4.4.2 Bunch temperature model application
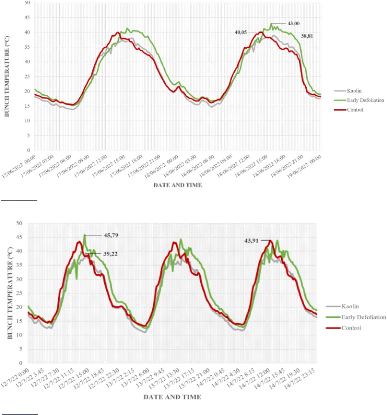
Figure 23: Evolution of bunch temperature on the JBO
parcel between the 17th and the 19th of June 2022
Figure 24: Evolution of bunch temperature on the JBO
parcel between the 12th and the 15th of July 2022
The bunch temperature models for each modality were applied to
different periods during the 2022 summer where temperatures were high, and
sunburn happened. The results for three heatwaves were graphically represented
on Figure 23, Figure 24 and Figure 25. The results on both
parcels were similar, so only the JBO parcel results will be analyzed in this
part, and the L4VS results can be found in Annex 21.
52
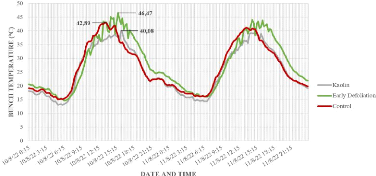
Figure 25: Evolution of bunch temperature on the JBO
parcel between the 10th and the 12th of August 2022
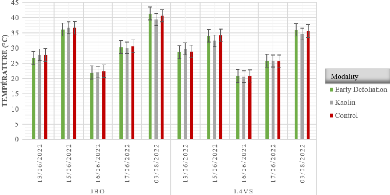
For the JBO parcel, the followed bunches of grapes were
exposed on the South part of the canopy and reached a temperature peak between
2 and 4 PM. During the first heat wave (Figure 23), the bunches reached
a maximum of 38,8°C for the kaolin modality, 43°C for the early
defoliation modality, and 40°C for the control modality.
During the second heatwave (Figure 24), the bunches
reached a maximum of 39,2°C for the kaolin modality, 45,8°C for the
early defoliation modality, and 43,9°C for the control modality.
Lastly, during the August heatwave (Figure 24), the
bunches reached a maximum of 40,08°C for the kaolin modality, 46,47°C
for the early defoliation modality, and 42,89°C for the control
modality.
Nevertheless, when comparing where the temperatures reached a
plateau, it can be observed that the early defoliation modality and the control
modality values are very similar, and only the kaolin modality is significantly
cooler.
Overall, the differences between modalities were similar
before and during véraison. The bunch temperature difference between the
highest temperature of the control and the kaolin modalities is 1,2°C for
the June heatwave, 4,7°C for the July heatwave, and 2,81°C for the
August heatwave.
Those results verify the hypothesis that applying a
kaolin-based particle film on grapes and leaves will reflect a small part of
solar radiation, allowing the grapes to get cooler.
5. Sunburn symptoms evaluation
Sunburn symptoms were evaluated on both bunches of grapes and
leaves. The measure of bunch sunburn symptoms will verify the influence of the
modalities on berry sunburn, and therefore will help to define whether those
methods can save grape yield and quality or not. Additionally, the leaf sunburn
measure is an indicator of the sunburn pressure as well as the hydric state of
the plant.
The evaluation of sunburn symptoms was done visually during the
season.
5.1 Bunch counting
Due to grape thinning operations in July, two counts occurred.
The results were reported in Table 14.
Table 14: Evolution of the bunch number per parcel
before and after thinning operations
|
Parcel
|
14th June 2022
|
13th July 2022
|
|
JBO
|
10,66 bunches/plant
|
5,44 bunches/plant
|
|
L4VS
|
8.74 bunches/plant
|
5,26 bunches/plant
|
Based on the results, the final number of bunches per plant
was reduced to obtain similar values. Consequently, the number of bunches per
plant isn't significantly different between modalities.
Those results were used in the calculation of bunch sunburn
frequency (5.2).
5.2 Bunch sunburn symptoms evaluation
The first evaluation of bunch sunburn symptoms took place in
June, after a high-temperature week where the ambient temperature went up until
42°C. Other visual counts were performed after each high-temperature
episode. The frequency as well as the intensity of bunch sunburn were
represented for both parcels for each modality in Figure 26.

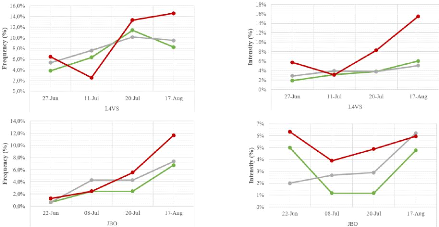
53
Figure 26: Evolution of bunch sunburn frequency and
intensity on JBO and L4VS, from June the 22nd to August the
17th
On Figure 26, the bunch sunburn symptoms seem to have
decreased mid-July. This is due to thinning operations that took place on July
the 5th on JBO and the 8th on L4VS. A lot of bunches
affected with sunburn were removed, explaining the differences between the
first and the second measure.
The frequency as well as the intensity of bunch sunburn rose
for all the modalities of JBO and L4VS from the 8th and
11th of July until the 17th of August. The control, early
defoliation and kaolin modalities frequencies respectively rose by 12%, 1,9%,
and 1,9% for JBO and 9,2%, 4,3%, and 3,1% for L4VS during this period.
From these measures, it could be concluded that overall, the
kaolin and the early defoliation modalities had a noticeable effect on reducing
bunch sunburn frequency.
In order to evaluate the losses linked with sunburn for each
modality, the bunch damages (frequency*intensity) were calculated and
represented on Figure 27.
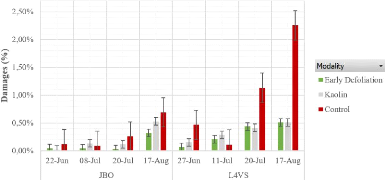
54
Figure 27: Evolution of damages linked with sunburn
on bunches per modality, from June the 22nd to August the
17th
According to Figure 27, yield loss (damage) estimation
due to grape sunburn seemed to be significantly reduced by kaolin spraying and
by early plant defoliation by the end of the season. By August the
17th, losses due to sunburn were estimated to 0,69% on JBO and 2,25%
on L4VS for the control modality, 0,52% on JBO and 0,51% on L4VS for the
kaolin-sprayed modality, and 0,31% on JBO and 0,51% on L4VS for the defoliated
modality.
As seen on Figure 27, the results are more significant
on the L4VS parcel due to higher intensity and frequency. Only the L4VS parcel
will therefore be analyzed.
On L4VS on the 27th of June, early defoliation
seemed to have reduced sunburn symptoms by 85%, while kaolin reduced symptoms
by 67%. If the 11th of July results are taken as a base zero due to
thinning operations, new damages on the 20th of July are evaluated
to: 0,22%, 0,12% and 1,02% for respectively early defoliation, kaolin and
control modalities. On the 20th of July, early defoliation therefore
reduced damages by 78%, while kaolin reduced them by 88%.
With the 11th of July results as a base zero,
damages on the 17th of August are evaluated to: 0,3%, 0,22% and
2,14% for respectively early defoliation, kaolin and control modalities. On the
17th of August, early defoliation reduced damages by 86%, while
kaolin reduced them by 90%.
An ANOVA was conducted between modalities, to make sure that
the damage differences were significant. The results were reported in Table
15 and Table 16.
Table 15: Results of the LSD Fisher test on berry
sunburn damages of the different modalities in the JBO parcel
|
Date
|
Kaolin
|
Early Defoliation
|
Control
|
|
June the 22nd
|
0 #177; 0.001 A
|
0 #177; 0.001 A
|
0.001 #177; 0.001 A
|
|
July the 8th
|
0.001 #177; 0.001 A
|
0 #177; 0.001 A
|
0.001 #177; 0.001 A
|
|
July the 20th
|
0.001 #177; 0.000 AB
|
0 #177; 0.000 B
|
0.003 #177; 0.00 A
|
|
August the 17th
|
0.005 #177; 0.002 A
|
0.003 #177; 0.002 A
|
0.007 #177; 0.002 A
|
Table 16: Results of the LSD Fisher test on berry
sunburn damages of the different modalities in the L4VS parcel
|
Date
|
Kaolin
|
Early Defoliation
|
Control
|
|
June the 27th
|
0.002
|
#177; 0.002 A
|
0.001
|
#177; 0.002 A
|
0.005
|
#177; 0.002 A
|
|
July the 11th
|
0.003
|
#177; 0.001 A
|
0.002
|
#177; 0.001 A
|
0.001
|
#177; 0.001 A
|
|
July the 20th
|
0.004
|
#177; 0.002 B
|
0.004
|
#177; 0.002 B
|
0.011
|
#177; 0.002 A
|
|
August the 17th
|
0.005
|
#177; 0.004 B
|
0.005
|
#177; 0.004 B
|
0.023
|
#177; 0.004 A
|
55
While a significant difference can be observed between the
control modality and the others (they were classified in different groups),
both the Kaolin and early defoliation modalities weren't classified as
significantly different.
Consequently, this verifies the hypothesis that kaolin as well
as early defoliation both have a positive impact on grape sunburn.
5.3 Leaf sunburn symptoms evaluation
After each heatwave of the growing season, evaluations of leaf
sunburn damages was performed additionally to the bunch sunburn evaluation. The
evaluations took place between July the 8th and August the
17th. The frequency as well as the intensity of leaf sunburn were
represented for both parcels for each modality in Figure 28.
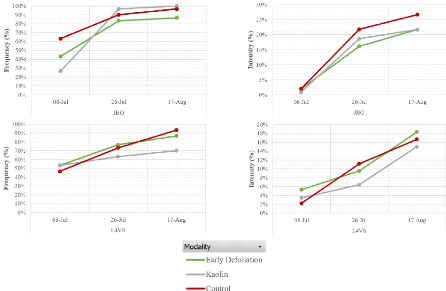
Figure 28: Evolution of leaf sunburn frequency and
intensity on JBO and L4VS, from June the 22nd to August the Xth
On Figure 28, the leaf sunburn symptoms seem to have
globally increased between July and August. The frequency as well as the
intensity of leaf sunburn rose up for all the modalities of JBO and L4VS from
the 8th and 11th of July until the 17th of
August.
Overall, all the modalities seemed to all have been subject to
intense leaf sunburn due to the high-temperatures and low rainfall episodes.
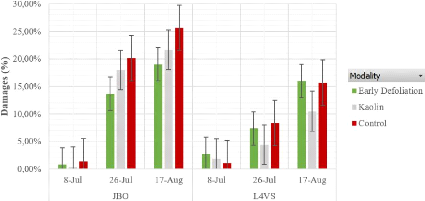
56
Figure 29: Evolution of damages linked with sunburn
on leaves per modality, from June the 22nd to August the
17th
According to Figure 29, leaf damage estimation due to
grape sunburn doesn't seem to be significantly different between modalities,
even if small differences can be observed between modalities. By the end of the
season, leaf sunburn damages were estimated to 26% on JBO and 16% on L4VS for
the control modality, 22% on JBO and 10,5% on L4VS for the kaolin-sprayed
modality, and 19% on JBO and 16% on L4VS for the defoliated modality.
An ANOVA was conducted between modalities, to verify if the
damage differences on leaves were significant. The results were reported in
Table 17 and Table 18.
Table 17: Results of the LSD Fisher test on leaf
sunburn damages of the different modalities in the JBO parcel
|
Date
|
|
Kaolin
|
Early Defoliation
|
Control
|
|
July the 8th
|
0.004
|
#177; 0.004 A
|
0.008
|
#177; 0.004 A
|
0.014
|
#177; 0.004 A
|
|
July the 26th
|
0.180
|
#177; 0.042 A
|
0.137
|
#177; 0.042 A
|
0.201
|
#177; 0.042 A
|
|
August the 17th
|
0.217
|
#177; 0.032 A
|
0.190
|
#177; 0.032 A
|
0.257
|
#177; 0.032 A
|
Table 18: Results of the LSD Fisher test on leaf
sunburn damages of the different modalities in the L4VS parcel
|
Date
|
|
Kaolin
|
Early Defoliation
|
Control
|
|
July the 8th
|
0.035
|
#177; 0.008 AB
|
0.053
|
#177; 0.008 A
|
0.023
|
#177; 0.008 B
|
|
July the 26th
|
0.044
|
#177; 0.016 A
|
0.074
|
#177; 0.016 A
|
0.083
|
#177; 0.016 A
|
|
August the 17th
|
0.105
|
#177; 0.019 A
|
0.160
|
#177; 0.019 A
|
0.157
|
#177; 0.019 A
|
According to the ANOVA, no significant difference (they were
all classified in the same group) can be observed between the three modalities.
Therefore, leaf sunburn symptoms were overall the same for each modality.
Consequently, kaolin and early defoliation do not have a
significant impact on leaf sunburn symptoms. And while kaolin reduces leaf
temperature and berry sunburn, it does not significantly cause higher leaf
dehydration.
As a result to both measures, even if all the modalities faced
different bunch sunburn damages, their leaf sunburn symptoms were similar. This
can be interpretated the fact that in the same stressful environment where
sunburn should thrive, the kaolin and early defoliation modalities are
efficient to protect the berries.
6. Physico-chemical analysis of modalities
6.1 Mass and volume of 100 berries
For each modality, the mass and volume of 100 berries were
measured from Véraison, to evaluate any potential difference. The
results from both parcels being similar, only L4VS results were reported in
Figure 30. The JBO results are available in Annex 22.

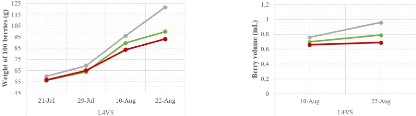
Figure 30: Evolution of mass and volume of 100
berries between July the 21st and August the 22nd, for the L4VS parcel
Based on Figure 30, the berries' size and volume seem
to be different between modalities by the end of the season. The peak of volume
hasn't been reached yet, as berry maturity usually stops later in September.
Indeed, the kaolin modality seems to present bigger berry
sizes and volumes. Theoretically, the use of kaolin should lower the berries
temperature during hot days, reducing the berries transpiration resulting in a
berry volume rise of 7%, as it has been studied on Sauvignon Blanc and Merlot
(Coniberti et al., 2013; Shellie and Glenn, 2008).
Consequently, the mass and volume measures verify the
hypothesis that berry physiology wasn't negatively impacted by kaolin
treatments and early canopy defoliation. On the contrary, kaolin treatments
significantly increased the berries' size and volume.
6.2 Primary and secondary metabolites
Primary and secondary metabolites were measured during the
berry maturation on both studied parcels for each modality. The results of
those measures and analyses were reported in graphs. The analysis results from
the external laboratory (Excell) are available in Annex 23Annex 23.
6.2.1 Primary metabolites comparison
As both parcels had similar results in terms primary
metabolites, only L4VS results were analyzed in this part, and results from the
JBO parcel were reported in Annex 24.
57

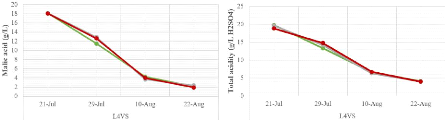
58
Figure 31: Analysis results of berry maturity per
modality, between July the 21st and August the 22nd, for the L4VS
parcel
As it can be observed on Figure 31, by the 22nd
of August, the modalities levels of pH, sugar, malic acid, and total acidity
are similar.
On the 29th of July, it can be observed that the early
defoliation modality seemed more advanced by the others, due to its higher
values in pH, and lower acidity. However, no significant difference can be
observed by the end of the maturation process.
Consequently, this verifies the hypothesis that kaolin sprayings
and early defoliation do not impact berry maturity, and therefore wine
quality.
6.2.2 Secondary metabolites comparison
The total phenolic compounds were evaluated using the Folin
Index. The polyphenols and anthocyanins levels were measured and the TPI was
calculated. The results were reported in Figure 32.
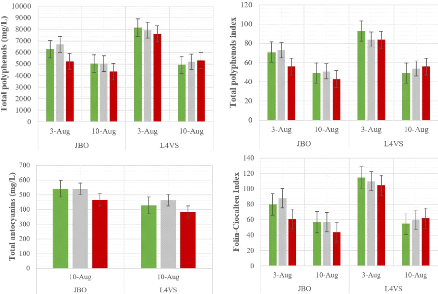

59
Figure 32: External laboratory analysis results of
anthocyanins and phenolic compounds per modality, between August the
3rd and the 10th
According to the results, neither the total phenolic compounds
nor the total anthocyanin concentration significantly differ between kaolin and
control modalities, meaning that kaolin spraying did not have a significant
effect on both compounds. However, early defoliation levels seem slightly
higher than other modalities for both metabolites, but the difference isn't
significant.
Globally, it can be concluded that the measured
physico-chemical characteristics on the different modalities weren't
significantly influenced by neither the kaolin spraying, nor the early
defoliation of the canopy. Consequently, both potential solutions against grape
sunburn won't affect the quality of the harvested berries, and therefore the
quality of the produced wines.
However, it has been observed that early defoliation increases
polyphenol and anthocyanins production in berry skin, validating the hypothesis
that exposing plants to solar radiation sooner helps forming a stronger
protective skin that will be able to resist sunburn, without affecting grape
quality.
60
7. Managerial implications linked with grape sunburn
adaptation
Assumed from the results of this study, grape sunburn
adaptation comes with important management changes and implications. Including
sunburn preventive solutions into the vineyard work calendar represent
additional workload that needs to be managed. For example, implementing kaolin
sprayings and early defoliation imply to free some time, and reduce time
allocated with other types of tasks.
Thanks to the interview conducted with the vineyard manager
(Annex 2), early defoliation could be included in the existing work
calendar, if it is done early and at the good phenological stage, to make sure
that the bunches have enough time to adapt to sun exposure. Kaolin sprayings
could also be managed if it is proven that it doesn't affect the organoleptic
parameters of the wines. However, both solutions will necessitate additional
work as they cannot be merged with other existing tasks. For example, kaolin
powder cannot be implemented inside their regular vineyard treatments they
already conduct, as it might affect the application process.
In terms of expertise, processes, and workforce, the limits
that Château Margaux will face to implement those solutions are:
workforce availability, machinery availability, weather conditions, and
workload conducted at the same time.
In terms of managerial adaptation, this means that the company
will be most likely to hire supplementary working force to complete this
job.
Overall, both solutions will induce management changes, will
come with challenges, and will be time and cost-bearing.
61
PART 4: DISCUSSION AND PROPOSITIONS
1. Reminder of the objectives of the study
The objective of this study was to find short term solutions
against grape sunburn for the Médoc vineyard. Two solutions were
evaluated at the scale of Château Margaux's vineyard in 2022: kaolin
sprayings and early defoliation.
Globally, the results were significative and proved that both
solutions could work to prevent grape sunburn symptoms, reducing yield and
quality losses.
However, some elements impacted the study such as the weather
conditions of the vintage, the homogeneity of the studied plots, some
uncertainties linked with measures taken, etc.
In this part, the results will be discussed, and propositions
will be formulated in order to improve the future of the study on grape
sunburn.
2. Results and hypotheses
The objective of this part is to remind the hypotheses of the
study, and verify their validity, based on the results obtained.
H1 (Applying a kaolin-based particle film on grapes and
leaves will reflect a small part of solar radiation, allowing the leaves and
grapes to get cooler and diminishing the losses linked with grape sunburn) was
validated based on the results of leaf temperature and bunch sunburn symptoms
evaluation.
Based on the stem water potential results, H2 (The
application of a kaolin-based film on the vine plants will improve the hydric
state of the grapevine in hydric stressing conditions) was also validated,
showing that kaolin improved the hydric state of the grapevine in stressing
conditions, up to a certain limit.
H3 (Early moderate defoliation of the grapevine plant will
allow the plant to be exposed sooner to solar radiation and will allow it to
form a stronger protective skin that will be able to resist to
high-temperatures and expositions) was partially verified, as the berries from
the early defoliation modality were indeed less affected by sunburn, but no
significant differences were observed based on the primary and secondary
metabolites.
As the grape sunburn symptoms results on bunches were
significantly different between the control and the two studied modalities, it
validated H4 (The difference in terms of grape sunburn symptoms will be
significant between the control modality, the kaolin treated modality, and the
defoliation modality).
The results of the primary and secondary metabolites analysis
conducted on berries weren't significantly different between modalities,
confirmed H5 (Berry quality and physiology won't be negatively impacted by
kaolin treatments and early canopy defoliation). However, kaolin sprayings
helped improve berry physiology by increasing its mass and volume.
All things considered, the study was significant, and most
hypotheses were validated. However, some results can be discussed.
3. Discussion on the results
The study took place during the 2022 growing season. The
conditions, results, as well as the limits of the study were reminded in order
to conclude on the efficiency of the studied potential solutions against grape
sunburn.
62
3.1 Conditions of the study
Regarding the conditions of the study, weather conditions as
well as the parcels homogeneity were two main factors that have impacted the
results, and that differ between vintages.
3.1.1 The influence of the weather conditions
Weather conditions can greatly influence this study. For
example, this study was already conducted in 2021 with three modalities:
control, kaolin spraying on bunches and leaves, and kaolin spraying on bunches
only. However, the 2021 weather conditions weren't keen to sunburn development,
as it rained a lot, and there wasn't any heatwave.
Consequently, it was harder to decipher a significant
difference between modalities, as they weren't much affected by sunburn, and it
was harder to define a good date to apply kaolin on the canopy. It is however
important to conduct this study on different types of weather conditions, so
that it can be adapted and improved.
The results found in this study on weather conditions confirm
the bibliography results linking higher sunburn intensity with higher light and
temperature conditions (Schrader et al., 2009; Gambetta et al., 2021;
Araújo et al., 2018). It also confirms the link between temperatures
higher than 30°C and sunburn (Pastore et al., 2013), based on the results
from the last 5 growing seasons.
Rain can also greatly affect this study on the kaolin
modality, as the kaolin clay can be washed away by rain.
High temperatures such as the ones faced during the 2022
growing season were perfect for this study, as they surely caused sunburn on
both parcels. However, the season was dry, and caused water deficit,
intensifying the sunburn symptoms, even on the kaolin and early defoliation
modalities, as it was found in bibliography (Cook et al., 1964; Gambetta et
al., 2021). Additionally, a climate like the 2022 vintage reflects the
potential climatic conditions the Médoc vineyard will face in the future
due to climate change.
For the 2022 study, as the rain episodes were rare between
June and August, the kaolin sprayings lasted for long periods of days.
Visually, both the leaves and bunches were covered by kaolin on both sides of
the canopy, and the defoliation allowed the bunches to be significantly more
sun exposed than the control modality.
3.1.2 The homogeneity of the studied parcels
The results of porosity and EVI clearly show that the
modalities were homogeneous in terms of plant physiology, reducing
uncertainties limiting biases.
The EVI values between modalities weren't significantly
different, which reflects a global homogeneity in terms of plant vigor for both
studied parcels.
However, those results do not consider the zones of the
parcels where the vigor was low, and only considered the studied plants. It can
therefore be imagined that significantly different EVI values could have been
observed if the studied plots were chosen differently.
No link between vigor and sunburn were found, as opposed to
what was found in other studies (Smart, 1985), due to the homogeneity of the
studied plots.
Regarding the vegetation porosity values, the Leaf Area
Indexes (LAI) between modalities weren't significantly different either. The
studied plots were consequently equally exposed to sun, limiting biases linked
with sun exposure, as it was found in bibliography results (Southey and Jooste,
1991).
It can be said that homogeneity between modalities was hence
controlled based on the porosity and EVI values, limiting biases linked with
plant growth.
63
3.2 Results of the study
Overall, the results of the study were conclusive and showed
that both kaolin sprayings and early defoliations had an impact on grape
sunburn. Both solutions being however different, they affected grapevine
physiology as well as berries quality differently.
3.2.1 Sunburn solutions and their impact on grapevine
physiology
In this part, the effects of both studied solutions against
grape sunburn on grapevine physiology will be discussed. More precisely, their
consequences on the plants' hydric state and sunburn symptoms will be
resumed.
3.2.1.1 Plant hydric state and leaves
temperature
Based on the measures of both water potentials and leaves
temperature, the kaolin sprayings have significantly improved grapevine hydric
state, by reducing its temperature. The results found confirm the bibliography
results, showing that kaolin can diminish hydric stress (Glenn and Puterka,
2010; Glenn et al., 2010). Kaolin sprayings can therefore be considered as a
good solution against grapevine hydric stress. However, early defoliation only
seemed to have increased water stress, by increasing canopy porosity due to
removed leaves.
In this study, kaolin reduced leaf temperature between 2 and
3°C on average, which is low, as the bibliography results predicted a 3 to
8°C reduction (Agrisynergie, 2022).
Consequently, it can be concluded that kaolin was the best
modality out of the two studied solutions to reduce water stress and improve
grapevine physiology.
3.2.1.2 Bunch temperature and sunburn
The bunch temperature results showed significantly differences
between modalities, contrarily to leaf temperature. However, when the bunch
temperature model was applied to high temperatures episodes, differences in
temperature peaks were observed between modalities. The kaolin modality was the
coolest, while the early defoliation modality was the hottest.
As grape sunburn is mostly a result of high solar radiation
and temperatures, it could have been expected that the early defoliation
modality had more sunburn symptoms. However, based on the sunburn evaluation
results, the control modality was significantly more affected than the two
other modalities. The results helped validate the hypothesis that both kaolin
and early defoliation can reduce grape sunburn symptoms on bunches by acting
differently on grapevine physiology.
3.2.2 Kaolin and early defoliation effects on sunburn
symptoms
According to studies, kaolin sprayings should increase light
reflectance and reduce the plant's sensitivity to sunburn (Yazici and Kaynak,
2009; Lobos et al., 2015). On the other hand, early defoliation should increase
sunlight exposure, resulting in higher skin thickness and lower sunburn
sensitivity (Pastore et al., 2013; Solovchenko, 2010).
The results found in this study confirm both hypotheses, as
damages linked with sunburn were significantly reduced by both kaolin sprayings
and early defoliation.
3.2.3 Effect of studied modalities on berry
quality
In order to verify the potential impact of the modalities on
berry quality, some analyses were conducted, and results were analyzed.
Based on the results, kaolin sprayings had a positive effect
on grapevine physiology. Indeed, kaolin increased berry size and volume
compared to other modalities.
The early defoliation modality, due to a higher and sooner
berry sun exposure, presented a slightly higher anthocyanin and polyphenols
concentration than the other modalities. However, the difference between
modalities being unsignificant, other factors might have helped reduce sunburn
sensitivity for this
64
modality. For example, the aeration of the canopy linked with
defoliation could have potentially helped reduce bunch temperature and
therefore sunburn.
When looking at other primary and secondary metabolites, no
significant difference can be observed between the three modalities. It can
therefore be imagined that based on those results, neither kaolin nor early
defoliation have negatively impacted berry quality. However, no conclusion can
be taken on the final wine quality, as other parameters are to be taken into
account, such as unmeasurable compounds and berry taste, that can only be
evaluated by conducting tastings.
As a conclusion on the study results, it can be said that both
methods worked differently on grapevine physiology but were both efficient on
grape sunburn. While kaolin proved to improve the plant's hydric condition and
reduce bunch temperature, early defoliation built up the berries' tolerance to
sun exposure.
3.3 Technical limits of the study
Both studied solutions at the scale of the vineyard can
present some technical challenges linked with their application.
3.3.1 Technical limits linked with kaolin
sprayings
Kaolin sprayings are made using a kaolin clay powder mixed
with water and adjuvant. When preparing the mix, the solution had lumps that
were hard to incorporate. Homogeneity was reached eventually after adding
kaolin powder gradually, to avoid lump formation. To incorporate the powder
into the solution, it had to be mixed longer. Consequently, the adjuvant caused
the appearance of bubbles. For a prepared volume of 200 liters, an estimated
additional volume of 150 liters of bubbles was formed, reducing the part of the
product that could have been used. The bubbles formation also made it harder to
see the level when filling the sprayer tank.
The sprayer nozzles weren't clogged by the solution, as kaolin
was rarely used. However, when applied at the vineyard scale, there is a risk
that the nozzles get clogged due to the thick and abrasive property of the mix.
This can cause a technical problem as the solution could be to change the
nozzle size between regular and kaolin treatments, being time consuming.
3.3.2 Technical limits linked with early
defoliation
Regarding early defoliation, no specific technical problem was
observed. However, it is important to define the degree of defoliation to be
reached, or it can result in drastic bunch exposure leading to more sunburn
symptoms. The defoliation needs to be moderate to only increase the exposure
enough to strengthen the berries. Defoliation also needs to be done at a
specific phenological stage to ensure higher sun exposure for newly formed
berries. If defoliation is completed too late in the season, it can result in
sudden berry sun exposure, leading to higher sunburn symptoms.
Another technical limit linked with early defoliation is the
row orientation of the parcel. As the vineyard is composed by differently
oriented parcels, it makes it harder to define the defoliation intensity for
each parcel.
There is also an uncertainty linked with the worker, leading to
more or less leaves left on plants.
3.3.3 Other technical limits
Picking berries for quality evaluation was done by different
samplers, resulting in a possible bias in results. A solution to reduce this
bias could be to only assign one person to sample the integrity of the
modalities. However, this solution is time consuming, especially at the scale
of two parcels, making it almost impossible to implement.
To limit this bias as much as possible, the company is
implementing a specific picking protocol, so that gaps between samplers are
minimized.
|
|
|
|
|
|
Costs linked with kaolin
sprayings
|
|
|
Dose kaolin (kg/ha)
|
80
|
|
Price of kaolin per kilo (€/kg)
|
1,6
|
|
Price of kaolin per hectare (€/ha)
|
128
|
|
Spraying time for 0,3 ha (h/0,3)
|
|
|
Cost of sprayer driver per hour (€/h)
|
|
Cost of kaolin per hectare (€/ha)
|
|
|
|
|
Profits linked with kaolin
sprayings
|
|
|
Number of plants per hectare (ha)
|
10000
|
|
Number of bunches per grapevine plant
|
5,35
|
|
Average weight of a Cabernet Sauvignon bunch (kg)
|
0,15
|
|
Estimated yield (kg/ha)
|
8025
|
|
Damage difference between control and kaolin (%)
|
0,20%
|
|
Yield gain (kg/ha)
|
16,05
|
|
Berry mass per bottle of wine (kg/0,75L wine)
|
1
|
|
Berry mass per litter of wine (kg/L)
|
1,33
|
|
|
|
|
|
|
|
|
|
|
|
|
|
Profits linked with early
defoliation
|
|
|
Number of plants per hectare (ha)
|
10000
|
|
Number of bunches per grapevine plant
|
5,35
|
|
Average weight of a Cabernet Sauvignon bunch (kg)
|
0,15
|
|
Estimated yield (kg/ha)
|
8025
|
|
Damage difference between control and defoliation
(%)
|
0,40%
|
|
Yield gain (kg/ha)
|
|
|
Berry mass per bottle of wine (kg/0,75L wine)
|
|
|
Berry mass per litter of wine (kg/L)
|
|
60,6
13,41
812,65
32,1 1 1,33 24,14
125 3016,92
2204,27
65
3.4 Managerial limits of the study
In terms of management, the feasibility of both solutions was
evaluated to make sure that it could be implemented at the scale of the
vineyard.
Overall, kaolin sprayings management at the scale of the study
wasn't time consuming. The mix preparation took about 30 minutes for a 200
liters volume. However, if kaolin sprayings are applied at the scale of the
vineyard, they will represent additional work and will be harder to manage. The
first management limit will concern the use of the sprayers, as they are also
used at the scale of the vineyard to perform other tasks such as tillage or
canopy trimming during the growing period. Managing how and when the sprayers
are going to be used might be time consuming but is necessary to ensure the
efficiency of the vineyard work management.
The dose and dates of treatments will also have to be reasoned
based on weather conditions, canopy coverage, and workload. It might also
represent additional work and time to make sure the conditions are optimal to
spray.
Finally, as kaolin must be evenly sprayed on both sides of the
canopy, it requires two sprayer passages, increasing the treatment time by
2.
Regarding early defoliation at the scale of the vineyard, the
work itself do not represent a management problem. However, it will require
hiring seasonal workers to defoliate but will also require the presence of
employees to oversee their work.
Overall, for both kaolin sprayings and early defoliation
methods, time and workload management represent the main limits in terms of
project feasibility.
3.5 Economic evaluation of the project
In order to make sure that using kaolin and early defoliation
methods on the vineyard are worth it in terms of loss reduction, an economic
study was conducted. The objective of this study was to define if the cost of
kaolin and early defoliation would overcome the economic gains linked to
sunburn reduction.
The gains were estimated based on the calculated yield
difference between the control modality and the other two modalities. The yield
gain was then converted in number of produced bottles. As both studied parcels
produce Pavillon Rouge wine, the average price of a bottle was calculated based
on their selling price.
The results of this study can be found in Table 19 and
Table 20, where costs and gains of both methods were reported, based on
the latest damage results on both studied parcels.
Table 19: Estimated economic margin made from both
studied modalities based on the results on the JBO parcel
0,33 1,1 15,3
144,83
12,07
125
1508,46
1363,63
Gained volume (L wine/ha)
Exit price of wine (€/L)
Economic profits (€/ha)
Margin (€/ha)
|
Costs linked with early
defoliation
Gained volume (L wine/ha)
Exit price of wine (€/L)
Economic profits (€/ha)
Margin (€/ha)
|
Table 20: Estimated economic margin made from both
studied modalities based on the results on the L4VS parcel
|
Costs linked with kaolin
sprayings
Spraying time for 0,3 ha (h/0,3)
Profits linked with kaolin
sprayings
Damage difference between control and kaolin (%)
Yield gain (kg/ha)
Margin (€/ha)
|
|
Costs linked with early
defoliation
Profits linked with early
defoliation
Damage difference between control and defoliation
(%)
Yield gain (kg/ha)
Margin (€/ha)
|
|
|
|
|
|
|
|
|
|
|
|
|
|
|
|
|
|
|
|
|
|
|
|
|
|
|
|
|
|
|
|
|
|
|
|
|
|
|
|
|
|
|
|
|
|
|
|
|
|
|
|
|
|
|
|
|
|
|
|
|
|
|
|
|
|
|
|
|
0,33 1,1 15,3
144,83
1,80%
144,45
60,6
13,41
812,65
10000 5,35 0,15 8025
1,80% 144,45 1 1,33
108,61 125 13576,13
12763,48
66
Dose kaolin (kg/ha)
80
Price of kaolin per kilo (€/kg)
1,6
Price of kaolin per hectare (€/ha)
128
Defoliation time per hectare (h/ha)
Workforce price per hour (€/ha)
Cost of early defoliation per hectare (€/ha)
According to both tables, the gains linked with sunburn reduction
overcome the costs of both studied
methods. Early defoliation seems to be more expansive than
kaolin, therefore less profitable for the
company.
Spraying time per hectare (h/ha)
Cost of sprayer driver per hour (€/h)
Cost of kaolin per hectare (€/ha)
Number of plants per hectare (ha)
10000
Number of bunches per grapevine plant
5,35
Average weight of a Cabernet Sauvignon bunch (kg)
0,15
Estimated yield (kg/ha)
8025
Number of plants per hectare (ha)
Number of bunches per grapevine plant
Average weight of a Cabernet Sauvignon bunch (kg)
Estimated yield (kg/ha)
Overall, the results show that both methods are profitable when
applied at a larger scale. Even if the
damages results on the JBO parcel weren't significant, kaolin
sprayings still manage to help gain
approximately 1 363€ per hectare.
However, those results can highly vary based on the vintage
weather conditions. Indeed, if the damage
difference between modalities is lower, it could potentially
induce economic losses. Moreover, due to
some parcels' orientation, both methods might not work at the
scale of the entire vineyard.
Berry mass per bottle of wine (kg/0,75L wine)
1
Berry mass per litter of wine (kg/L)
1,33
Gained volume (L wine/ha)
108,61
Exit price of wine (€/L)
125
Economic profits (€/ha)
13576,13
13431,30
Berry mass per bottle of wine (kg/0,75L wine)
Berry mass per litter of wine (kg/L)
Gained volume (L wine/ha)
Exit price of wine (€/L)
Economic profits (€/ha)
Consequently, those results need to be pondered as they highly
depend on row orientation and could
vary based on which parcel is studied, the size of the sprayer
used, and the planting density.
3.6 Limits linked with study size and
duration
This study highlighted the effects on sunburn symptoms of two
short-term solutions. However,
due to the limited duration of the study, it hasn't been possible
to define the impacts of both kaolin and
early defoliation on the wine's quality and organoleptic
profile.
In order to have been more precise on the organoleptic
consequences of kaolin and early defoliation on
Château Margaux's wines, it would have necessitated to
continue to conduct this study longer.
If the study had lasted longer, we would have been able to define
whether those solutions can be applied
at a large scale in the vineyard, without affecting the typical
profile of Château Margaux's wines or not.
conduct Berry tastings could also have been implemented to define
the impact of kaolin and defoliation
on berry taste.
However, in continuity to this study, the company will vinify the
modalities separately, so that they will
be able to conduct tastings to compare the effects of the studied
modality on wine organoleptic profile.
Additionally, the study size was limited. The studied plots
represented 30 plants per modality per parcel,
which hardly represents the integrity of the parcels. There is
consequently an additional uncertainty
linked with the plots size.
4. Propositions and study perspective
Based on the study's results and limits, propositions have
been formulated. For each proposition, the objectives, means, costs and risks
have been discussed.
67
4.1 Prolongation of the study
To overcome the study duration limit, it can be advised to
continue the study on the 2022 vintage. The primary and secondary metabolites
analysis will continue until harvest to make sure that no significant
differences are observed.
It can also be advised to harvest and vinify separately the
modalities of each parcel to produce different wines. When they will be ready,
the wines could later be blind tasted and compared to one another to define if
there is a significant organoleptic difference between the three studied
modalities. If there aren't, then it means that both solutions can successfully
be applied to the integrity of the vineyard, without affecting the typicity of
Château Margaux's wines.
The 2022 study wasn't the first conducted on grape sunburn by
Château Margaux but is part of a longterm project to reduce grape sunburn
at the scale of the vineyard. It can therefore be advise to prolongate the
study to the 2023 and 2024 vintages in order to make sure that kaolin and early
defoliation work on different types of climates.
4.2 Improvement of the experimental set-up
To continue and perfect the study on grape sunburn, it can be
advised to reconduct the study for the next growing seasons, by improving the
experimental set-up. The objective of this proposition is to increase the study
precision and improve the knowledge and management capacities linked with
sunburn solutions.
To do so, the study could be applied at a larger scale of the
vineyard, on different grape varieties and parcels orientations. By also
choosing more reference plants per modality to study, it will increase the
representativity of the results at the scale of the vineyard.
Moreover, the intensity of both methods can be modulated, and
trials can be conducted. For example, different defoliation intensities could
be tested as different modalities, based on the parcels' orientations. For
kaolin sprayings, it could be advised to test different concentrations based on
weather conditions. By doing so for a few years, the applied dose can be
modulated so that time management becomes optimal.
The cost of this proposition will be close to this year's
study cost, but the investment return will be larger as it should help at a
long-term scale to significantly reduce/avoid berry sunburn.
The only risk linked with this proposition is the absence of
sunburn linked with bad weather conditions, and therefore the inability to
evaluate the efficiency of the studied methods.
4.3 Extension of the study at the scale of the
vineyard
Based on the positive results of the studied, it can be
proposed to extend the solutions at the scale of the vineyard. While early
defoliation results mainly depend on row orientation, kaolin sprayings can be
easily applied at the scale of the vineyard independently from row
orientation.
The objective of this proposition is to reduce sunburn at the
scale of the vineyard, and reduce economic losses linked with this issue.
To implement this proposition, visual observations will have
to be done to define which parcels need to be treated with kaolin. Based on the
results, a kaolin mix will be prepared and sprayed depending on weather
conditions.
The cost of this proposition will be estimated at 13
614,02€/ha, what kaolin sprayings cost for this study multiplied by the
number of hectares of the vineyard (94ha). Regarding the investment return of
this proposition, it can be estimated as the return obtained with the kaolin
sunburn study multiplied by the number of hectares treated (= at least 13
614,02€/ha).
However, the risk of this proposition is that kaolin sprayings
might not work as well on the integrity of the vineyard as they worked on the
two studied Cabernet Sauvignon parcels. It can be imagined that other grape
varieties are less sensitive to sunburn, and that the investment return will be
less important,
68
if not negative. In order to overcome this risk, it can be
advised to first continue and improve the experimental set-up at a larger scale
before extending it at the scale of the vineyard.
4.4 Technical resources propositions
To overcome technical limits linked with kaolin sprayings and
early defoliation, technical resources propositions have been formulated.
For kaolin sprayings technical limits, filters can be included
in the sprayers to limit the risk of nozzle clogging. Rather than having to
change nozzles before each treatment, implementing filters is less time
consuming, as they can be left for regular treatments too.
Regarding the adjuvant bubbling property, it is linked with
air incorporation during the mixing process. To overcome this issue, it can be
advised to reduce the mixing speed and to incorporate kaolin into the mix
slower and in lower quantities.
To overcome technical problems linked with early defoliation
at the scale of the vineyard, two propositions can be made. The first one being
to conduct a trial on defoliation based on row orientation, in order to link
ideal defoliation intensity with sun exposure. The second proposition is to
provide the correct formation for seasonal workers so that they understand the
degree of defoliation that is supposed to be reached, reducing problems linked
with intense defoliation.
4.5 Managerial propositions
Managing time and workload is essential to continue this study
or apply it at a larger scale. As seen previously (7), kaolin sprayings as well
as early defoliation solutions need to be correctly managed.
Based on the vineyard workload, sprayers and workforce might
not be available to perform kaolin sprayings during the growing season.
Consequently, two solutions exist. Either the vineyard manager can decide to
reduce time allocated with other tasks such as tillage or canopy trimming, and
prioritize kaolin sprayings in the work calendar, either kaolin sprayings can
be performed by external workers. While the first solution seems more
complicated in terms of time management, it is less costly as it doesn't
necessitate to spend additional money by hiring workforce and lending material.
In comparison, there are no direct economical losses linked with tillage and
canopy trimming, even if they are essential to perform, while economical losses
linked with sunburn are significative.
To manage the dose and dates of treatments, different
solutions can be implemented. First, the weather conditions of the season will
need to be followed. If long high-temperature episodes are predicted, a kaolin
treatment must be done in prevention. Then, observations can be performed at
the scale of the vineyard based on weather conditions, to verify if kaolin has
been washed out of the canopy depending on rainfall events. The dose of
treatment will also depend on the weather conditions. If high temperature
periods are predicted before a rain episode, then the dose could be divided by
2, as it is expected to be washed out and renewed after rain. Kaolin treatment
management should therefore be as precise as possible, to ensure higher
protection of the vineyard.
Finally, managing early defoliation will necessitate hiring
and overseeing seasonal workers, representing additional money and work.
However, vineyard employees are usually already busy completing other tasks,
and do not have time to oversee early defoliation. Like for kaolin sprayings,
solutions include reducing time allocated with other tasks to free some time
for defoliating or hire external workers to complete their tasks while they
oversee early defoliation.
4.6 The use of inter-row cover crops against grape
sunburn
To continue the study on grape sunburn, other types of
experiments could be conducted such as evaluating the consequence of different
inter-row cover crops on grape sunburn.
Cover crops can absorb an important part of solar radiation
(Varlet-Grancher et al., 1989). Consequently, when implemented in the
vineyard's inter-rows, it can reduce part of the reflected solar radiation,
diminishing direct reflection on bunches of grapes.
69
To do so, different types of cover crops should be
implementing at the scale of the vineyard, and measures should be conducted in
order to evaluate their reflection degree, and therefore their impact on
sunburn.
In terms of budget, this trial will have costs linked with the
purchase of specific seed mixes, soil preparation and cultivation, as well as
tools used to evaluate reflected radiation. However, if the study significantly
diminishes canopy temperature by finding the ideal inter-row cover crops, the
investment return could be important.
Nevertheless, this solution only works on specific types of
soils. If the soil type is lighter than the cover crop, then it is useful to
implement it, as the nude soil's solar radiation reflection will increase
radiation received by the canopy.
Moreover, this solution has limits. Implementing cover crops
could potentially result in higher competition between the grapevine and the
crops in terms of soil nutrients.
4.7 Evolution of the PDO specifications to face climate
change
Climate change will bring new challenges to wine production.
The 2022 vintage is a good example of this hypothesis, as long heatwave
episodes caused severe drought and grape sunburn, affecting both the yield and
quality of the production.
In order to overcome the future effects of climate change,
institutional changes seem necessary. For instance, the evolution of the
appellations' system to include technical and agronomical innovations is
inevitable to limit losses and quality changes linked with climate change. It
can therefore be imagined that the PDO specifications as well as the national
legislation will evolve to allow for instance shade netting and vineyard
irrigation up to a certain level at the scale of the Médoc vineyard.
Insurance systems for environmental induced losses (such as frost and hail)
could also be implemented to strengthen the vineyards capacity to face climate
change.
However, if the PDO specifications do not evolve in the next
few years, it can be advised that Château Margaux should stop being part
of the PDO and start using alternative methods to limit the consequences of
climate change without affecting their wine typicity. Thanks to their renown,
Château Margaux won't necessarily be affected in terms of sales and
profits by their declassification, due to their already existing notoriety.
70
| 
