|
NATIONAL UNIVERSITY OF RWANDA
Zinc and Chromium removal mechanisms from
industrial
wastewater by water hyacinth, Eichhornia
crassipes (Mart.) Solms-Laubach
John GAKWAVU RUGIGANA
MSc. Thesis in WREM November 2007

National University of Rwanda
Faculty of Applied Sciences
Department of Civil Engineering

In collaboration with

Zinc and Chromium removal mechanisms from
industrial
wastewater by Water hyacinth, Eichhornia
crassipes (Mart.)
Solms-Laubach
Master of Science Thesis
in
WATER RESOURCES AND ENVIRONMENTAL
MANAGEMENT
(W.R.E.M)
by
John R. GAKWAVU
Supervisors
Mr. B. C.
SEKOMO (PhD Research Fellow/ UNESCO-IHE)
I. NHAPI, PhD.
(UNESCO-IHE & National University of Rwanda)
A Thesis submitted in partial fulfilment of requirements of
the Master of Science degree in Water
Resources and Environmental Management
(WREM) at the National University of Rwanda
NUR, November 2007

Statement of originality
I declare that this research report is my own work;
unaided work. It is being submitted for the degree of Master of Science in the
National University of Rwanda. It has not been submitted before for any degree
of examination in any other University.
Gakwavu Rugigana John
Date: November 10th, 2007
Signature:
When wastewaters are not well purified they can seriously
damage surface and
ground water. They can also endanger human and animal
health.
The findings, interpretations and conclusions expressed in
this study do neither necessarily reflect the views of the National University
of Rwanda, Faculty of Applied Sciences nor of the individual members of the MSc
committee, nor of their respective employers.
Table of Contents
Statement of originality iii
Table of Contents v
List of tables viii
List of figures ix
List of symbols and abbreviations x
Dedication xi
Acknowledgements xii
Abstract xiii
1 INTRODUCTION 1
1.1 Background 1
1.2 Problem description 2
1.3 Objectives 3
1.4 Research questions 3
1.5 Hypotheses 4
1.6 Scope of the research 4
1.7 Report outline 4
2 LITERATURE REVIEW 5
2.1 Overview on use of macrophytes in metal removal 5
2.2 Water hyacinth (Eichhornia crassipens (Mart.) Solms. 6
2.2.1 Systematic position 7
2.2.2 Ecological factors 8
2.2.3 Potentials and constraints in using of water hyacinth 8
2.3 Heavy metals 9
2.4 Wastewater 11
2.5 Foliar absorption 12
2.6 Translocation of metals within plants 12
2.7 Uptake 13
Zinc and chromium removal mechanisms from industrial
wastewater by water hyacinth (Eichhornia crassipes) (Mart.)
Solms-
Laubach
3 MATERIALS AND METHODS 15
3.1 Water Hyacinth sampling site description 15
3.2 Methods 16
3.2.1 Description 16
3.2.2 Synthetic wastewater solution preparation 16
3.2.3 Experimental Procedures 16
3.3 Sample Analyses 19
3.3.1 Relative Growth 19
3.3.2 Bioconcentration Factor 19
3.3.3 Metals Accumulation 20
4 RESULTS AND DISCUSSIONS 22
4.1 Variations on plant relative growth 22
4.1.1 Relative growth of water hyacinth plants 22
4.1.2 Discussions on relative growth of water hyacinths 23
4.1.3. Correlation between final fresh weight and relative growth
23
4.2 pH effects and metal concentrations remained in controls
(blanks) 24
4.2.1 pH effects in blank samples 24
4.2.2 Zinc concentrations remaining in blank samples 24
4.2.3 Chromium concentrations remained in blank samples 25
4.2.4 Discussions of pH effects on metal concentrations in blank
samples 26
4.3 pH variations and Zn(II) and Cr(VI) concentrations in water
samples with water
hyacinths 26
4.3.1 Variations of pH on metal removal by the plants 26
4.3.2 Zinc concentrations remaining in water samples after 4
weeks of
experiment. 28
4.3.3 Chromium conc. remaining in water after 4 weeks of
experiment 29
4.3.4 Discussions on pH variations and metal removal by the
plants 29
4.4 Bioconcentration Factor (BCF) for zinc and chromium 30
4.4.1 Bioconcentration Factor for zinc 30
4.4.2 Bioconcentration Factor for chromium 30
Zinc and chromium removal mechanisms from industrial
wastewater by water hyacinth (Eichhornia crassipes) (Mart.)
Solms-
Laubach
4.4.3 Discussions on bioconcentration factor 31
4.5 Bioaccumulation 32
4.5.1 Adsorption of Zinc by water hyacinth plants 32
4.5.2 Total adsorption of zinc 33
4.5.3 Adsorption of chromium by water hyacinth plants 34
4.5.4 Discussions on adsorption mechanism 35
4.6 Uptake mechanism 35
4.6 1 Uptake mechanism for zinc 35
4.6.2 Uptake mechanism for chromium 36
4.6.3 Discussions on uptake mechanism 36
4.7 Translocation Ability (TA) 37
4.7.1 Variation of translocation ability for zinc 37
4.7.2. Variation of translocation ability for chromium 39
4.7.3 Discussions on translocation ability 41
5. CONCLUSIONS AND RECOMMENDATIONS 42
5.1 Conclusions 42
5.2 Recommendations 43
References 44
Appendices 50
Zinc and chromium removal mechanisms from industrial
wastewater by water hyacinth (Eichhornia crassipes) (Mart.)
Solms-
Laubach
List of tables
Table 2.1: Maximum growth response of water hyacinth exposed to
Cd and Zn 12
Table 2.2: Chromium uptake by water hyacinths during a period of
17 days from Keith
et al., 2006 13
Table 2.3: copper uptake by water hyacinth
during a period of 17 days.from Keith et
al., 2006 14
Table 2.4: Arsenic uptake by water hyacinth
during a period of 17 days from Keith et
al., 2006 14
Table 4.1: variations on bioconcentration factor of zinc 31
Table 4.2: variations on bioconcentration factor of chromium
31
Table 4.3: Variability in zinc uptake compared to initial
concentration & exposure time.
37
Table 4.4: variability in uptake of chromium 37
Table 4.5: Translocation ability of chromium by the plant 40
Table 4.6: variations in translocation ability of zinc 41
List of figures
Figure 2.1: Common aquatic plants (source: Aquatics, 2005) 6
Figure 2.2: Morphology of water hyacinth plant (source: Aquatics,
2005) 8
Figure 3.1: Topographic map showing the location
of Nyabugogo swamp and its
influents 15
Figure 3.2: Plan view of experimental set up.
18
Figure 3.3: steps in lab experiment. 18
Figure 4.1: Relative growth of water hyacinth plants vs exposure
time for different Zn
and Cr concentrations 23
Figure 4.2: Correlation between Relative Growth of plants and
Final Fresh Weight 24
Figure 4.3: variations of pH in blank samples 24
Figure 4.4: Zinc conc. remaining in blank water samples over time
25
Figure 4.5: Chromium conc. remaining in blank water samples over
time 26
Figure 4.6: pH variations in plant water samples over time 27
Figure 4.7: Zinc conc. remaining in water samples with water
hyacinth plants over time
28
Figure 4.8: Chromium conc. remaining in water samples with water
hyacinth plants 29
Figure 4.9: Bioconcentration factor of Zinc 30
Figure 4.10: Bioconcentration factor of Chromium 31
Figure 4.11: Desorption of Zinc after 1 week 33
Figure 4.12: Desorption of Zinc after 2 weeks 33
Figure 4.13: Desorption of Zinc after 4 weeks 33
Figure 4.14: Total desorption of Zinc 34
Figure 4.15: Desorption of Chromium 34
Figure 4.16: Variations of uptake for zinc by the plants 35
Figure 4.17: Uptake of chromium in plant tissues for different
initial concentrations 36
Figure 4.18: Translocation ability for Zinc by water hyacinth
plants 38
Figure 4.19: Translocation ability for 1 week 38
Figure 4.20: Translocation ability for 2 weeks 39
Figure 4.21: Translocation ability for 4 weeks 39
Figure 4.22: Comparison of roots and shoots in translocation
ability 40
Figure 4.23: Correlation of roots vs. shoots 40
List of symbols and abbreviations
AAS: Atomic Absorption Spectrometer
ANOVA: Analysis of variance
APHA: American Public Health Association
AWWA: American Water Works Association
BCF: Bioconcentration factor
BOD5: Biological oxygen demand during 5 days
CGIS: Geographic Information System and Remote Sensing Center.
Cr: Chromium
EDTA-Na2: Ethylen diethyl tetracetate disodium
et al.: Et alii
FFW: Final fresh weight
IFW: Initial fresh weight
ppm: Part per million
RG: Relative growth
SPSS: Statistical Package for the Social Sciences
TA: Translocation ability
US.EPA: United States Environment Protection Agency
WEF: Water Environment Federation
Zn: Zinc
Dedication
To my beloved family.
Acknowledgements
The achievement of this research was possible with the
contribution of several persons with their continued remarks, comments,
encouragement, their financial and moral supports, etc. to whom I would like to
thank you.
First of all, I am very grateful to the Almighty God for his
mercy during my studies and research. I'm also grateful to Rwandan Government
for the financial support to complete this Master's Programme.
In particular, my heartfelt thanks to my supervisor PhD.
candidate SEKOMO BIRAME Christian and my co-supervisor Dr. Innocent Nhapi, for
their acceptance to supervise this research, their particular remarks,
scientific discussions, critical comments, their availability and their
encouragement. My thanks go also to all UNESCO-IHE and NUR staffs who had
direct and indirect contributed to my studies at this juncture. I am also
indebted to the laboratory personnel of National University of Rwanda,
especially Jean Nepomuscene and Dominic of the Department of Chemistry from the
Faculty of Sciences, NUR.
I can not close my acknowledgements without to thank all WREM
colleagues cohort for their individual contribution, their sharing ideas
through certain modules, their scientific discussions during some hard moments,
for their cooperation and team spirit.
Furthermore, I greatly acknowledge my family, for being always
with me in every single steps of this thesis with their encouragement.
To everyone concerned by this research, please found your place
in my grateful thanks.
Abstract
Zinc and chromium are some of environmental pollutants and are
toxic even at very low concentrations. Domestic and industrial discharges are
probably the two most important sources for chromium and zinc in the water
environment. Rwanda is still facing problems of heavy metal discharges into
natural ecosystems by factories and household without any prior treatment. The
toxic heavy metals are entering the food chain through drinking water,
agriculture and fisheries activities and therefore endangering human life.
The general objective of this study is to investigate on the
major mechanisms responsible for Cr (VI) and Zn (II) removal form the water
phase by macrophyte plants. Water hyacinth have been used in the remediation
process in the present work because this plant has elaborate much roots system
providing more binding sites for Cr (VI) and Zn (II). Three mechanisms
(Adsorption, uptake and translocation) for fixation of Cr (VI) and Zn (II) by
macrophytes plants had been reported. The investigation had been conducted on
two heavy metals commonly found in polluted industrial wastewater in Rwanda (Cr
(VI) and Zn (II)).
Different parameters were studied in this research such as pH
effects, plant relative growth, trace metal remaining in water samples,
translocation ability, bioconcentration factor, adsorption, bioaccumulation and
uptake mechanisms. The pH slightly increase from starting time 0 hr (pH= 6.7)
to 48 hr (pH= 7.64 to 7.86); but after 48 hr of experiment, the pH decrease due
to the saturation of bound sites so some H+ are released in water
samples which cause the decreasing of pH. The relative growth significantly
decreased (P = 0.05) from 1, 3 and 6 mg/L in 1 week but for 2 and 4 weeks, the
relative growth slightly decreased linearity with the increasing (P = 0.05) of
metal concentrations due to relatively increasing toxicity in contrast to Cr
(VI) and Zn (II) concentration. This study shows that 56.7% of Zn (II) was
accumulated in petioles, 27.0 % in leaves and 16.3% in roots whereas for Cr
(VI) 73.7% was taken up in roots, 14.1% in petioles and 12.2% in leaves. It was
seen that 17.6%, 6.1% and 1.1% were respectively adsorbed for 1 mg/L, 3 mg/L
and 6 mg/L of Zn (II) concentrations by water hyacinth plants; but for Cr (VI),
9.0%, 36.4% and 54.6% were adsorbed respectively for 1 mg/L, 3 mg/L and of 6
mg/L. The order of translocation ability for Cr (VI) was
leaves<petioles<roots in water hyacinth whereas for Zn (II) was
leaves<roots<petioles.
Key words: Chromium, removal mechanisms,
wastewater, water hyacinth, Zinc
1 INTRODUCTION
1.1 Background
Heavy metals are environmental pollutants and some of them are
toxic even at very low concentrations. Pollution of the biosphere with toxic
metals has accelerated dramatically since the beginning of the industrial
revolution (Nriogo, 1979). The primary sources of this pollution are the
burning of fossil fuels, the mining and smelting of metalliferous, municipal
wastes, fertilizers, pesticides and sewage.
Heavy metals are of great concern primarily due to their known
toxicity to aquatic life and human health at trace levels (EPA, 2001; EPA,
2002). It was reported that domestic and industrial discharges are probably the
two most important anthropogenic sources for metals in the water environment
(Stephenson, 1987). However, the lack of a reliable method to predict metals
distribution in treatment units is a key weakness in determining metals fate
and transport in wastewater treatment processes, and therefore, the development
of effective pre-treatment guidelines (Patterson and Kodukula, 1984).
The rapid industrialization in some developing countries with
an enormous and increasing demand for heavy metals, such as zinc (Zn) and
chromium (Cr), causes high emissions of these pollutants into water bodies.
Unlike organic pollutants, metals in wastewater are not degraded through
biological processes, threatening not only the aquatic ecosystems but also
human health through contamination of drinking water. The reuse option of the
treated wastewater is an important strategy for conserving water resources,
particularly in areas suffering from shortage of water.
Several studies have shown that constructed wetlands are very
effective in removing heavy metals from polluted wastewaters (Qian et
al., 1999). Different wetland plant species differ, however, in their
abilities to take up and accumulate various trace elements in their tissues
(Rai et al., 1995). Recently, wetland plant species with high
capacities of trace element (Cu, Ni, Zn, etc.) removal from water were
identified (Zayed et al., 1998a; Zhu et al., 1999) duckweed
(Lemna minor L.) and water hyacinth [Eichhornia crassipes
(Mart.) Solms-Laubach
Heavy metals may come from natural sources, leached from rocks
and soils according to their geochemical mobility or come from anthropogenic
sources, as the result of human land occupation and industrial pollution.
Depending on their solubility, these metals may eventually become associated to
suspended particulates matter and/or accumulate in the bottom sediments
(Espinoza-Quinones et al., 2005).
In Rwanda, the problem regarding waste treatment in general is
still crucial at one side. At the other side the way to deal with such problem
is not easy at all because there is no appropriate technology for waste
treatment. The selection of that technology is not also an easy issue to deal
with because it must take into account many other important aspects like the
financial and social ones. And finally is that selected technology appropriate
in order to meet the effluent standards and is it also cost effective for a
developing country like Rwanda?
1.2 Problem description
Rwanda is facing problem of pollution in general. In many
cases the pollution ends in the water bodies. That pollution contains diverse
toxic pollutants (organic and inorganic compounds) coming from household and
factories. Heavy metals from factories but also from other sources such as
agriculture are the toxic compounds of our interest because they are not only
polluting the water sources used for drinking, agricultural and fisheries
purposes but they are also entering the food chain and therefore endangering
human life.
Wastewater contaminated by heavy metals need an effective and
affordable technological solution. In general wastewater from industrial
activities must not be allowed to be discharged into our water reservoir. In
order to stop the pollution at the production site, the on site treatment of
wastewater is the best option recommended for such waste. Several studies
indicate that aquatic plants have large potential for removal of organic and
inorganic pollutants from wastewater.
Diverse industrial wastes have aggravated the problem of water
pollution. This problem
becomes complex because of the differences in
pollution according to the industrial
activities and also due to the
non-biodegradability of inorganic pollutants like heavy
metals (Srivastav, et al., 1994). Heavy metals produce
undesirable effects, even if they are present in extremely small quantities on
human and animal life.
1.3 Objectives
The general objective of this study is to investigate on the
major mechanisms responsible for Cr (VI) and Zn (II) removal form the water
phase by macrophyte plants. Water hyacinth have been used in the remediation
process in the present work because this plant has elaborate roots system
providing much binding sites for heavy metals.
The specific objectives are:
· Assessment of the Cr (VI) and Zn (II) concentrations
adsorbed on the outer surfaces of the roots;
· Assessment of the Cr (VI) and Zn (II) concentrations
taken up by water
hyacinths;
· Assessment of the mobility and translocation of Cr (VI)
and Zn (II) within water hyacinths.
1.4 Research questions
In order to achieve the above mentioned objectives some research
questions need to be addressed:
· Which part of water hyacinth has much contributed in Cr
(VI) and Zn (II) removal?
· Which heavy metal between Cr (VI) and Zn (II) have been
preferably fixed by water hyacinth plant?
· What was the effect of metals concentration on water
hyacinth growth and how was the bioaccumulation factor?
1.5 Hypotheses
· Cr (VI) and Zn (II) are adsorbed, taken up and
translocated by water hyacinth. When saturation of binding sites is reached,
the plant will no longer be efficient in Cr (VI) and Zn (II) removal.
· Zn (II) is preferably adsorbed and taken up by water
hyacinth when compared to Cr (VI) because of the smallest size and his positive
charge.
· High metal concentration is toxic to the growth of
water hyacinth plant therefore the bioaccumulation factor will increase with a
low metal concentration and decrease with the increasing of the metal
concentration.
1.6 Scope of the research
The research was aimed to investigate on the mechanisms
involved in Cr (VI) and Zn (II) removal by water hyacinth plants in a closed
system. That's why this research was limited at a laboratory pilot scale by
using an industrial synthetic wastewater prepared in the lab by adding
different concentrations of Cr (VI) and Zn (II), water hyacinth plants were
used as adsorbent to assess the mechanisms of removal.
1.7 Report outline
This study has been delimited in six chapters according to the
general introduction (background, problem description, objectives, research
questions, hypotheses and the limitation of the research), literature review
(general in formations on heavy metals, water hyacinth, wastewater treatment),
materials and methods used, results found, discussions on results found,
conclusions and recommendations followed by references and some appendices.
2 LITERATURE REVIEW
2.1 Overview on use of macrophytes in metal removal
Aquatic plants have been used now for decades to remove heavy
metal in polluted water (Rai et al., 1995; Denny et al.,
1995; Mungur et al., 1997; Zhihong et al., 1997; Obarska,
2001; Cheng et al., 2002; Keskinkan, 2005). These aquatic plants
commonly called macrophytes plants belong to different plant species. In
general these aquatic plants showed the capacity to remove heavy metal from
polluted water by accumulation in their roots or by simple uptake by the plants
(Lubberding et al., 1999; Lubberding et al., 2000; Awuah
et al., 2000; Lubberding et al., 2001). Many investigations
on metal removal have been conducted with the principal aim of cleaning the
environment from these dangerous metals. No particular attention to the
mechanism involved in the removal process had been investigated to explain what
is really occurring in the solution and what should be do to enhance the
removal efficiency when macrophytes plants cannot accumulate anymore heavy
metal in its roots or leaves.
Considerable interest has developed in the removal of heavy
metal in water using macrophytes plants (Prasad and Freitas, 2003). This method
of extracting heavy metal from polluted water bodies is called phytoextraction.
Plants are used to accumulate and uptake heavy metal from soil, sludge or
water. It has been reported that the removal accumulation process occurs via
adsorption, uptake and translocation processes (Abdel-Rahman, 1999; Kelderman,
2000; Leman, 2000; Babu, 2001; Meggo, 2001 and Alick, 2002).
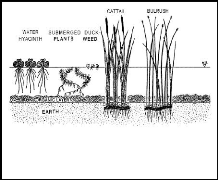
Figure 2.1: Common aquatic plants (source: Aquatics,
2005)
In all reported investigations, it has been demonstrated that
adsorption was the main mechanism involved in the removal of heavy metal. In
some cases uptake and translocation have been observed. (Hasan et al.,
2006)
Different species have the ability to remove coliforms,
bacteria, metals from wastewater such as Nasturtium officinale to
accumulate Copper, Zinc and Nickel (Kara, 2005), the ability of water hyacinth
(Eichhornia crassipes) to remove Aluminum by constructed wetland grown
under different nutritional conditions is excepted (Jayaweera et al.,
2007), by different mechanisms. Vesk et al. (2006) confirm the metal
localization within and around roots of water hyacinth growing in a wetland
receiving urban run-off.
Several publications (Sarabjeet and Dinesh, 2005; Liu et
al., 2007, etc.) shown different plants able to treat wastewater in terms
of heavy metals removal such as Lemna minor, Myriophyllum aquaticum,
Ceratophyllum demersum, Azolla filiculoides, Salvinia natans, Acanthopanax
sciadophylloides, Ilex crenata, Clethra barbinervis, Acanthopanax
sciadophylloides, Pieris japonica, Ilex crenata, Rhododendron semibarbatum Acer
sieboldianum, Acer rufinerve, Acer micranthum, Lindera erythrocarpa, Clethra
barbinevris Macadamia neurophylla, M. augustifolia, Betula verrucosa, Sorbus
aucuparia, Clethra barbinervis.
2.2 Water hyacinth (Eichhornia crassipens (Mart.)
Solms.
Water hyacinth (E. crassipens) is fast growing
perennial aquatic macrophyte (Reddy
and Sutton, 1984). It is a member of
pickerelweed family (Pontederiaceae) and its name
Eichhornia was derived from well-known 19th century
Prussian politician J.A.F. Eichhorn (Aquatics, 2005). The plants can double its
population in only twelve days (APIRIS, 2005). Water hyacinth is also known for
its ability to grow in severe polluted waters (So et al., 2003).
E. crassipens is well studied as an aquatic plant that can improve
effluent quality from oxidation ponds and as a main component of one integrated
advanced system for treatment of municipal, agricultural and industrial
wastewaters (U.S. EPA, 1988; Sim, 2003). Water hyacinth is often described in
literature as serious invasive weed on the world (U.S. EPA, 1988; Maine et
al., 1999; Wilson et al., 2005).
2.2.1 Systematic position
a. Taxonomy
Cronquist (1988), Thorne (1992) and Takhtajan (1997) suggest
following water hyacinth taxonomic placement (Center et al. 2002):
Division: Magnoliophyta
Class: Liliopsida
Subclass: Commeinidae
Superorder: Commelinanae
Order: Pontederiales
Family: Pontederiaceae
Genus: Eichhornia
Specific epithet: crassipes (Martius) Solms-Laubach.
b. Morphology
Water hyacinth (Eichhornia crassipes) is a perennial,
floating macrophyte, freshwater aquatic vascular plant with rounded, upright,
shiny green leaves and spikes of lavender flowers (Reed et al., 1997).
The petioles of the plant are spongy with many air spaces and contribute to the
buoyancy of the hyacinth plant. When grown in wastewater, individual plants
range from 0.5 to 1.2 m from the top of the flower to the root tips (Reed
et al., 1997).
The plants spread laterally until the water surface is covered
and then the vertical
growth increases. Hyacinths are very productive
photosynthetic plants. Their rapid
growth is a serious nuisance problem in many slow flowing
southern waterways. These same attributes become an advantage when used in a
wastewater treatment system.
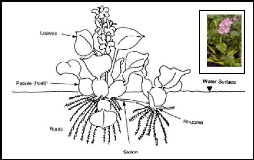
Figure 2.2: Morphology of water hyacinth plant (source:
Aquatics, 2005)
2.2.2 Ecological factors
Water hyacinth is heliophyte plant growing best in warm waters
rich in macronutrients. Optimal water pH for growth of this aquatic plant is
neutral but it can tolerate pH values from 4 to 10. This is very important fact
because it points that E. crassipens can be used for treatment of
different types of wastewater. Optimal water temperature for growth is
28-30oC. Temperatures above 33oC inhibit further growth
(Center et al., 2002). Optimal air temperature is 21-30oC.
So if aquatic systems with water hyacinth are constructed in colder climates it
would be necessary to build greenhouses for maintaining optimal temperature for
plant growth and development. Low air humidity from 15% to 40% can also be
limiting factor for undisturbed growth of water hyacinth (Allen, 1997). E.
crassipens tolerates drought well because it can survive in moist
sediments up to several months (Center et al., 2002).
2.2.3 Potentials and constraints in using of water
hyacinth
Water hyacinth is plant with many advantages firstly because it
can be used for many
purposes, but it has one major consequence. E.
crassipes is one of the most invasive
weeds that can destroy precious
aquatic ecosystems in a short time which can lead to
series of other problems. Because of that it is very difficult
to answer the question - Is E. crassipes the golden plant or the
world's worst aquatic weed?
One can often read that people have a moral imperative to
think about potential utilization of abundantly available biomass of water
hyacinth in tropical countries for the benefit of people for whom E.
crassipes has created many problems or even has destroyed their lives.
There are many examples around the world of how communities or individuals have
used water hyacinth to great advantage. In regions where it can be found in
abundance water hyacinth can be used like food for people because its leaves
are rich in proteins and vitamin A. It can be also utilized as green fertilizer
or as mulch, compost and ash in regenerating degraded soils. (Lindsey and Hirt,
1999).
In African countries like Uganda water hyacinth has also
influenced on much frequent occurrence of diseases (dysentery, malaria, and
schistosomiasis) related to content of different pathogens in water. It has
been discovered that water hyacinth's quest for nutrients can be turned in a
more useful direction. The plant has been shown to accumulate trace elements
such as Ag, Pb, Cd and Zn.
The focus on water hyacinth as a key step in wastewater
recycling is due to the fact that it forms the central unit of a recycling
engine driven by photosynthesis and therefore the process is sustainable,
energy efficient and cost efficient under a wide variety of rural and urban
conditions.
2.3 Heavy metals
The designation «Heavy metals» is applied to a group
of metals and metalloids with a specific density greater than 5 g /
cm3. They are frequently associated with pollution and toxicity in
the environment. In general «trace metals» is the term used because
they occur in low concentrations in the earth's crust. Element like As, Cd,
CrVI, Hg and Pb are known to be very toxic. However some metals like
Co, Cu, Mn, Se and Zn are essential for living organisms at low concentrations
and are vital components of enzymes. Heavy metals occur naturally in the
environment, usually at relatively low concentrations as a result of weathering
and other pedogenic processes acting on the
rock fragments on which soils develop (Rulkens et
al., 1995). These metals are then transported to the aquatic ecosystem
through leaching and run-off phenomena.
Human activities have increased the amount of heavy metals
released to the environment. Metals have been exploited at an alarming rate
because of their economic value. The negative consequences of this situation
have only been realized within the last decades. Because of that, many
researches on the interaction of heavy metals with various components of the
environment have been conducted and still going on with the main objective of
finding suitable ways of solving and avoiding heavy metals pollution on the
surrounding environment.
The existence of heavy metals in the environment represents a
very significant and long-term environmental hazard. Even at low concentrations
these metals can be toxic to organisms, including humans. In particular,
chromium is a contaminant that is a known mutagen, teratogen and carcinogen
(Chang, 1996; Young et al., 2006).
The removal of heavy metals from aqueous solutions has
therefore received considerable attention in recent years. However, the
practical application of physicochemical technology such as chemical
precipitation, membrane filtration and ion exchange is sometimes restricted due
to technical or economical constraints. For example, the ion exchange process
is very effective but requires expensive adsorbent materials (Lehmann et
al., 1999; Volesky, 2001).
The use of low-cost waste materials as adsorbents of dissolved
metal ions provides economic solutions to this global problem and can be
considered an eco-friendly complementary (Volesky et al., 1995; Mullen
et al., 1989). At present, emphasis is given to the utilization of
biological adsorbents for the removal and recovery of heavy metal contaminants.
(Young et al., 2006).
Aquatic macrophytes are known to remove metals by surface
adsorption and/or absorption and incorporate them into their own system or
store them in a bound form (Rai et al., 1995). The uptake of trace
metals by the root systems of aquatic plants depend both on the kind of metal
and on the species of plant absorbing the metal (Samecka-Cymermann and Kempers,
1996).
2.4 Wastewater
Wastewater is a general term that encompasses a myriad of
wastes in the water medium originating from diverse sources. Normally, the two
major sources of concern are of domestic and industrial origin but also
agriculture.
Several authors shown results from Iron bridge water hyacinth
system in Florida, USA demonstrated that phosphorus removal was from 35 to 80 %
(U.S. EPA, 1988). The same facility successfully removed about 60% of BOD5 and
43% of suspended materials from wastewater. These systems can also remove heavy
metals like chromium, cadmium, copper, zinc and other effectively. In their
experiments Maine et al. (1999) have shown that 72% of cadmium was
removed from wastewater by water hyacinth. Accumulated nutrients and heavy
metals are removed from aquatic systems by plant harvesting and sediment
dredging (Reddy and Sutton, 1984; U.S. EPA, 1988).
There are many speculations on the use of water hyacinth upon
harvesting. According to some authors (Lindsey and Hirt, 1999) it can be use
like food for people or fodder. But it is not recommended to consume water
hyacinth if it was used for removal of heavy metals, rare earth elements or
other toxic substances that can cause problems if they enter food chain (Chua,
1998). Upon harvesting water hyacinth can be used for composting, anaerobic
digestion for production of methane, and fermentation of sugars into alcohol
(U.S. EPA, 1988). These operations can help in recovering expenses of
wastewater treatment.
Aquatic macrophytes are known to remove metals by surface
adsorption and/or absorption and incorporate them into their own system or
store them in a bound form. The uptake of trace metals by the root systems of
aquatic plants depend both on the kind of metal and on the species of plant
absorbing the metal
Table 2.1 shows that the effective response of water hyacinth
after exposed to cadmium and zinc in different concentrations is different
depending on metal. As it shown, zinc was more adsorbed and taken up by the
plant than the cadmium.
Table 2.1: Maximum growth response of water hyacinth exposed
to Cd and Zn
|
Parameter
|
Cd
|
Zn
|
|
Relative growth
|
0.85a
|
0.89c
|
|
Metal accumulation (mg/kg) shoot
|
113.2a
|
1926.7c
|
|
root
|
2044a
|
9652.1c
|
|
Residual concentration (mg/L)
|
0.185a
|
6.29c
|
|
BCF
|
622.3b
|
788.9d
|
a: 4 mg/L Cd, b: 2 mg/L Cd, c: 40 mg/L Zn, d: 5 mg/L
Zn.
(Source: Xiaomei et al., 2004)
BCF : bioconcentration
factor
2.5 Foliar absorption
In addition to root absorption, plants can also derive low
amounts of some elements through foliar absorption. Foliar absorption of solute
depends on the plant species, its nutritional status, the thickness of its
cuticle, the age of the leaf, the presence of stomata guard cells, the humidity
at the leaf surface and the nature of the solutes (Marschner, 1986). Metal
antagonism, such as Cu and Zn, can occur in foliar absorption as well as in the
root (Channel, 1986). Aerosol deposited lead does not penetrate the cuticle of
higher plants, but tend to adhere to the surface of leaves. They can however be
absorbed through the cuticle of some bryophytes (Alloway, 1990).
2.6 Translocation of metals within plants
Once the ions have been absorbed through the roots or leaves
and have been transported to the xylem and phloem vessels. There is a
possibility of movement throughout the whole plant (Alloway, 1990; Streit and
Stumm, 1993). The mobility of different metal ions varies and the rate and
extent of movement within plants depends on the metal, the plant organ and the
age of the plant. Zn, Cu and Pb fall in the category of metals which are
readily, immediately and least translocated respectively. In the xylem heavy
metals will usually only be transported if special chelates are formed. For
example, zinc may be transported by chelation to organic acids, copper
transported in complex with amino acids, nickel can be transported as nickel
peptide complex and lead may be transported as a Pb-EDTA complex (Greger, 1999;
Saxena et al., 1999).
2.7 Uptake
The uptake process is a mechanism by which metal ions are
transported across the cell membrane and can be used in a building of new
biomass or stored in vacuoles. Streit and Stumm (1993) reported that little is
known about the mechanism involved in the absorption and translocation of heavy
metal to the host plant root cells. The presence of carboxyl groups at the
roots system induces a significant cation exchange capacity and this may be the
mechanism of moving heavy metal in the roots system where active absorption
takes place.
Table 2.2 shows that water hyacinth plants are able to remove
the maximum of chromium concentration from wastewater at low concentration
(72.3 %). When metal concentration increases in wastewater, the removal
capacity of water hyacinth plants decrease linearity.
Table 2.2: Chromium uptake by water hyacinths during a period
of 17 days from Keith et al., 2006
Sample ID Chromium % removal vs. control
Ctr. w/ plant 0.067
Ctr. w/ o plant 0.014 0
7 ppm w/ plant 1.98
7 ppm w/ o plant 7.16 72.3
14 ppm w/ plant 10.4
21
14 ppm w/ o plant 13.1
28 ppm w/ plant 20.7
28 ppm w/ o plant 25.6 19.1
Comparing to the above results in Table 2.2, the Table 2.3
depicts the phenomenon for copper removal which follow the same trend as for
chromium, but the removal capacity by the plants is less than for chromium (53
%).
The most important parameter to consider is the pH (Kelly,
1988). Generally when the pH decreases, the toxicity of metal ions increases
because the proportion of the adsorbed ion on the root system decreases
(Harding and Whitton, 1977).
Table 2.3: copper uptake by water hyacinth during a period of
17 days.from Keith et al., 2006
Sample ID Copper % removal vs. control
Ctr. w/ plant 0.567
Ctr. w/ o plant 0.266 0
2.5 ppm w/ plant 0.949
53
2.5 ppm w/ o plant 2.02
5 ppm w/ plant 3.45
0
5 ppm w/ o plant 2.9
10 ppm w/ plant 5.38
0
10 ppm w/ o plant 2.39
Table 2.4 presents the results of Arsenic removal by water
hyacinth plants and it is shown that water hyacinth is not able to remove
Arsenic from wastewater even if at low concentration.
Table 2.4: Arsenic uptake by water hyacinth during a period
of 17 days from Keith et al., 2006
Sample ID Arsenic % removal vs. control
Ctr. w/ plant 0.056
0
Ctr. w/ o plant 0.03
5 ppm w/ plant 5.4
4.8
5 ppm w/ o plant 5.67
10 ppm w/ plant 10.2
4.7
10 ppm w/ o plant 10.7
20 ppm w/ plant 20.4
20 ppm w/ o plant 19.6 0
The results show how a floater plant like water hyacinth
affects arsenic, chromium, and copper. Water hyacinths do not seem to remove
large amounts of arsenic or copper from contaminated water.
The water hyacinth appeared to be a good choice for removing
chromium from polluted water. At low concentrations, the plant removed about
70% of the chromium in the water (Table 2.2). As the concentrations increase,
the plant appeared to be unable to take up as much as possible percent chromium
(21%). In conclusion, the effectiveness removal order of these metals was
arsenic<copper<chromium.
3 MATERIALS AND METHODS
3.1 Water Hyacinth sampling site description
The water Hyacinth plants were collected in Nyabugogo swamp
which is located in capital city (Kigali) of the country. The part which is
shown as Nyabugogo swamp on the map is one which is not exploited by the
population for agriculture and is the one considered as natural wetland,
receiving wastewaters of Kigali City. Its surface area, according to CGIS, is
60.09 ha (CGIS, 2007).
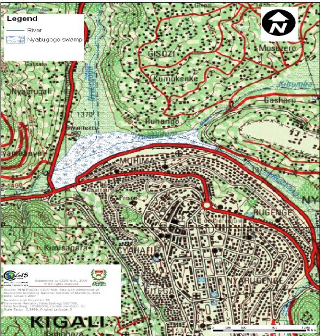
Figure 3.1: Topographic map showing the
location of Nyabugogo swamp and its influents. (Source: CGIS, 2007)
3.2 Methods
3.2.1 Description
The methodology developed in this research taken the approach
consisting in the laboratory pilot scale experiment. Major mechanisms of metal
removal were explained on basis of experimental results and available
information in the literature review. Adsorption and uptake, translocation and
foliar absorption tests were performed to assess the metal removal using water
hyacinth. Three replicates were done during the lab experiment.
3.2.2 Synthetic wastewater solution
preparation.
1 mol of ZnCl2 contains 1 mol of Zn (II) and also 1 mol of
K2Cr2O7 contains 2 mol of Cr(VI). Then knowing that the load of 1
mol ZnCl2 is 136.2 g ,1 mol K2Cr2O7 is 294 g, 1 mol Zn is 65.2 g and
2 mol of Cr is 2* 52 g = 104 g , we calculated the load of each salt to be
weighted and dissolved into 1 liter of aqueous solution. Thus for zinc, the
calculation has been done as follows: 1g * 136.28 g / 65.2 g = 2.1 g of ZnCl2
and for chromium we did it as follows: 1 g * 294g / 104 g = 2.8 g of
K2Cr2O7 .As we decided to prepare 100 ml of solution, 0.21g of ZnCl2
and 0.28 g of K2Cr2O7 were dissolved into 100 ml of solution. For 1
mg/l of Zn (II) and Cr(VI) preparation, we abstracted 1 ml from these 100 ml
and dilute up 1000 ml of solution. We did the same for 3 mg/l and 6 mg/l by
abstracting respectively 3 ml and 6 ml from the 100 ml of solution and dilute
up 1000 ml. The pH of the solution was then adjusted between 6 #177; 0.7 by
addition of dilute HNO3 or NaOH as required.
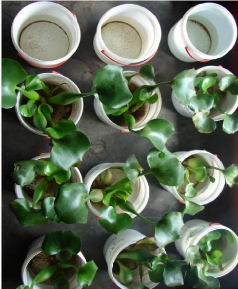
3.2.3 Experimental Procedures
The Water Hyacinth plants (Eichhornia crassipes) were
collected from Nyabugogo wetland in Kigali city, were rinsed with tap water and
distilled water to remove any epiphytes and insect larvae grown on plants. The
plants were placed in big plastic containers with water under natural sunlight
for several weeks to let them adapt to the new environment, then the plants
were selected and weighted by sensitive balance. The experimental set-up was
consisting in the use of small plastic container buckets of 16
cm of diameter and 14.5 cm in height. All experiments were run
in a batch system using a nutrient solution constituted by 500 ml of tap water
from the valley located at Butare near Pharmacopée centre, 500
ml of wastewater from the Nyabugogo wetland plus quantity of Ca(NO3)2 .4H2O,
NaNO3, NH4Cl, K2HPO4 respectively 20, 20, 20 and 40 mg. The fresh weight of the
plants in each bucket was measured by using sensitive balance before starting
each growing time: 1, 2 and 4 weeks.
A stock solution (1,000 mg/L) of Zn (II) (ZnCl2) and Cr (VI)
(K2Cr2O7) was prepared in distilled water, which was later diluted
as required. The plants were maintained in water supplemented by Heavy metals
by pouring a certain volume of the metals stock solution in order to get the
final concentration of 1, 3 and 6 mg/L of Cr and Zn respectively in different
plastic buckets containing water hyacinth plant in three replicates.
Plastic buckets with zinc and chromium concentrations without
water hyacinth plants served as control. Distilled water was added in order to
compensate for water loss through plant transpiration, sampling and
evaporation. Water samples were taken and pH measurements by pH meter were
taken every 60 minutes for the first day during 6 hours and for the following
days one sample after time period was taken during 1, 2, and 4 weeks of
exposure to metal solution. All samples were filtered using 0.45 um cellulose
acetate filters (wathman papers) and acidified with 5 drops of nitric acid
(HNO3 65%) in the laboratory for storage of water samples in volumetric flasks
(250 ml) before Atomic Absorption Spectrometer analyses.
The Figure 3.2 shows the plan view of laboratory experimental set
up developed during our research in National University of Rwanda, Faculty of
Sciences.
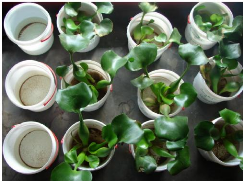
Figure 3.2: Plan view of experimental set
up.
After each test duration (1, 2 and 4 weeks), final fresh
weight for each water hyacinth plant was taken; plants were harvested for other
analyses. They were separated into petioles, roots and leaves and were analysed
for relative growth, metals accumulation, translocation ability,
bioconcentration factor (BCF) and adsorption on the outer surface of roots. For
adsorption, roots were immersed in EDTA-Na2 for metal desorption. All parts of
the plants were dried in drying oven at 105°C for 24 hours. In addition,
the metals remained in the solution were measured to assess the removal
potential of water hyacinth plants.
The figure 3.3 depicts different steps developed in the
laboratory for data collection and analyses.
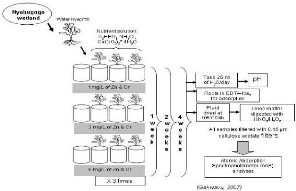
Figure 3.3: steps in lab experiment.
3.3 Sample Analyses
3.3.1 Relative Growth
Relative growth of control and treated plants was calculated
to assess the effects of zinc and chromium concentrations on water hyacinth
plant growth in relationship with time. The formula bellow was used to
calculate the relative growth:
Where FFW denotes final fresh weight
(g); IFW denotes initial fresh weight (g) and
RG denotes the relative growth of water hyacinth
plants which is dimensionless.
3.3.2 Bioconcentration Factor
The BCF (bioconcentration factor) provides an index of the
ability of the plant to accumulate the metal with respect to the metal
concentration in the substrate. The BCF was calculated as follows:
Concentration of metal in plant tissue
BCF =
Initial concentration of metal in external solution (3.2)
(source: Xiaomei et al., 2004)
or
BCF = (P/E)i (3.3)
(Source: Liao and Chang, 2004)
Where I denotes the heavy metals,
BCF the bioconcentration factor and
P represents the trace element concentration in plant
tissues (mg.Kg-1), E represents the trace
element concentration in the water (mgL-1) or in the sediment
(mgkg-1 dry wt). A larger ratio implies better phytoaccumulation
capability.
3.3.3 Metals Accumulation
Metals accumulation in plant and water samples was measured.
Digestion of samples in this study was performed according to the Standard
Methods by APHA.7 (APHA/AWWA/WEF, 2005) Plant biomass samples was decomposed to
dry matter by heating at 105°C for 24 hours in a hot air oven and the fine
particles were digested with nitric acid (HNO3) and hydrogen peroxide (H2O2),
filtered through a wathman paper filter into a volumetric flask before Atomic
Absorption Spectrophotometer analyses. The two following mechanisms were
performed in analyses to differentiate the metal adsorbed and up taken by water
hyacinth during experiment period.
a. Adsorption
The adsorption consists on metal attached to the outer
surface of the roots. To quantify the metal adsorbed by water hyacinth after
the plant exposure to different concentrations of chromium and zinc in
different periods of times (1week, 2weeks and 4 weeks). After test duration of
observation, the adsorption was determined by putting roots of water hyacinth
plant in nine beakers containing 20 ml of EDTA-Na2 respectively for 5, 10, 15,
20, 25, 30, 35, 40 and 45 min for removal of zinc and chromium trace elements
on the outer surface of the roots. Those EDTA-NA2 solutions were filtered,
acidified by 5 drops of Nitric acid (HNO3) and analysed by Atomic Adsorption
Spectrophotometer (AAS) for zinc and chromium adsorbed by the plants.
b. Uptake
The uptake process is a mechanism by which metal ions are
transported across the cell membrane and can be used in a building of new
biomass or stored in vacuoles. To assess this mechanism during our research;
after period observation, water hyacinth plants were taken out form the small
buckets, roots, petioles and leaves were separated, dried in dry oven at
105°C during 24h. Plant samples were digested and analyzed by AAS to
identify the zinc and chromium concentrations in plant biomass (roots, leaves
and petioles).
c. Translocation ability (TA)
The translocation ability shows the ability of water hyacinth
plants to transport across the metal ions in the shoot tissues. It was
calculated by dividing the concentration of a trace element accumulated in the
root tissues by that accumulated in shoot tissues (Wu and Sun 1998). TA
is given by:
TA = (Ar Ú As)I (3.4)
Where i denote the heavy metal,
TA is the translocation ability and is dimensionless.
Ar represents the amount of trace element accumulated
in the roots (mg.Kg-1 dw), and As
represents the amount of trace element accumulated in the shoots
(mg.Kg-1 dw).
Statistics were used to assess the variations and correlations
between parameters studied. The following were used: standard deviation,
regression analyses, analyse of variance 2 (ANOVA 2) with replications and
other tools in MS-Excel such as average, mean values, etc.
4 RESULTS AND DISCUSSIONS
The laboratory experiments for this research were started in
March 2007 and ended at the end of October 2007. Water hyacinth plants were
collected several times but unfortunately some of them died due to rigorous
conditions, more than 1,000 samples (water and plant mixed) were analyzed and
the results for this research are average values.
4.1 Variations on plant relative growth
4.1.1 Relative growth of water hyacinth plants
The relative growth was calculated to estimate the effects of
zinc and chromium concentrations on plant growth according to exposure time.
The relative growth indicates the tolerance of the plants to different
concentrations of metal and exposure time to these metals. It was observed that
the final fresh weight increased compared to the initial fresh weight in the
first week but it decreased when the metal concentration increased, mostly for
6 mg/L. There is a slight stagnation for the second week and fourth week in
plant growth in terms of metal concentration. The growth decreased with
increasing time and metal concentrations due to a decreasing of essential macro
and micro nutrients for the plants in the experimental water in the small
buckets.
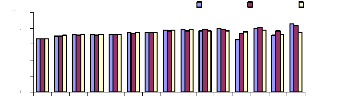
The growth of water hyacinth at different concentrations of
chromium and zinc is shown on Figure 4.1. It was noted that the relative growth
of the plants decreased considerably in the first week only and slightly
decreased with an increasing metal concentration and exposure time. There was
constant trend in the plant growth after 1 week of experiment. However, at
higher concentrations of these metals, plant growth was always inhibited. The
growth of water hyacinth plants significantly increased (P = 0.05) with the
passage of time according to the Figure 4.2.
|
Relative growth values
|
5 4 3 2 1 0
|
|
|
1 wk, 1
1 wk, 3
1 wk, 6
2 wks, 1
2 wks, 3
2 wks, 6
4 wks, 1
4 wks, 3
4 wks, 6
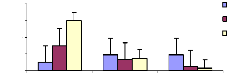
Exposure time (week) and initial conc.
|
Figure 4.1: Relative growth of water hyacinth plants vs
exposure time for different Zn and Cr concentrations
4.1.2 Discussions on relative growth of water hyacinths
For water hyacinth plants treated with Zn and Cr, the relative
growth significantly decreased (P = 0.05) from 1, 3 and 6 mg/L in 1 week but
for 2 and 4 weeks, the relative growth slightly decreased linearly with the
increasing (P = 0.05) of metal concentrations. In the case of zinc and
chromium, however, the relative growth exhibited an exponential decrease caused
by relatively increasing toxicity in contrast to chromium and zinc
concentrations.
The ANOVA 2 shows that for 1 week exposure time, there is a
high effect (difference is significant) of initial concentrations (1, 3 and 6
mg/L) to the growth of the plants (P = 0.05), but for 2 and 4 weeks according
to initial concentrations, the difference is not significant (P = 0.05).
4.1.3. Correlation between final fresh weight and
relative growth
Figure 4.2 shows that there is no correlation between the
final fresh weight and the relative growth of water hyacinth plants. The non
existence of correlation is reported by the stagnation in plant growth due to
the decreasing nutrients and increasing metal concentrations. It was considered
that a decrease in the growth was induced by metal toxicity.
Final Fresh weight vs Relative growth
y = 0.009x + 1.4994
R2 = 0.2977

30 50 70 90
Final Fresh Weight (g)

4
3
2
1
0
Relative growth
Figure 4.2: Correlation between Relative Growth of plants and
Final Fresh Weight
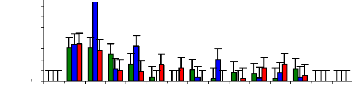
4.2 pH effects and metal concentrations remained in
controls (blanks) 4.2.1 pH effects in blank samples
Figure 4.3 shows the variations of pH in blanks which are due
to elements contained in blank samples such as bacteria, phytoplanktons,
zooplanktons, also the variations of temperature can affects pH in blank
samples. The correlation between metal removal and the role of experimental
containers exists. The increasing or decreasing of pH in blank samples without
water hyacinth plants indicates that some elements of metal were fixed on the
internal surface of experimental buckets.
Oh
1 hr
3 hr
6 hr 10 hr 15 hr 21 hr 33 hr 57 hr 105 hr 177 hr 273 hr 393 hr
537 hr 705 hr
Exposure time (h)
pH
pH, 1mg/L pH, 3mg/L pH, 6mg/L
10
8
6
4
2
0
Figure 4.3: variations of pH in blank samples
4.2.2 Zinc concentrations remaining in blank
samples
Figure 4.4 shows the trend of zinc concentration in blank water
samples at different
initial concentrations (1, 3 and 6 mg/L) and at
different periods of time. It was shown
that experimental small buckets may fix some trace elements of
zinc on internal surface of buckets or some trace elements were accumulated in
sediment because of the variation in metal concentration during the exposure
time. For 1 mg/L, the removal of zinc follows a linear trend of decreasing
concentration with the increasing of exposure time.
0.2
|
0.18
|
|
Zn2+, 1mg/L Zn2+, 3mg/L Zn2+, 6mg/L
|
|
0.16
|
|
Exposure time (h)
1 hr
Oh
6 hr
3 hr
33 hr
21 hr
15 hr
10 hr
57 hr
105 hr
177 hr
537 hr
393 hr
273 hr
705 hr
0.14
0.12
0.1
0.08
0.06
Conc. (mg/L)
0.04
0.02
0
Figure 4.4: Zinc conc. remaining in blank water samples over
time
4.2.3 Chromium concentrations remained in blank
samples
Figure 4.5 shows that chromium was quickly fixed on the
internal surface of experimental buckets and also due to phytoplankton,
zooplanktons in water samples. Some trace elements were analyzed in water from
1 to 10 hr only and after 177 hr, the internal surface releases chromium
concentration in water and other trace elements were accumulated in
sediment.
Exposure time (h)
Conc. (mg/L)
0.16
Cr6+,1mg/L Cr6+, 3mg/L Cr6+,6mg/L
0.14
0.12
0.1
0.08
0.06
0.04
0.02
0
Oh
1 hr
3 hr
6 hr
10 hr
15 hr
21 hr
57 hr
33 hr
105 hr
177 hr
273 hr
705 hr
537 hr
393 hr
Figure 4.5: Chromium conc. remaining in blank water samples
over time
4.2.4 Discussions of pH effects on metal concentrations
in blank samples
It was reported that pH variations affect metal concentrations
in blank samples. According to Barron et al. (1982), if metals are
present in wastewaters that contain hexavalant chromium, this chromium must be
reduced prior to metal removal. In general, hydroxides usually prove to be the
controlling species for adsorbing metal from industrial or domestic
wastewater.
The ANOVA analyses show that there is no effect of exposure
time to metal concentrations in blank samples for 1 and 3 mg/L (0.7 < 2.1;
1.6 < 2.1 respectively) but for 6 mg/L, the exposure time shows a
significant effect on metal concentrations (2.7 > 2.1). According to pH
variations, type of metal (zinc and chromium) and concentrations (1, 3 and 6
mg/L), there is a high significant difference (P = 0.05) observed during the
experiment.
4.3 pH variations and Zn(II) and Cr(VI) concentrations in
water
samples with water hyacinths
4.3.1 Variations of pH on metal removal by the
plants
The pH is an important parameter affecting the rate and the
extent of biosorption of metal ions onto bioadsorbents such as water hyacinth
plants. The variation of pH may affect the surface charge of roots of water
hyacinth plants and also the solubility of metal ions. Some metal ions are
known to be adsorbed or absorbed in the form of
hydroxides at high pH values such as pH>6. For this reason
the effects of initial pH on biosorption of Zn (II) and chromium (VI) ions onto
water hyacinth plants was investigated for the initial pH values equals to
6.7.
The variations of pH, zinc and chromium concentrations in
water samples with water hyacinth plants after 4 weeks of lab experiments in
which was observed an increasing in pH up to pH > 7.5 at 105 hr for 1 mg/L,
3 mg/L and 6 mg/L and then the situation changes after 105 hr of exposure to
metal.
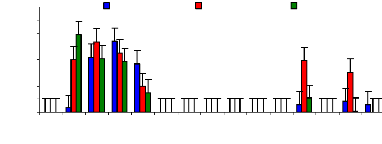
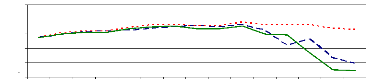
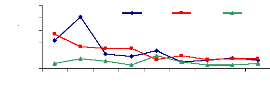
It was shown that pH variations affects metal removal during
the experiment. Figure 4.6 showed that the pH slightly increased from the
starting time (0 hr) (pH= 6.7) to 105 hr (pH= 7.64 to 7.86). However, after 105
hr of experiment, the pH decreased due to the saturation of adsorption sites,
so some H+ are released in water samples that caused the decreasing
of pH.
Zinc and chromium ions removal from solution was almost
completed within 105 hours for pH values above 6 and bellow 8 because of
adsorption. The pH of 6 is the critical point for zinc ions because of zinc
hydroxide adsorption or absorption. Therefore, it can be said that the optimum
pH for adsorption and absorption of zinc (II) and chromium (VI) ions by water
hyacinth plants in lab experimental set up is about pH =7.5.
|
Oh
|
1 hr
|
3 hr
|
6 hr
|
10 hr
|
15 hr
|
21 hr
|
33 hr
|
57 hr
|
105 hr
|
177 hr
|
273 hr
|
393 hr
|
537 hr
|
705 hr
|
Exposure time (h)
pH, 1mg/L pH, 3mg/L pH, 6mg/L
pH
4
9
8
7
6
5
Figure 4.6: pH variations in plant water samples over
time
4.3.2 Zinc concentrations remaining in water samples
after 4 weeks of experiment.
Figure 4.7 plotted out the remaining zinc concentration in
water samples after four weeks of lab experiments. It was observed that about
60% of zinc (II) was removed within 21 hours. Water hyacinths are effective
plants for zinc (II) ions removal form wastewater in the range of concentration
between 1 to 6 mg/L. Because the outer surfaces of water hyacinth roots are
negatively charged with some acetate groups and metal ions are positively
charged, roots attract metal ions, but when adsorption sites of roots are
saturated, it is expected that metal ions can be released in water samples. The
detention time must be determined. The passage in time influence the metal
removal, as the plant can once again release the metal ion back into the water
column when the adsorption sites become saturated. The decrease of pH in water
samples related to growing time is an important factor in metal absorption and
adsorption mechanisms by the plants. It is very clear that after 21 hr, little
trace elements of metal are still present in water samples with water hyacinth
plants.
0.25
Exposure time (h)
57 hr
Oh
1 hr
537 hr
6 hr 10 hr
177 hr
273 hr
705 hr
393 hr
105 hr
33 hr
21 hr
15 hr
3 hr
Zn2+, 1mg/L
Zn2+, 3mg/L
Zn2+, 6mg/L
0.2
0.15
Conc. (mg/L)
0.1
0.05
0
Figure 4.7: Zinc conc. remaining in water samples with water
hyacinth plants over time
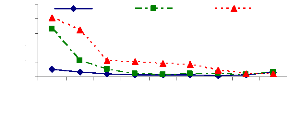
4.3.3 Chromium conc. remaining in water after 4 weeks of
experiment.
Figure 4.8 highlights the capacity of water hyacinth plants in
chromium removal from wastewater. From this figure, it was observed that
chromium was fixed on the outer surface of plant roots, but this fixation was
not effective because of some trace elements of chromium in water samples.
After a certain time, the plant begins to release this metal again in the water
due to the saturation of adsorption sites on root system.
|
Oh
|
1 hr
3 hr
6 hr
|
10 hr 15 hr 21 hr 33 hr 57 hr 105 hr 177
hr
|
273 hr 393 hr 537 hr 705 hr
|
Exposure time (h)
Conc. (mg/L)
0.16
0.14
0.12
0.08
0.06
0.04
0.02
0.1
0
Cr6+,1mg/L Cr6+, 3mg/L Cr6+,6mg/L
Figure 4.8: Chromium conc. remaining in water samples with
water hyacinth plants
4.3.4 Discussions on pH variations and metal removal by
the plants
Metal can precipitate as hydroxides simply by raising the pH
of the wastewater to the range of pH 8 to 11 (Barron et al., 1982). As
a result, the extent of adsorption or absorption was rather low at low pH
values. However, in the equilibrium solid phase, Zn (II) and Cr (VI) ion
concentrations increased with increasing pH because of increasingly negative
charges on the surfaces of the roots at high pH values that attracted
positively charged Zn (II) and Cr (VI) ions more strongly.
The ANOVA showed that for 1 mg/L, there is no effect of
exposure time (P = 0.05) but a
high effect of pH on metal remained in water
samples (P = 0.05). For 3 mg/L, the trend is
the same; no effect of exposure
time (P = 0.05) and high effect of pH effects on metal
remaining (P = 0.05). For 6 mg/L there was no effect of exposure
time (P = 0.05) but high difference between pH effects and metal remaining (P =
0.05).
4.4 Bioconcentration Factor (BCF) for zinc and
chromium
The bioconcentration factor (BCF) is a parameter showing the
ability of plant materials to accumulate metals in tissues. It was seen that
when the concentration of metal increases, water hyacinth plants are not able
to accumulate metal ions. The plants have the limit for metal accumulation in
their tissues.
4.4.1 Bioconcentration Factor for zinc
Bioconcentration factor (BCF) is a useful parameter to
evaluate the potential of the plants in accumulating metals and this value was
calculated according to dry weight basis. Figure 4.9 shows that the
bioconcentration factor of zinc decreases while the metal concentration
increases. This demonstrates that water hyacinth is able to accumulate zinc at
low concentrations, which contributes particularly to plant cells building.
Bioconcentration Factor of Zinc.
initial conc.(mg/L)
conc.in plant BCF
tissues (mg/L)
Variation of Zinc conc.
conc. in mg/L
4
8
6
2
0
1 mg/L
3 mg/L
6 mg/L
Figure 4.9: Bioconcentration factor of Zinc
I.C: Initial conc. in mg/L conc./PT: conc. in plant tissues in
mg/Kg
BCF: bioconcentration factor
4.4.2 Bioconcentration Factor for chromium
Figure 4.10 plotted the bioconcentration factor of chromium
and shows the trend as for zinc. The increase in concentration reduces the
ability of the plant to accumulate more trace elements of metals. The
Bioconcentration factor of chromium appears to be constant, independent to the
initial concentration.
Zinc and chromium removal mechanisms from industrial
wastewater by water hyacinth (Eichhornia crassipes) (Mart.)
Solms-
Laubach
BCF of Cr
10
6
4
2
8
0
I.C Conc./P.T BCF
IC vs Conc. in plant tissues
BCF of Chromium
1 mg/L 3 mg/L 6 mg/L
Figure 4.10: Bioconcentration factor of Chromium
I.C: Initial conc. in mg/L conc./PT: conc. in plant tissues in
mg/kg
BCF: bioconcentration factor
4.4.3 Discussions on bioconcentration factor
In comparing the two metals studied (Zn (II) and Cr (VI)); the
BCF of zinc seems to be higher than the chromium's BCF for 1 and 3 mg/L, but
very low for 6 mg/L for zinc. It was seen that the plant accumulated more low
concentrations than the high ones.
Tables 4.1 and 4.2 show the variations on bioconcentration
factors of zinc and chromium and it is reported that there is no significant
difference both for zinc and chromium when comparing initial concentrations to
the concentrations in plant tissues and bioconcentration factors (P = 0.05) for
zinc and chromium.
|
Table 4.1: variations on bioconcentration factor of
zinc
BCF of Zinc ANOVA
|
|
|
|
|
|
Source of Variation
|
SS
|
df
|
MS
|
F
|
P-value
|
F crit
|
|
Initial concentrations Conc./PT & BCF
Error
Total
|
1.3
0.8
0.4
2.5
|
2
1
2
5
|
0.7
0.8
0.2
|
3.3
3.7
|
0.2
0.2
|
19.0
18.5
|
Table 4.2: variations on bioconcentration factor of
chromium
|
BCF of Chromium ANOVA
|
|
|
|
|
|
|
|
Source of Variation
|
SS
|
df
|
MS
|
F
|
P-value
|
F crit
|
|
initial concentrations Conc./PT & BCF
Error
Total
|
3.5
4.5
3.6
11.6
|
2
1
2
5
|
1.7
4.5
1.8
|
1.0
2.5
|
0.5
0.3
|
19.0
18.5
|
Zinc and chromium removal mechanisms from industrial
wastewater by water hyacinth (Eichhornia crassipes) (Mart.)
Solms-
Laubach
4.5 Bioaccumulation
Metal accumulation in plant and water samples was measured.
Digestion of samples in this study was performed according to the Standard
Methods (APHA/AWWA/WEF, 2005). Plant biomass samples were decomposed to dry
matter by heating at 105°C for 24 hours in a hot air oven.
According to Lin and Zhang (1990), metal accumulations by
macrophytes can be affected by metal concentrations in water and sediments. The
accumulation of metal in plant material is expressed as mg of metal per kg of
dry matter. The data for accumulation of chromium and Zinc are expressed in
different forms such as uptake, translocation ability and adsorption, both for
the top (shoots) and the roots of plants exposed to metal-containing water. The
zinc concentration in both the roots and the shoots tended to increase with
increasing concentration of zinc and also with the passage of time.
4.5.1 Adsorption of Zinc by water hyacinth plants
The adsorption mechanism was performed by using EDTA-Na2 to
remove metals fixed on outer surface of the roots performed the adsorption
mechanism. This mechanism help to understand the ability of water hyacinth
plants to fix metals on the roots.
The adsorption behavior of zinc was assessed by immersing
roots in different volumetric beakers with 100 ml EDTA-Na2 at different periods
of time for desorption. The Figures 4.11, 4.12 and 4.13 shows that the metal
concentration decreases when the passage in time of desorption increases
(Figure 4.13). Except some differences observed in Figures 4.11, and 4.12, the
situation looks to be the same in general. The high concentration adsorbed in 1
week was around 0.036 mg/L (1 mg/L initial concentration), 0.16 mg/L for 2
weeks (3 mg/L) and 0.2 mg/L for 4 weeks (1 mg/L).
conc. in mg/L
0.04
0.03
0.02
0.01
0
5 min
Desorption of Zinc for 1week
10 min
Period of time for removal
15 min
1 mg/L 3mg/L 6 mg/L
20 min
25 min
30 min
35 min
40 min
45 min
Figure 4.11: Desorption of Zinc after 1 week
Desorption of Zinc for 2 weeks
5 min 10 min 15 min 20 min 25 min 30 min 35 min 40 min
45 min
Period of time for removal
conc. in mg/L
0.2
0.15
0.1
0.05
0
1 mg/L 3 mg/L 6mg/L
Figure 4.12: Desorption of Zinc after 2 weeks
Desorption of Zinc for 4 weeks
1 mg/L 3 mg/L 6 mg/L
0.25
0.2
0.15
0.1
0.05
0
conc. in mg/L
45 min
5 min
10 min
15 min
20 min
35 min
30 min
25 min
40 min
Period of time for removal
Figure 4.13: Desorption of Zinc after 4 weeks
4.5.2 Total adsorption of zinc
Figure 4.14 show that the adsorption for the 1 mg/L zinc
initial concentration increased with the exposure time, but higher
concentrations (3 and 6 mg/L) reduce the ability of water hyacinth plants to
adsorb metal. The majority of molecules are adsorbed onto the roots.
|
1 0.8 0.6 0.4 0.2
0
|
Total desorption of Zinc
|
|
1 mg/L
3 mg/L
6 mg/L
|
|
conc. (mg/L)
|
|
|
|
|
1 week 2 weeks 4 weeks
|
|
|
Exposure time (week)
Figure 4.14: Total desorption of Zinc
4.5.3 Adsorption of chromium by water hyacinth plants
The adsorption of chromium presented on Figure 4.15 shows a
decrease in concentration desorbed on external surface of roots according to
time. The capacity of water hyacinth plants to adsorb trace elements of
chromium depend on several factors which can affect this mechanism This means
that more trace elements of chromium was removed in 5 to 15 minutes and the
high concentration observed for 6 mg/L was around 2 mg/L, for 3 mg/L was around
1.6 mg/L and for 1 mg/L was around 0.3 mg/L.
It shows the same situation as for zinc that 5 to 15 minutes
are sufficient to remove the maximum quantity of chromium on roots and the
concentration of trace elements decreases with the passage of time of
desorption.
Period of time for removal (min.)
conc.in
(mg/L)
1 mg/L 3 mg/L 6 mg/L
3
2
2
1
1
0
5 min
15 min
10 min
20 min
35 min
30 min
25 min
40 min
45 min
Figure 4.15: Desorption of Chromium
4.5.4 Discussions on adsorption mechanism
The adsorption ability of water hyacinth plants seems to be
different when zinc and chromium are compared. It was seen that for zinc 17.6%
of 1 mg/L was adsorbed by the water hyacinth plants, 6.1% of 3 mg/L was
adsorbed and the plants adsorbed 1.1% of 6 mg/L. Whereas for chromium, 9.0% of
1 mg/L, 36.4% of 3 mg/L and 54.6% of 6 mg/L were adsorbed on the roots of water
hyacinth plants.
4.6 Uptake mechanism
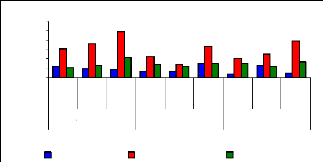
4.6 1 Uptake mechanism for zinc
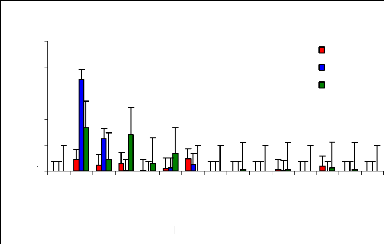
The uptake mechanism was observed to identify which part of
water hyacinth plant contributes much in metal ions accumulation. The variation
of uptake versus metal dosage for zinc are shown in Figure 4.16 and exhibited
linearity at the low level of exposure time (1 week for petioles and leaves);
however, the linearity trend could not be established with confidence for
leaves and roots for 1 and 4 weeks. The regression coefficients for zinc (II)
were found to be 0.6379 for 1 and 3 mg/L, 0.3195 for 3 and 6 mg/L and 0.3660
for 1 and 6 mg/L during all the experimental period. Thus, the uptake process
apparently followed an increasing trend with a linear increase of metal
concentrations in petioles for 1 week and 4 weeks but in 2 weeks, the pattern
of uptake changes. It was observed that petioles are important parts for metal
ions accumulation in water hyacinth plants
exposure time (wk) vs initial conc. (mg/L)
roots petioles leaves
Uptake mechanisms
0,6
0,5
0,4
0,3
0,2
0,1
0
Conc. (mg/Kg)
1 mg/L
1 mg/L
1 mg/L
3mg/L
3mg/L
6mg/L
3mg/L
6mg/L
6mg/L
4 weeks
2 weeks
1 week
Figure 4.16: Variations of uptake for zinc by the
plants
Figure 4.16 depicted the uptake of zinc (II), which shows to
be in normal distribution according to metal concentration, but it exhibits the
changes when exposure time increases. Thus, the present observations showed
that the extent of metals (Zn) uptake by plant was dependent on the
concentration of the metal in the solution as well as the length of exposure to
the plants.
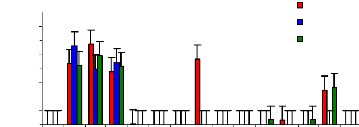
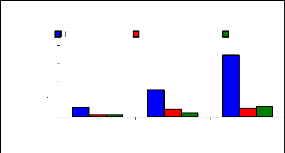
4.6.2 Uptake mechanism for chromium
The figure 4.17 describes the uptake mechanism which
demonstrates the important part of water hyacinth plant in metal accumulation.
As seen from this figure, roots are important parts for chromium accumulation
in the plants. This show a difference with zinc, which was more accumulated in
petioles. This Figure 4.17 continues to show the behavior of chromium in plant
tissues and it is clear that roots are the important parts for the accumulation
of chromium in the water hyacinth plants. When chromium is mixed with zinc in
the same water samples, zinc is more mobile than chromium, so zinc will be
absorbed very quickly than chromium. Petioles come in second position in metal
uptake for 3 mg/L. The uptake is linear according to concentration for roots
and leaves but less for petioles.
dry weight
(mg/kg)
4
2
3
0
1
Uptake mechanism for chromium
roots petioles leaves
1 mg/L 3 mg/L 6 mg/L
Initial conc. (mg/L)
Figure 4.17: Uptake of chromium in plant tissues for
different initial concentrations
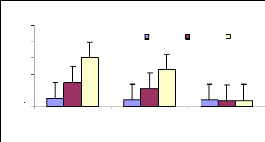
4.6.3 Discussions on uptake mechanism
The discussion on uptake mechanism for zinc was reported that
56.7% of zinc was
accumulated in petioles, 27.0% in leaves and 16.3% in
roots. Table 4.3 indicates that
there is no significant difference
(p<=0.05) according to initial concentration and
exposure time (p<=0.05) in uptake mechanisms of zinc, but a
high difference (p<=0.05) (significant) was observed in plant parts
(p<=0.05) in uptake processes.
Table 4.3: Variability in zinc uptake compared to initial
concentration & exposure time.
|
ANOVA
|
|
|
|
|
|
|
|
Source of Variation
|
SS"
|
dfc
|
MSd
|
Fe
|
P-valuef
|
F crit
|
|
I.Ca & exposure time Plant plants
Error
Total
|
0.05
0.22
0.06
0.33
|
8 2 16
26
|
0.01
0.11
0.00
|
1.68
28.75
|
0.18
0.00
|
2.59
3.63
|
a: initial concentration; b: square sums; c: degree of freedom;
d: means squared; e: Fischer test; f: probability value.
However, for chromium it was observed that 73.7% was taken up
in roots, 14.1% in petioles and 12.2% in leaves. This shows the preference of
the plant to store chromium more in roots than in petioles and leaves. Table
4.4 shows that no significant difference (p<=0.05) existed between plant
parts (p<=0.05) and also between initial concentrations in uptake processes
for chromium (p<=0.05). The inhibition in the uptake was perhaps because of
the competition of both the metals for the same site of the plant during
metabolism processes of the plants.
|
Table 4.4: variability in uptake of chromium ANOVA
|
|
|
|
|
|
|
Source of Variation
|
SS"
|
dfc
|
MSd
|
Fe
|
P-valuef
|
F crit
|
|
plant parts I.Ca.
Error
Total
|
4.57
2.36
2.14
9.07
|
2
2
4
8
|
2.28
1.18
0.53
|
4.27
2.21
|
0.10
0.23
|
6.94
6.94
|
a: initial concentration; b: square sums; c: degree of freedom;
d: means squared; e: Fischer test; f: probability value.
4.7 Translocation Ability (TA)
4.7.1 Variation of translocation ability for
zinc
The translocation ability is a parameter, which shows the
ability of the aquatic macrophytes to take up the trace elements in the top
part of plants (leaves, petioles and flowers). Most times, the translocation
ability of roots/leaves seems to be high when compared to roots/petioles, the
reason is that more trace elements were accumulated in
petioles. When concentration accumulated in roots compared to one
accumulated in leaves is high than roots concentration compared to petioles
concentration.
Figure 4.18 shows that the high translocation ability for 1
mg/L was observed for roots/leaves during 1 week, for 3 mg/L for 4 weeks
(roots/leaves) and for 6 mg/L was observed for 2 weeks for roots/leaves, this
can be explain by a little concentration of metal accumulated in leaves during
plants' exposure to zinc.
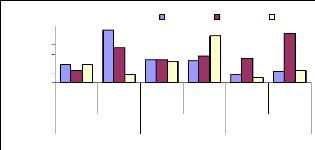
1.0
0.8
0.6
0.4
values
0.2
0.0
1 week
2 w eeks
4 w eeks
1.2
|
roots vs
|
roots vs
|
roots vs
|
roots vs
|
roots vs
|
roots vs
|
|
petioles
|
leaves
|
petioles
|
leaves
|
petioles
|
leaves
|
Time (week) vs TA
1 mg/L 3 mg/L 6 mg/L
Figure 4.18: Translocation ability for Zinc by water hyacinth
plants
The Figures 4.19, 4.20 and 4.21 show the correlations between
the translocation ability, the metal concentrations and the exposure time of
plants to zinc. This behavior indicates positive or negative correlation
between the above parameters. It was shown that there is no correlation for 1
week between translocation ability and metal concentrations. For 2 weeks, a
negative correlation was found (R square = 0.89) and for 4 weeks, a high
positive correlation (R square = 0.97) was observed. This can be explaining by
the key role of exposure time versus metal translocation ability by the
plants.
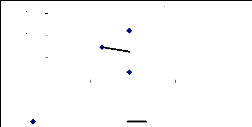
1.5
y = -0.7505x + 0.9256
R2 = 0.0133
0.5
0.0
0.0 0.2 0.4 0.6
zinc concentration (mg/L)
roots vs leaves Linear (roots vs leaves)
1.0
TA
Figure 4.19: Translocation ability for 1 week
39
R. J. GAKWAVU (2007) MSc Thesis
TA
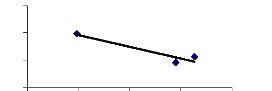
y = -10.817x + 5.7303
R2 = 0.8929
1.5
1.0
0.5
0.0
0.42 0.44 0.46 0.48 0.50
Zn conc. (mg/L)
roots vs leaves Linear (roots vs leaves)

Figure 4.20: Translocation ability for 2 weeks
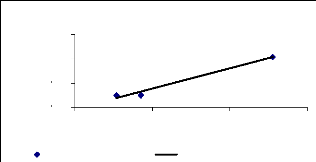
y = 2.0929x - 0.0386
R2 = 0.9752
0.0 0.2 0.4 0.6
Zn conc. (mg/L)
roots vs leaves Linear (roots vs leaves)
1.5
TA
0.5
0.0
1.0
Figure 4.21: Translocation ability for 4 weeks
As shown on the above figures, the positive correlation
between translocation ability and zinc concentration increase progressively
when the exposure time increases, according to the regression coefficients
observed.
4.7.2. Variation of translocation ability for
chromium
Figure 4.22 presents the translocation ability of chromium;
which is too high when compared to zinc translocation ability. It is explained
by the fact more concentration of chromium was in roots, because the
translocation ability is to analyze the capacity of plant parts storage.
Translocatioon ability of chromium
1 mg/L 3 mg/L 6 mg/L
Initial concentration
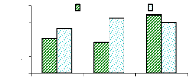
8
6
4
2
0
Translocation
ability
roots/petioles roots/leaves
Figure 4.22: Comparison of roots and shoots in translocation
ability
It seems that the translocation ability of chromium is too
high as shown in Table 4.5 compared to the zinc's translocation ability. The
ability of plants to translocate trace elements of chromium is increased for
roots/leaves (5.3 times for 1 mg/L, 6.5 times for 3 mg/L and 6 times for 6
mg/L). The number of times for roots/petioles decreases (4 times for 1 mg/L, 4
times for 3 mg/L and 7 times for 6 mg/L) because the order of storage was
leaves<petioles<roots.
Table 4.5: Translocation ability of chromium by the
plant
|
I.Ca of chromium (VI)
|
|
Roots/shoots
|
1 mg/L
|
3 mg/L
|
6 mg/L
|
|
roots/petioles roots/leaves
|
4.104b
5.288b
|
3.663b
6.487b
|
6.831b
5.965b
|
a: initial concentration; b: times of storage in roots compared
to shoots.
The Figure 4.23 reports that the correlation between roots and
petioles is high (R square = 0.6) compared to the correlation between roots and
leaves (R square = 0.3), this is because less quantity of Cr (VI) was
translocated in leaves.
correlation between roots and shoots
8 y = 1.3635x + 2.139
R2 = 0.6314
6
4
y = 0.3385x + 5.2363
R2 = 0.317
0
0 1 2 3 4
conc. (mg/L)
roots/petioles roots/leaves
Linear (roots/petioles) Linear (roots/leaves)
x times roots/shoots
2


Figure 4.23: Correlation of roots vs. shoots
4.7.3 Discussions on translocation ability
Table 4.6 indicates the ANOVA 2 which shows the variability in
translocation ability for zinc. It can be seen that the difference is not
significant (p<=0.05) between metal concentration (p<=0.05) and no
significant difference (p<=0.05) between roots and shoots translocation.
|
Table 4.6: variations in translocation ability of zinc
ANOVA
|
|
|
|
|
|
Source of Variation
|
SS
|
df
|
MS
|
F
|
P-value
|
F crit
|
|
metal concentration roots/shoots
Error
Total
|
0,42 0,13 1,01 1,56
|
5 2 1 0 17
|
0 , 08
0,07
0,10
|
0,84
0,65
|
0,55
0,54
|
3,33
4,10
|
Stratford et al. (1984) found that the metals
accumulations in water hyacinth increased linearly with the solution
concentration in the order of
leaves<petioles<roots in water hyacinth. For this research,
the situation is different because the following order was observed:
leaves<roots<petioles. When the concentration
is high, the water hyacinth plant can accumulate little concentration in plant
cells. The high translocation ability was observed for roots/leaves
(1.114) for 1 week and the low translocation ability was
observed for roots/petioles (0.109) for 4 weeks. Most of
times, the translocation ability of roots/leaves seems to be high when compared
to roots/petioles. The reason is that more trace elements were accumulated in
petioles. When concentration accumulated in roots compared to one accumulated
in leaves is high than roots concentration compared to petioles
concentration.
Stratford et al. (1984) found that the metals
accumulations in water hyacinth increased linearly with the solution
concentration in the order of
leaves<petioles<roots in water hyacinth. This
agrees with the results of this study in the case of chromium concentration
accumulation in water hyacinth plants, where the high concentration was
accumulated in roots followed by petioles and then leaves.
5. CONCLUSIONS AND RECOMMENDATIONS
5.1 Conclusions
The removal mechanisms of zinc and chromium by water hyacinth
plants showed that the plant concentrated a high amount of metals. The aquatic
plant water hyacinth have shown promising potential for the removal of Cr (VI)
and Zn (II) from industrial synthetic wastewater of three different
concentrations (1, 3 and 6 mg / L).
Zn (II) was much more mobile than Cr (VI) due to their sizes
and charges. The accumulation of metals in the roots and shoots of water
hyacinth has been shown in laboratory experiments in which water hyacinth was
used as a biological adsorbent. It was recoded that Zn (II) was more
accumulated (leaves<roots<petioles) in petioles whereas Cr (VI) was more
accumulated in roots (leaves<petioles<roots). This phenomenon can explain
by the mobility of Zn (II) when compare to Cr (VI) and also Zn (II) at low
concentration contributes to the plants cells building.
It was observed the Bioconcentration factor decreases while
the Zn (II) and Cr (VI) concentrations increase. This expresses that aquatic
macrophytes water hyacinths are able to accumulate Zn (II) at low concentration
and which contributes particularly to plant cells building. The
bioconcentration factor of Cr (VI) shows the same trend as for Zn (II) that the
increasing in concentration reduces the ability of the plant to accumulate more
trace elements of Cr (VI) and looks to be stagnant independently to the initial
concentration.
The translocation ability of aquatic macrophytes water
hyacinth plants look to be high for Zn (II) in petioles whereas is high in
roots for Cr (VI) due to size of elements and their respective charges.
5.2 Recommendations
Further research is necessary to establish a practical scale
demonstration system. The information from the laboratory pilot scale research
should also be used to establish a best practice environment for integrated
wastewater treatment by aquatic plants and to study also the effects of
decrease in pH after 48 h on metal removal as the solution becomes more acidic
and a release of trace metals can be expected;
The experiments conducted in this research were carried out
using a laboratory synthetic wastewater. It is important to repeat the
experiments with a real industrial wastewater on field and to assess the
treatment performance.
Further experiments with other heavy metals and other aquatic
macrophytes could be more benefits to optimize the mechanisms involved in heavy
metals by aquatic macrophytes.
A combination of different types of macrophytes plants could
be useful in order to increase the contact between the polluted water and the
bioadsorbent for metal fixation.
References
Alick B. M., 2002. The potential use of Cyperus
papyrus constructed wetlands for the treatment of mine water containing
Zinc and Lead, MSc. Thesis, IHE Delft The Netherlands 214, 79-85.
Allen, L.H., Sinclair, T.R., Bennett, J.M., 1997.
Evapotranspiration of vegetation of Florida: perpetuated misconceptions versus
mechanistic processes. In: Proceedings of the Soil and Crop Science Society of
Florida, vol. 56. pp. 1-10.
Alloway, B. J., 1990. Soil processes and the behaviour of metals,
in Alloway, B. J. (Ed). Heavy metals in soils, Blackie and Son Ltd, London
pp.7-28.
APHA/AWWA/WEF, 2005, Standard methods for the examination of
water and wastewater, APHA, 21st edition, Washington, DC. 2001-3710.
Arisz, W. H., 1961. Symplasm theory of salt uptake into and
transports in parenchymatic
tissues. In : Recent Advances in Botany, vol 11, pp
1125-28. University of Toronto. Babu M., 2001. Potential removal of Zinc by
Cyperus papyrus from an Artificial Wetland,
MSc. Thesis, IHE Delft The Netherlands
Babu, R.M., Sajeena, A., Seetharaman, K., 2003. Bioassay of
the potentiality of Alternaria alternate (Fr.) keissler as a bioherbicide to
control water hyacinth and other aquatic weeds. Crop Protection 22,
1005-1013.
Baker, A. J. M., Walker, P. L. 1990. Ecophysiology of metal
uptake by tolerant plants, heavy metal tolerance in Plants. In: Shaw AJ.
Evolutionary Aspects. CRC Press, Boca Raton. 155-177.
Barron, L., Weand, Judkins, J., F.,and Benefield, L., D., 1982.
Process chemistry for
water and wastewater treatment, Prentice-hall international, Inc,
London.
Center, T.D., Hill, M.P., Cordo, H., Julien, M.H., 2002.
Waterhyacinth. In: Van Driesche,
R., Biological Control of Invasive Plants in the Eastern United
States. USDA Forest
Service Publication FHTET-2002-04, 41-64.
Chang, L.W., 1996. Toxicology of Metals, CRC Press, Boca Raton,
FL.
Chua, H., 1998: Bio-accumulation of environmental residues of
rare earth elements in aquatic flora Eichhornia crassipes (Mart.)
Solms. in Guangdong Province of China. The Science of Total environment.
Denny, P., 1980. Solute movement in submerged angiosperms.
Biol Rev 55, 65-92. Denny, P., 1987. Mineral cycling by wetland plants
- a review.Arch Hydrobiol 27, 27,1- 25.
Denny, P., Roland, B., Eldad, T., and Paul, M., 1995. Heavy
metal contamination of Lake George (Uganda) and its wetlands. Hydrobiologia
297, 229-239
Espinoza-Quinones, F. R., Zacarkim, C. E., Palacio,
S. M., Obreg'on, C. L., Zenatti, D. C., Galante, R. M., Rossi, N., Rossi, F.
L., Pereira, I. R. A., Welter, R. A., 2005. Removal of Heavy Metal from
Polluted River Water Using Aquatic Macrophytes Salvinia sp. N'ucleo de
Biotecnologia e Desenvolvimento de Processos Qu'ýmicos - NBQ,
Universidade Estadual do Oeste do Paran - UNIOESTE/Campus de Toledo, PR,
Brazil.
Grodowitz, M.J., Center, T.D., Freedman, J.E., 1997. A
Physiological Age-Grading System for Neochetina eichhorniae (Warner)
(Coleoptera: Curcuionidae), a Biological Control Agent of
Water Hyacinth, Eichhornia crassipes (Mart.) Solms. Biological Control
9, 89-105.
Hasan, S.H., Talat, M., Rai S., 2006. Sorption of cadmium and
zinc from aqueous solutions by water hyacinth (Eichchornia crassipes) Elsevier,
Bioresource Technology 98 (2007) 918-928
Jayaweera, M. W., Kasturiarachchi, J. C., Kularatne, R. K. A.
and Wijeyekoon, S. L. J., 2007. Removal of Aluminium by constructed wetlands
with water hyacinth grown under different nutritional conditions, Department of
chemical and process engineering, University of Moratuwa, Sri Lanka.
Julien, M.H., Orapa, W., 1999. Successful biological control
of water hyacinth (Eichhornia crassipes) in Papua New Guinea by the
weevils Neochetina bruchi and Neochetina eichhorniae (Coleoptera:
Curcuionidae). In: N.R., Spencer (ed.), Proceedings of the X International
Symposium on Biological Control of Weeds, Montana State University, Bozeman,
Montana, USA, p. 1027.
Kabata-Pendias, A, Pendias, H., 1989. Trace Elements in the Soil
and Plants. Florida: CRC Press.
Kara, Y., 2005. Bioaccumulation of Cu, Zn and Ni from wastewater
by treated Nasturtium officinale. Department of Biology, Faculty of science and
Art.
Keith, C., Borazjani, H., S. Diehl, V., Su2, Y., and Baldwin,
B.S., 2006. Removal of Copper, Chromium, and Arsenic by Water Hyacinths, Forest
Products Department, Forest and Wildlife Research Center, Mississippi State
University, MS.
Lasat, M., M., 2000. Phytoextraction of metals from
contaminated soil: a review of plant/soil/metal interaction and assessment of
pertinent agronomic issues. J Hazar Subs Res 2, 1-23.
Lehmann, M., Zouboulis, A.I. Matis, K.A., 1999. Removal of
metal ions from dilute aqueous solutions: a comparative study of inorganic
sorbent materials, Chemosphere 39. 881-892.
Lesage, E., 2006. Behaviour of heavy metals in constructed
treatment wetlands. PhD thesis. Faculty of Bioscience Engineering, Ghent
University, Ghent, Belgium, 247 pp.
Lin YX and Zhang Xm., 1990. Accumulation of heavy metals and the
variation of amino acids and protein in Eichhornia crassipes (Mart.)
solms in the Dianchi lake. Oceanol Limnol Sinica 21 21, 179-84 (In
Chinese).
Lindsey K., Hirt H.M., 1999. Use Water Hyacinth! A Practical
Hanbook of uses for the Water Hyacinth from Across the World. Anamed:
Winnenden, 114.
Liu J., Dong Y., Xu H., Wang D., Xu J., 2007. Accumulation of
Cd, Pb and Zn by 19 wetland plant species in constructed wetland, Elsevier,
Journal of Hazardous Materials 147 (2007) 947-953
Lubberding, H., Patrick, D., Gijzen, H., 1999. Removal of
heavy metal by macrophytes in wetland and stabilization ponds. COST 837,
Lausanne, Working group 2.
Lubberding, H., Barbiker, F., Kitimbo, P., Gijzen, H., 2000.
Potential removal of heavy metals from wetlands and stabilization ponds by two
aquatic macrophytes. COST 837, Parma, Working group 2
Lubberding, H., Martine, L., Patrick, D., Gijzen, H., 2001.
Zinc removal by the macrophytes Pistia stratiotes. COST 837, Madrid, Working
group 2-toxic metal: 33.
Maine MA, Duarte MV and Sune NL . 2001. Cadmium uptake by
floating macrophytes.
Wat Res 35(11) 11), 2629-34.
Maine, M.A., Sune, N.L., Panigatti, M.C., Pizarro, M.J.,1999.
Relationships between water chemistry and macrophyte chemistry in lotic and
lentic environment. Arch. Hydrobiol. 145 (2), 129-145.
Marschner, H., 1986. Mineral nutrition in higher plants. Academic
Press, London.
Matagi, S.V., Swai, D. and Mugabe, R., 1998. A review of heavy
metal removal mechanisms in wetlands. Afr J Trop Hydrobiol 8,
8,23-5.
Meggo, R., 2001. Allocation pattern of Lead and Zinc in
Cyperus papyrus and Lemna gibba. Msc Thesis DEW 147 DELFT
IHE, Netherlands pp44.
Memon A. R., 2000. Heavy Metal Accumulation and Detoxification
Mechanisms in Plants, Marmara Research Center, Institute for Genetic
Engineering and Biotechnology.
Mullen, M.D., Wolf, D.C., Ferris, F.G., Beveridge, T.J.,
Flemming, C.A., Bailey, G.W.,
1989. Bacterial sorption of heavy metals, Appl. Environ.
Microbiol. 55-3143-3149. Mungur, A.S., Shutes, R.B.E., Revit, D.M. and House,
M.A., 1997. An assessment of
metal removal by a laboratory scale wetland. Wat. Sci. Tech.
Vol. 35, 125-133
National Geographic - Television & Film, 2004. Strange
Days on Planet Earth, First
Episode: Invaders.
Nevena N., Ljubinko J. Potential Use of Water Hyacinth
(E. CRASSIPENS) for
Wastewater Treatment in Serbia 1Institute of Forestry, 2
Center for
multidisciplinary studies, University of Belgrade Belgrade,
Serbia and Montenegro. Nkuranga, E., 2007. Heavy metal removal and
accumulation by an Urban Natural
Wetland: the Nyabugogo Swamp, Rwanda. MSc Thesis ES 07.19,
Delft,
UNESCO-IHE, Netharlands, pp73
Nriogo, J. O., 1979. Global inventory of natural and
anthropogenic emissions of trace metals to the atmosphere. Nature 279:
409-411.
Obarska, H. and Pempkowiak, 2001. Retention of selected heavy
metals: Cd, Cu, Pb in a hybrid wetland system. Wat. Sci. Tech. Vol. 44 (11-12),
463-468
Kelderman, P., 2000. Uptake and adsorption of Lead, Copper and
Zinc by Lemna gibba, MSc. Thesis, IHE Delft The Netherlands.
Prasad M.N.V. and Freitas H.M.O., 2003. Metal
hyperaccumulation in plants - Biodiversity prospecting for phytoremediation
technology. Electronic Journal of Biotech. Vol. 6 (3).
Rai, U. N., Sinha S., Tripathi R. D., Chandra P., 1995.
Wastewater treatability potential
of some aquatic macrophytes: removal of heavy metals. Ecol.
Engin., 5: 5-12.
Samecka-Cymermann A. and Kempers, A. J., 1996.
Ecotoxicology and Environmental
Safety 35, 242.
Sarabjeet S. A. and Dinesh G., 2005. Microbial and plant
derived biomass for removal of heavy metals from wastewater, Elsevier,
Bioresource Technology 98 (2007) 2243-2257
So, L.M., Chu, L.M., Wong, P.K., 2003. Microbial enhancement of
Cu2+ removal
capacity of Eichhornia crassipes (Mart.). Chemosphere 52,
1499-1503.
Srivastov, R. K., Gupta S. K., K. D. P. Nýgam.,
Vasudevan P.,1994. Treatment of chromium and nickel in wastewater by using
aquatic plants. Water Resources, 28 (7): 1631-1638.
Stephenson, M., G. Turner, P. Pope, J. Colt, A. Knight, and
Tchobanoglous, G., 1980. The Use and Potential of Aquatic Species for
Wastewater Treatment. Publication No. 65, California State Water Resources
Control Board.
Stratford HK, William TH and Leon A., 1984. Effects of heavy
metals on water hyacinths (Eichhornia crassipes). Aquat Toxicol
5(2), 117-28.
Vesk, P.A., Nockolds, C. E., and Allaway W. G., 2006. Metal
localization in water hyacinth roots from an urban wetland, plant, Cell and
Environment (1999)22, 149- 158. School of biological sciences, Australia.
Volesky, B., 2001. Detoxification of metal-bearing effluents:
biosorption for the next century, Hydrometallurgy 59 203-216.
Volesky, B., Holan, Z.R., 1995. Biosorption of heavy metals,
Biotechnol. Prog. 11-235- 250.
Wilson, J.R., Holst, N., Rees, M., 2005. Determinants and
patterns of population growth in water hyacinth. Aquatic Botany 81, 51-67.
Xiaomei L., Maleeya K. Prayad P. and Kunaporn H. 2004. Removal
of Cadmium and Zinc by Water Hyacinth, Eichhornia crassipes, Department of
Biology, Faculty of Life Science, Hubei University, Wuhan 430062, P. R.
China.
Young, S., K., Lee, J., U., Kim, K., W., 2006. Biosorption of
Cr(III) and Cr(IV) onto the cell surface of Pseudomonas aeruginosa, Department
of Environmental Science and Engineering, Gwangju Institute of Science and
Technology (GIST), Gwangju 500-712, South Korea. Biochemical Engineering
Journal 36 54-58.
Zayed, A., Gowthaman S., Terry N., 1998. Phytoaccumulation of
trace elements by wetland plants: I. Duck weed. J. Environ. Qual., 27:
715-721.
Zhihong, Y., Alan, J. M. B., Ming-Hung, W. and Arthur, J. W.,
1998. Zinc, lead and cadmium accumulation and tolerance in Typha
latifolia as affected by iron plaque on the root surface. Aquatic botany
61, 55-67
Zhu Y.L, Qian, J. H., Zayed A., Yu M., Terry N., 1999.
Phytoaccumulation of trace elements by wetland plants III. Uptake and
accumulation often trace elements by twelve plant species. J. Environ. Qual.,
28 (5): 1448-1455.
Zhu, Y. L., A. M. Zayed J. H. Qian M. De Soltan M. E., Rashed
M. N., 2003. Laboratory study on the survival of water hyacinth under several
conditions of heavy metal concentrations. Advan. Environ. Res., 7: 321- 334.
Appendices
Appendix I: Initial fresh weight and final fresh weight
vs relative growth
|
Exposure time
|
Initial water
|
Final water
|
Relative growth
|
|
(week) with Zn & Cr
|
hyacinth fresh
|
hyacinth fresh
|
|
|
concentrations
|
weight (g)
|
weight (g)
|
|
|
1 wk, 1 mg/L
|
32.33
|
96.91
|
3.00
|
|
1 wk, 3 mg/L
|
34.50
|
85.23
|
2.47
|
|
1 wk, 6 mg/L
|
26.38
|
50.07
|
1.90
|
|
2 wks, 1 mg/L
|
19.23
|
39.96
|
2.08
|
|
2 wks, 3 mg/L
|
29.75
|
55.92
|
1.88
|
|
2 wks, 6 mg/L
|
42.90
|
80.18
|
1.87
|
|
4 wks, 1 mg/L
|
41.15
|
90.17
|
2.19
|
|
4 wks, 3 mg/L
|
43.21
|
93.05
|
2.15
|
|
4 wks, 6 mg/L
|
45.09
|
96.16
|
2.13
|
Appendix II: pH, zinc and chromium concentrations
remaining in blank samples during 4 weeks of experiment
|
Time (hr)
|
pH
|
Blank,1mg/L Zn2+ Cr6+
|
Blank, 3mg/L pH Zn2+
|
Cr6+
|
pH
|
Blank, 6mg/L Zn2+ Cr6+
|
|
start
|
6.70
|
1.000
|
1.000
|
6.70
|
3.000
|
3.000
|
6.70
|
6.000
|
6.000
|
|
1 hr
|
7.07
|
0.062
|
0.006
|
7.04
|
0.068
|
0.080
|
7.11
|
0.070
|
0.118
|
|
3 hr
|
7.24
|
0.062
|
0.084
|
7.16
|
0.158
|
0.107
|
7.20
|
0.058
|
0.081
|
|
6 hr
|
7.23
|
0.050
|
0.108
|
7.17
|
0.022
|
0.090
|
7.21
|
0.019
|
0.077
|
|
10 hr
|
7.29
|
0.032
|
0.074
|
7.23
|
0.065
|
0.039
|
7.29
|
0.018
|
0.029
|
|
15 hr
|
7.45
|
0.008
|
0.000
|
7.35
|
0.000
|
0.000
|
7.46
|
0.030
|
0.000
|
|
21 hr
|
7.49
|
0.000
|
0.000
|
7.43
|
0.000
|
0.000
|
7.50
|
0.024
|
0.000
|
|
33 hr
|
7.82
|
0.021
|
0.000
|
7.68
|
0.007
|
0.000
|
7.82
|
0.000
|
0.000
|
|
57 hr
|
7.90
|
0.004
|
0.000
|
7.72
|
0.040
|
0.000
|
7.89
|
0.000
|
0.000
|
|
105 hr
|
7.64
|
0.016
|
0.000
|
7.86
|
0.000
|
0.000
|
7.65
|
0.004
|
0.000
|
|
177 hr
|
8.03
|
0.014
|
0.000
|
7.93
|
0.006
|
0.000
|
7.72
|
0.024
|
0.000
|
|
273 hr
|
6.6
|
0.005
|
0.012
|
7.37
|
0.015
|
0.079
|
7.60
|
0.032
|
0.021
|
|
393 hr
|
8.01
|
0.023
|
0.000
|
8.14
|
0.008
|
0.000
|
7.75
|
0.011
|
0.000
|
|
537 hr
|
7.12
|
0.000
|
0.016
|
7.73
|
0.000
|
0.061
|
7.25
|
0.000
|
0.001
|
|
705 hr
|
8.61
|
0.000
|
0.012
|
8.37
|
0.000
|
0.000
|
7.5
|
0.000
|
0.000
|
|
total
|
|
0.297
|
0.312
|
|
0.389
|
0.456
|
|
0.290
|
0.327
|
Appendix III: Variations in pH, zinc and chromium
concentrations after 4 weeks of experiment with water hyacinth
plants.

Time (h)
1 mg/L
Initial concentrations
3 mg/L
6 mg/L
pH Zn2+ Cr6+
pH Zn2+ Cr6+
pH Zn2+ Cr6+
start
6,70 1.000 1.000
6,70 3.000 3.000
6,70 6.000 6.000
1 hr
6,90 0,022 0,087
7,01 0,176 0,112
6,96 0,084 0,085
3 hr
7,07 0,012 0,115
7,13 0,062 0,080
7,09 0,023 0,098
6 hr
7,13 0,015 0,076
7,17 0,002 0,088
7,11 0,071 0,083
10 hr
7,23 0,002 0,001
7,42 0,000 0,000
7,34 0,014 0,000
15 hr
7,33 0,005 0,000
7,55 0,006 0,000
7,45 0,034 0,000
21 hr
7,46 0,024 0,000
7,61 0,013 0,000
7,52 0,000 0,000
33 hr
7,49 0,000 0,093
7,51 0,000 0,000
7,34 0,000 0,000
57 hr
7,48 0,000 0,000
7,53 0,000 0,000
7,34 0,004 0,000
105 hr
7,57 0,000 0,000
7,75 0,000 0,000
7,51 0,000 0,000
177 hr
7,19 0,003 0,000
7,58 0,001 0,000
6,97 0,004 0,007
273 hr
6,15 0,000 0,006
7,58 0,000 0,000
6,88 0,000 0,000
393 hr
6,61 0,009 0,000
7,6 0,000 0,000
5,67 0,006 0,007
537 hr
5,31 0,000 0,049
7,35 0,000 0,000
4,47 0,004 0,053
705 hr
4,93 0,000 0,000
7,27 0,000 0,000
4,43 0,000 0,000
total
0,092 0,427
0,26 0,28
0,244 0,333
Appendix IV: Adsorption variability of zinc during
experimental period.
|
|
Zn2+, 1 week
|
|
Zn2+, 2 weeks
|
|
Zn2+, 4 weeks
|
|
|
Time for
desorption
|
1 mg/L
|
3mg/L
|
6 mg/L
|
1 mg/L 3 mg/L
|
6mg/L
|
1 mg/L 3 mg/L
|
6 mg/L
|
|
5 min
|
0.036
|
0.026
|
0.016
|
0.046
|
0.051
|
0.079
|
0.110
|
0.134
|
0.018
|
|
10 min
|
0.023
|
0.034
|
0.006
|
0.021
|
0.156
|
0.049
|
0.203
|
0.083
|
0.038
|
|
15 min
|
0.011
|
0.026
|
0.005
|
0.024
|
0.051
|
0.059
|
0.055
|
0.077
|
0.029
|
|
20 min
|
0.017
|
0.020
|
0.004
|
0.045
|
0.020
|
0.053
|
0.046
|
0.077
|
0.012
|
|
25 min
|
0.016
|
0.014
|
0.007
|
0.027
|
0.038
|
0.064
|
0.068
|
0.034
|
0.049
|
|
30 min
|
0.014
|
0.019
|
0.014
|
0.015
|
0.030
|
0.030
|
0.026
|
0.049
|
0.024
|
|
35 min
|
0.020
|
0.012
|
0.005
|
0.017
|
0.039
|
0.034
|
0.032
|
0.034
|
0.014
|
|
40 min
|
0.029
|
0.011
|
0.006
|
0.016
|
0.130
|
0.017
|
0.042
|
0.039
|
0.014
|
|
45 min
|
0.010
|
0.020
|
0.004
|
0.008
|
0.110
|
0.099
|
0.030
|
0.038
|
0.019
|
|
Total
|
0.176
|
0.182
|
0.067
|
0.219
|
0.625
|
0.484
|
0.612
|
0.565
|
0.217
|
Zinc and chromium removal mechanisms from industrial
wastewater by water hyacinth (Eichhornia crassipes) (Mart.)
Solms-
Laubach
Appendix V: Adsorption variability of chromium during
experimental period
|
Time
|
1mg/L
|
3 mg/L
|
6 mg/L
|
|
5 min
|
0.035
|
0.147
|
0.403
|
|
10 min
|
0.035
|
0.152
|
0.208
|
|
15 min
|
0.035
|
0.138
|
0.156
|
|
20 min
|
0.018
|
0.105
|
0.115
|
|
25 min
|
0.034
|
0.171
|
0.153
|
|
30 min
|
0.016
|
0.105
|
0.147
|
|
35 min
|
0.034
|
0.123
|
0.210
|
|
40 min
|
0.033
|
0.082
|
0.135
|
|
45 min
|
0.034
|
0.080
|
0.130
|
|
total
|
0.274
|
1.103
|
1.657
|
Appendix VI: Variation of uptake mechanism of
zinc.
|
Time
|
I.C.a
|
Roots
|
Petioles
|
Leaves
|
Total
|
|
1mg/L
|
0.117b
|
0.306b
|
0.105b
|
0.528b
|
|
1 week
|
3mg/L
|
0.093b
|
0.364b
|
0.127b
|
0.584b
|
|
6mg/L
|
0.080b
|
0.487b
|
0.209b
|
0.776b
|
|
Total
|
0.290b
|
1.157b
|
0.441b
|
|
|
1mg/L
|
0.065b
|
0.218b
|
0.141b
|
0.424b
|
|
2 weeks
|
3mg/L
|
0.066b
|
0.136b
|
0.117b
|
0.319b
|
|
6mg/L
|
0.145b
|
0.330b
|
0.146b
|
0.621b
|
|
Total
|
0.276b
|
0.684b
|
0.404b
|
|
|
1mg/L
|
0.035b
|
0.205b
|
0.145b
|
0.385b
|
|
4 weeks
|
3mg/L
|
0.128b
|
0.251b
|
0.123b
|
0.502b
|
|
6mg/L
|
0.042b
|
0.386b
|
0.165b
|
0.593b
|
|
Total
|
0.205b
|
0.842b
|
0.433b
|
|
a: I.C.: Initial Concentration in water samples; b: dry weight in
mg/kg
Appendix VII: variation of uptake mechanism of
chromium
|
I.Ca
|
1 mg/L
|
3 mg/L
|
6 mg/L
|
total
|
|
roots
|
0.550b
|
1.531b
|
3.436b
|
5.517b
|
|
petioles
|
0.134b
|
0.418b
|
0.503b
|
1.055b
|
|
leaves
|
0.104b
|
0.236b
|
0.576b
|
0.916b
|
|
total
|
0.788b
|
2.185b
|
4.515b
|
|
a: Initial concentration in water samples; b: dry weight in
mg/kg
Appendix VIII: Translocation ability of zinc by water
hyacinth.
|
Roots/ Shoots
|
1 mg/L
|
Zn (II) conc.
3 mg/L 6 mg/L
|
|
1 week
|
Roots/petioles
|
0.382a
|
0.255a
|
0.383a
|
|
Roots/leaves
|
1.114a
|
0.732a
|
0.164a
|
|
2 weeks
|
Roots/petioles
|
0.478a
|
0.485a
|
0.439a
|
|
Roots/leaves
|
0.461a
|
0.564a
|
0.993a
|
|
4 weeks
|
Roots/petioles
|
0.171a
|
0.510a
|
0.109a
|
|
Roots/leaves
|
0.241a
|
1.041a
|
0.255a
|
a: times of zinc storage in roots compared to shoots.
Appendix IX: variations between initial concentrations
and plant relative growth
a) Variations for 1 week of experiment
|
ANOVA
|
|
|
|
|
|
|
|
Source of Variation
|
SS
|
df
|
MS
|
F
|
P-value
|
F crit
|
|
I.C.(1, 3 & 6 mg/L) IFW, FFW and RG Error
Total
|
547.5
8582.8
677.3
9807.6
|
2
2
4
8
|
273.8
4291.4
169.3
|
7.5
25.3
|
0.3
0.0
|
6.9
6.9
|
b) Variations for 2 weeks of experiment
ANOVA
|
|
|
|
|
|
Source of Variation
|
SS
|
df
|
MS
|
F
|
P-value
|
F crit
|
I.C (1, 3 and 6 mg/L) IFW, FFW and RG Error
Total
|
682.7
4830.1
418.9
5931.7
|
2
2
4
8
|
341.4
2415.0
104.7
|
3.3
23.1
|
0.1
0.0
|
6.9
6.9
|
|
c) Variations for 4 weeks of experiment
ANOVA
|
|
|
|
|
|
Source of Variation
|
SS
|
df
|
MS
|
F
|
P-value
|
F crit
|
|
I.C.(1, 3 and 6 mg/L)
IFW, FFW & RG
Error
Total
|
16.2
12453.0
9.5
12478.7
|
2
2
4
8
|
8.1
6226.5
2.4
|
3.4
2628.1
|
0.1
0.0
|
6.9
6.9
|
Appendix X: Variations between exposure time, pH effects
and metal remained in water samples.
a) Concentration of 1 mg/L
|
ANOVA
|
|
|
|
|
|
|
|
Source of Variation
|
SS
|
df
|
MS
|
F
|
P-value
|
F crit
|
|
Exposure time pH & metal
remained
Error
Total
|
3.03
465.04
5.94
474.01
|
14
2
28
44
|
0.22
232.52
0.21
|
1.02
1096.78
|
0.46
0.00
|
2.06
3.34
|
b) Concentration of 3 mg/L
ANOVA
|
|
|
|
|
|
Source of Variation SS
|
df
|
MS
|
F
|
P-value
|
F crit
|
Exposure time 0.29
pH & metal
remained 542.58
|
14
2
|
0.02
271.29
|
0.68
8780.55
|
0.77
0.00
|
2.06
3.34
|
Error 0.87
|
28
|
0.03
|
|
|
|
Total 543.74
|
44
|
|
|
|
|
c) Concentration of 6 mg/L
|
|
|
|
|
|
|
|
ANOVA
|
|
|
|
|
|
|
Source of Variation SS
|
df
|
MS
|
F
|
P-value
|
F crit
|
|
Exposure time 4.98
pH & metal
remained 448.82
|
14
2
|
0.36
224.41
|
1.01
638.11
|
0.47
0.00
|
2.06
3.34
|
|
Error 9.85
|
28
|
0.35
|
|
|
|
|
Total 463.65
|
44
|
|
|
|
|
Appendix XI: Preliminary water tests at the
beginning
pH test for used waters:
Buutare valley pH= 7.7 Nyabugogo water pH=7.4
nyabugogo + butare valley pH=7.9 (in small buskets)
nyabugogo + butare valley pH=7.6 (in the big basins)
solution of K2Cr2O7 pH = 7.2 solution of ZnCl2 pH =
6.4
fixed pH : 6.7 at starting in all small plastic buckets
Appendix XII: Raw data from lab experiments
Lab experiments (observation and analyses
|
No
|
date of sampling
|
Period
|
Sample no
|
pH sample
|
Zn (II)
|
Cr (VI)
|
|
|
1june
06,2007
|
after 1h
|
S1BLK1
|
7,07
|
0,062
|
0,006
|
|
|
2
|
|
|
S1BLK3
|
7,04
|
0,068
|
0,008
|
|
|
3
|
|
|
S1BLK6
|
7,11
|
0,07
|
0,118
|
|
|
4
|
|
|
S1WH1,1
|
7,08
|
0,048
|
0,113
|
|
|
5
|
|
|
S1WH1,3
|
7,09
|
0,029
|
0,099
|
|
|
6
|
|
|
S1WH1,6
|
6,97
|
0,045
|
0,121
|
|
|
7
|
|
|
S1WH2,1
|
6,59
|
0,036
|
0,001
|
|
|
8
|
|
|
S1WH2,3
|
6,91
|
0,044
|
0,107
|
|
|
9
|
|
|
S1WH2,6
|
6,98
|
0,026
|
0,121
|
|
|
10
|
|
|
S1WH4,1
|
6,9
|
0,022
|
0,087
|
|
|
11
|
|
|
S1WH4,3
|
7,01
|
0,176
|
0,112
|
|
|
12
|
|
|
S1WH4,6
|
6,96
|
0,084
|
0,085
|
|
|
|
|
|
|
|
|
|
|
13
|
|
after 2h
|
S2BLK1
|
7,24
|
0,062
|
0,084
|
|
|
14
|
|
|
S2BLK3
|
7,16
|
0,158
|
0,107
|
|
|
15
|
|
|
S2BLK6
|
7,2
|
0,058
|
0,081
|
|
|
16
|
|
|
S2WH1,1
|
7,21
|
0,007
|
0,129
|
|
|
17
|
|
|
S2WH1,3
|
7,17
|
0,022
|
0,052
|
|
|
18
|
|
|
S2WH1,6
|
7,08
|
0,088
|
0,112
|
|
|
19
|
|
|
S2WH2,1
|
6,66
|
0,008
|
0,109
|
|
|
20
|
|
|
S2WH2,3
|
6,99
|
0,094
|
0,087
|
|
|
21
|
|
|
S2WH2,6
|
7,06
|
0,095
|
0,105
|
|
|
22
|
|
|
S2WH4,1
|
7,07
|
0,012
|
0,115
|
|
|
23
|
|
|
S2WH4,3
|
7,13
|
0,062
|
0,008
|
|
|
24
|
|
|
S2WH4,6
|
7,09
|
0,023
|
0,098
|
|
|
|
|
|
|
|
|
|
|
26
|
|
after 3h
|
S3BLK1
|
7,23
|
0,05
|
0,108
|
|
|
27
|
|
|
S3BLK3
|
7,17
|
0,022
|
0,090
|
|
|
28
|
|
|
S3BLK6
|
7,21
|
0,019
|
0,077
|
|
|
29
|
|
|
S3WH1,1
|
7,23
|
0,144
|
0,075
|
|
|
30
|
|
|
S3WH1,3
|
7,18
|
0,011
|
0,081
|
|
|
31
|
|
|
S3WH1,6
|
7,1
|
0,003
|
0,063
|
|
|
32
|
|
|
S3WH2,1
|
6,62
|
0,007
|
0,093
|
|
|
33
|
|
|
S3WH2,3
|
7
|
0,029
|
0,079
|
|
|
34
|
|
|
S3WH2,6
|
7,04
|
0,001
|
0,107
|
|
|
35
|
|
|
S3WH4,1
|
7,13
|
0,015
|
0,076
|
|
|
36
|
|
|
S3WH4,3
|
7,17
|
0,002
|
0,088
|
|
|
37
|
|
|
S3WH4,6
|
7,11
|
0,071
|
0,083
|
|
|
38
|
|
after 4h
|
S4BLK1
|
7,29
|
0,032
|
0,074
|
|
|
39
|
|
|
S4BLK3
|
7,23
|
0,065
|
0,039
|
|
|
40
|
|
|
S4BLK6
|
7,29
|
0,018
|
0,029
|
|
|
41
|
|
|
S4WH1,1
|
7,32
|
0,034
|
0,064
|
|
|
42
|
|
|
S4WH1,3
|
7,22
|
0,045
|
0,051
|
|
|
43
|
|
|
S4WH1,6
|
7,12
|
0,033
|
0,026
|
|
|
44
|
|
|
S4WH2,1
|
6,61
|
0,007
|
0,023
|
|
|
45
|
|
|
S4WH2,3
|
7,02
|
0,007
|
0,021
|
|
|
46
|
|
|
S4WH2,6
|
7,06
|
0,010
|
0,005
|
|
|
47
|
|
|
S4WH4,1
|
7,23
|
0,002
|
0,001
|
|
|
48
|
|
|
S4WH4,3
|
7,42
|
0.000
|
0.000
|
|
|
49
|
|
|
S4WH4,6
|
7,34
|
0,014
|
0.000
|
|
|
50
|
|
|
|
|
|
|
|
|
|
after 5h
|
S5BLK1
|
7,45
|
0,008
|
0.000
|
|
|
51
|
|
|
S5BLK3
|
7,35
|
0.000
|
0.000
|
|
|
52
|
|
|
S5BLK6
|
7,46
|
0,03.0
|
0.000
|
|
|
53
|
|
|
S5WH1,1
|
7,44
|
0,014
|
0.000
|
|
|
54
|
|
|
S5WH1,3
|
7,32
|
0.000
|
0.000
|
|
|
55
|
|
|
S5WH1,6
|
7,14
|
0,098
|
0.000
|
|
|
56
|
|
|
S5WH2,1
|
6,7
|
0,013
|
0.000
|
|
|
57
|
|
|
S5WH2,3
|
7,17
|
0.000
|
0.000
|
|
|
58
|
|
|
S5WH2,6
|
7,12
|
0.000
|
0.000
|
|
|
59
|
|
|
S5WH4,1
|
7,33
|
0,005
|
0.000
|
|
|
60
|
|
|
S5WH4,3
|
7,55
|
0,006
|
0.000
|
|
|
61
|
|
|
S5WH4,6
|
7,45
|
0,034
|
0.000
|
|
|
62
|
|
|
|
|
|
|
|
|
63
|
|
after 6h
|
S6BLK1
|
7,49
|
0.000
|
0.000
|
|
|
63
|
|
|
S6BLK3
|
7,43
|
0.000
|
0.000
|
|
|
64
|
|
|
S6BLK6
|
7,5
|
0,024
|
0.000
|
|
|
65
|
|
|
S6WH1,1
|
7,55
|
0,001
|
0.000
|
|
|
66
|
|
|
S6WH1,3
|
7,56
|
0.000
|
0.000
|
|
|
67
|
|
|
S6WH1,6
|
7,48
|
0,032
|
0.000
|
|
|
68
|
|
|
S6WH2,1
|
6,83
|
0,062
|
0.000
|
|
|
69
|
|
|
S6WH2,3
|
7,35
|
0,014
|
0.000
|
|
|
70
|
|
|
S6WH2,6
|
7,32
|
0,098
|
0.000
|
|
|
71
|
|
|
S6WH4,1
|
7,46
|
0,024
|
0.000
|
|
|
72
|
|
|
S6WH4,3
|
7,61
|
0,013
|
0.000
|
|
|
73
|
|
|
S6WH4,6
|
7,52
|
0.000
|
0.000
|
|
|
74
|
|
|
|
|
|
|
|
|
74
|
june 07,2007
|
after12h
|
S7BLK1
|
7,82
|
0,021
|
0.000
|
|
|
75
|
|
|
S7BLK3
|
7,68
|
0,007
|
0.000
|
|
|
76
|
|
|
S7BLK6
|
7,82
|
0.000
|
0.000
|
|
|
77
|
|
|
S7WH1,1
|
7,62
|
0.000
|
0.000
|
|
|
78
|
|
|
S7WH1,3
|
7,47
|
0.000
|
0.000
|
|
|
79
|
|
|
S7WH1,6
|
7,42
|
0,022
|
0.000
|
|
|
80
|
|
|
S7WH2,1
|
6,23
|
0,012
|
0.000
|
|
|
81
|
|
|
S7WH2,3
|
7,13
|
0.000
|
0.000
|
|
|
82
|
|
|
S7WH2,6
|
6,85
|
0,002
|
0.000
|
|
|
83
|
|
|
S7WH4,1
|
7,49
|
0.000
|
0,093
|
|
|
84
|
|
|
S7WH4,3
|
7,51
|
0.000
|
0.000
|
|
|
85
|
|
|
S7WH4,6
|
7,34
|
0.000
|
0.000
|
|
|
86
|
june
08,2007
|
after24h
|
S8BLK1
|
7,9
|
0,004
|
0,000
|
|
|
87
|
|
|
S8BLK3
|
7,72
|
0,040
|
0,000
|
|
|
88
|
|
|
S8BLK6
|
7,89
|
0,000
|
0,000
|
|
|
89
|
|
|
S8WH1,1
|
7,48
|
0,000
|
0,000
|
|
|
90
|
|
|
S8WH1,3
|
7,35
|
0,000
|
0,000
|
|
|
91
|
|
|
S8WH1,6
|
7,37
|
0,005
|
0,000
|
|
|
92
|
|
|
S8WH2,1
|
5,65
|
0,004
|
0,000
|
|
|
93
|
|
|
S8WH2,3
|
6,62
|
0,000
|
0,000
|
|
|
94
|
|
|
S8WH2,6
|
6,28
|
0,032
|
0,000
|
|
|
95
|
|
|
S8WH4,1
|
7,48
|
0,000
|
0,000
|
|
|
96
|
|
|
S8WH4,3
|
7,53
|
0,000
|
0,000
|
|
|
97
|
|
|
S8WH4,6
|
7,34
|
0,004
|
0,000
|
|
|
|
|
|
|
|
|
|
|
98
|
june
10,2007
|
after48h
|
S9BLK1
|
7,64
|
0,016
|
0,000
|
|
|
99
|
|
|
S9BLK3
|
7,86
|
0,000
|
0,000
|
|
|
100
|
|
|
S9BLK6
|
7,65
|
0,004
|
0,000
|
|
|
101
|
|
|
S9WH1,1
|
7,8
|
0,000
|
0,000
|
|
|
102
|
|
|
S9WH1,3
|
7,64
|
0,000
|
0,000
|
|
|
103
|
|
|
S9WH1,6
|
7,57
|
0,000
|
0,000
|
|
|
104
|
|
|
S9WH2,1
|
5,52
|
0,002
|
0,000
|
|
|
105
|
|
|
S9WH2,3
|
6,07
|
0,000
|
0,000
|
|
|
106
|
|
|
S9WH2,6
|
6,16
|
0,016
|
0,000
|
|
|
107
|
|
|
S9WH4,1
|
7,57
|
0,000
|
0,000
|
|
|
108
|
|
|
S9WH4,3
|
7,75
|
0,000
|
0,000
|
|
|
109
|
|
|
S9WH4,6
|
7,51
|
0,000
|
0,000
|
|
|
110
|
|
|
|
|
|
|
|
|
june 13,2007
|
after 72 h
|
S10BLK1
|
8,03
|
0,014
|
0,000
|
|
111
|
|
|
S10BLK3
|
7,93
|
0,006
|
0,000
|
|
112
|
|
|
S10BLK6
|
7,72
|
0,024
|
0,000
|
|
113
|
|
|
S10WH1.1
|
7,24
|
0,011
|
0,000
|
|
114
|
|
|
S10WH1,3
|
7,21
|
0,000
|
0,000
|
|
115
|
|
|
S10WH1,6
|
7,23
|
0,009
|
0,000
|
|
116
|
|
|
S10WH2,1
|
5,19
|
0,017
|
0,000
|
|
117
|
|
|
S10WH2,3
|
4,94
|
0,011
|
0,000
|
|
118
|
|
|
S10WH2,6
|
6,35
|
0,012
|
0,000
|
|
119
|
|
|
S10WH4,1
|
7,19
|
0,003
|
0,000
|
|
120
|
|
|
S10WH4,3
|
7,58
|
0,001
|
0,000
|
|
121
|
|
|
S10WH4,6
|
6,97
|
0,004
|
0,007
|
|
123
|
|
|
|
|
|
|
|
124
|
june 15,2007
|
after 96 h
|
S11BLK1
|
6,6
|
0,005
|
0,012
|
|
125
|
|
|
S11BLK3
|
7,37
|
0,015
|
0,079
|
|
126
|
|
|
S11BLK6
|
7,6
|
0,032
|
0,021
|
|
127
|
|
|
S11WH2,1
|
4,57
|
0,024
|
0,079
|
|
128
|
|
|
S11WH2,3
|
4,5
|
0,001
|
0,065
|
|
129
|
|
|
S11WH2,6
|
6,6
|
0,009
|
0,045
|
|
130
|
|
|
S11WH4,1
|
6,15
|
0,000
|
0,006
|
|
131
|
|
|
S11WH4,3
|
7,58
|
0,000
|
0,000
|
|
132
|
|
|
S11WH4,6
|
6,88
|
0,000
|
0,000
|
|
133
|
|
|
|
|
|
|
|
134
|
june 20,2007
|
after 120h
|
S12BLK1
|
8,01
|
0,023
|
0,000
|
|
135
|
|
|
S12BLK3
|
8,14
|
0,008
|
0,000
|
|
136
|
|
|
S12BLK6
|
7,75
|
0,011
|
0,000
|
|
137
|
|
|
S12WH2,1
|
4,75
|
0,029
|
0,000
|
|
138
|
|
|
S12WH2,3
|
4,87
|
0,008
|
0,000
|
|
139
|
|
|
S12WH2,6
|
6,48
|
0,008
|
0,000
|
|
140
|
|
|
S12WH4,1
|
6,61
|
0,009
|
0,000
|
|
141
|
|
|
S12WH4,3
|
7,6
|
0,000
|
0,000
|
|
142
|
|
|
S12WH4,6
|
5,67
|
0,006
|
0,007
|
|
143
|
|
|
|
|
|
|
|
1 mg/L
|
3 mg/L
|
6 mg/L
|
|
|
|
|
|
|
|
|
roots
|
0.324167
|
0
|
0
|
|
petioles
|
0.134
|
0.418
|
0.503
|
|
leaves
|
0
|
0
|
0
|
|
0.4582 0.418 0.503
|
|
total
|
% of Cr BCF
|
|
0.324167
|
23.5
|
|
1.055
|
76.5
|
|
0
|
0.0
|
|
1.379167
|
100
|
|
144
|
26-juin-07
|
after 144h
|
S13BLK1
|
7,12
|
0,000
|
0,016
|
|
145
|
|
|
S13BLK3
|
7,73
|
0,000
|
0,061
|
|
146
|
|
|
S13BLK6
|
7,25
|
0,000
|
0,001
|
|
147
|
|
|
S13WH4,1
|
5,31
|
0,000
|
0,049
|
|
148
|
|
|
S13WH4,3
|
7,35
|
0,000
|
0,000
|
|
149
|
|
|
S13WH4,6
|
4,47
|
0,004
|
0,053
|
|
150
|
|
|
|
|
|
|
|
151
|
3-juil-07
|
after 168h
|
S14BLK1
|
8,61
|
0,000
|
0,012
|
|
152
|
|
|
S14BLK3
|
8,37
|
0,000
|
0,000
|
|
153
|
|
|
S14BLK6
|
7,5
|
0,000
|
0,000
|
|
154
|
|
|
S14WH4,1
|
4,93
|
0,000
|
0,000
|
|
155
|
|
|
S14WH4,3
|
7,27
|
0,000
|
0,000
|
|
156
|
|
|
S14WH4,6
|
4,43
|
0,000
|
0,000
|
Appendix XIII: Bioconcentration Factor of
zinc
|
Part
|
1 mg/L
|
3 mg/L
|
6 mg/L
|
total
|
% of BCF of Zn
|
|
roots
|
0.032
|
0.081
|
0.812
|
0.925
|
16.5
|
|
petioles
|
0.793
|
1.491
|
0.75
|
3.034
|
54.1
|
|
leaves
|
0.171
|
1.095
|
0.383
|
1.649
|
29.4
|
|
0.996
|
2.667
|
1.945
|
5.608
|
100.0
|
Appendix XIV: Bioconcentration Factor of
chromium
Appendix XV: Synthetic wastewater and Nutrient
solutions
A) Heavy metals concentration in synthetic
wastewater
|
Substances
|
Concentration (mg / L)
|
|
Zn (mg/l)
|
5
|
|
Cu (mg/l)
|
0,4
|
|
Pb (mg/l)
|
1
|
|
Cr (mg/l)
|
6
|
B) Heavy metals concentration in synthetic
wastewater
|
Substances
|
Concentration (mg / L)
|
|
Zn (mg/l)
|
5
|
|
Cu (mg/l)
|
0,4
|
|
Pb (mg/l)
|
1
|
|
Cr (mg/l)
|
6
|
|
SO42- (mg/l)
|
200 - 2000
|
|
OC (mg/l)
|
50 - 500
|
C) Hutner solution (Leman, 2000)
|
Substances
|
Concentration (mg / L)
|
|
NH4Cl
|
20
|
|
K2HPO4
|
40
|
|
Ca(NO3)2 4H2O
|
20
|
|
MgSO4 4H2O
|
50
|
|
FeSO4 7H2O
|
2,5
|
|
MnCl2 4H2O
|
1,5
|
|
ZnSO4 7H2O
|
6,5
|
|
H3BO3
|
1,5
|
|
Na2MoO4 2H2O
|
2,5
|
|
CuSO4 7H2O
|
0,4
|
|
CoSO4 7H2O
|
0,1
|
|
EDTA (Na)2
|
50
|
Appendix XVI: Protocol used in laboratory
experiments
The destruction of plants and fish tissue for the
determination of Cd, Cr, Cu, Pb, Mn,
Fe and Zn with the atomic absorption
technique
2.2.1 Apparatus
a) Destruction-bloc with destruction tubes made of borosilicate
glass
b) Nichiryo pipet model 3100 with removable tips
2.2.2 Reagents, all with a low metal content
a) Nitric acid, 65% HNO3
b) Hydrogen peroxide, 30% H2O2
c) Pumice
2.2.3 Glassware
All rinsed with 1 + 1 HNO3
Measuring cylinder, 50 mL
Funnels with a diameter of 6 cm Volumetric flasks of 250 mL
2.2.4 Procedure
1. Transfer not more than 1.250 g dried sample (24 hours at
103°C) to the destruction tube, add 25 mL HNO3, three boiling chips and
place a funnel on
top of the destruction tube.
2. a) Heat the tube to 100°C and maintain for 1 hour b)
Heat to 125°C and maintain for 15 minutes
c) Heat to 150°C and maintain for 15 minutes
d) Heat to 175°C and maintain for 15 minutes
e) Heat to 200°C and add, if necessary (if no
volume is left), 5 mL HNO3
3. Concentrate to about 5 mL
4. Add, after cooling, 1 mL 30% H2O2 and
destruct for 10 minutes, repeat 1 x
5. Add, after cooling, 3 mL 30% H2O2 and
destruct again for 10 minutes
6. Add 25 mL water, mix and heat till boiling
7. Cool and transfer the whole sample to a 250 mL volumetric
flask, fill up to the mark, mix and let settle during at least 15 hours
8. Measure the absorbance of the clear supernatant.
Note: 1. Duration of procedure steps 1-7 at least 7 hours 2.
Determine two blancs
2.3 The destruction of soil and sludge for the
determination of Cd, Cr, Cu, Pb,
Mn, Fe and Zn with the atomic absorption
technique
2.3.1 Apparatus
a) Destruction-bloc with destruction tubes made of borosilicate
glass
b) Nichiryo pipet model 3100 with removable tips
2.3.2 Reagents
All reagents with a low percentage of heavy metals
a) Hydrochloric acid, 37% HCl
b) Nitric acid, 65% HNO3
c) Hydrogen peroxide, 30% H2O2
d) Pumice
2.3.3 Glassware
All rinsed with 1 + 1 HNO3
Measuring cylinder, 500 mL Measuring cylinder, 50 mL Funnels with
a diameter of 6 cm
1 L flask for the acid-mixure, see note
Volumetric flasks of 250 mL
2.3.4 Procedure
1. Transfer not more than 1.250 g of a ground air-dried sample
to the destruction tube, add 50 mL H2O and three boiling chips
2. Add 50 mL HCl/HNO3 3:1, mix, and place a funnel on top of the
destruction
tube
3. a) Heat the tube to 100°C and maintain for 1 hour b)
Heat to 125°C and maintain for 15 minutes
c) Heat to 150°C and maintain for 15 minutes
d) Heat to 175°C and maintain for 15 minutes
e) Heat to 200°C and add, if necessary (if no
volume is left), 5 mL HNO3
4. Concentrate to about 5 mL
5. Add, after cooling, 1 mL 30% H2O2 and destruct for 10
minutes. Repeat 1 x
6. Add, after cooling, 3 mL 30% H2O2 and
destruct again for 10 minutes
7. Add 50 mL water and 25 mL HCl, mix and heat till boiling
8. Cool and transfer the whole sample to a 250 mL volumetric
flask, fill up to the mark, mix, and let settle during at least 15 hours
9. Measure the absorbance of the clear supernatant.
Note: 1. Prepare a fresh acid-mixture and do not close the
container!!
2. Duration of procedure steps 1-7 at least 7 hours
3. Determine two blancs
4. Sludge samples will decompose almost completely
2.4 Preliminary Digestion for Metals in water
To reduce interference by organic matter and to convert metal
associated with particulates to a form (usually the free metal) that can be
determined by atomic absorption spectrometry or inductively-coupled plasma
spectroscopy, use one of the digestion techniques presented below. Use the
least rigorous digestion method required to provide complete and consistent
recovery compatible with the analytical method and the metal being analyzed.
Nitric acid will digest most samples adequately. Nitrate is an
acceptable matrix for both flame and electrothermal atomic absorption. Some
samples may require addition of perchloric, hydrochloric, or sulfuric acid for
complete digestion. These acids may interfere in the analysis of some metals
and all provide a poorer matrix for electrothermal analysis. Confirm metal
recovery for each digestion and analytical procedure used. As a general rule,
HNO3 alone is
adequate for clean samples or easily oxidized materials:
HNO3-H2SO4 or
HNO3-HCl digestion is adequate for readily oxidizable organic
matter; HNO3-
HClO4 or HNO3-HClO4-HF digestion is necessary for
difficult-to-oxidize organic
matter or minerals. Dry ashing is helpful if large amounts of
organic matter are present, but yields highly variable precision and bias,
depending on sample type and metal being analyzed. Dry-ash only samples that
have been shown to yield acceptable precision and bias.
2.4.1 Dry ashing procedure, use only if necessary
Mix sample and tranfser a suitable volume into a platinum or
high-silica glass evaporating dish. Evaporate to dryness on a steam bath.
Transfer dish to a muffle furnace and heat sample to a white ash. If volatile
elements are to be determined, keep temperature at 400 to 450°C. If sodium
only is to be determined, ash sample at a temperature up to
600°C. Dissolve ash in a minimum quantity of conc HNO3 and warm
water. Filter diluted sample and
adjust to a known volume, preferably so that the final HNO3
concentration is about 1%. Take portions of this solution for metals
determination.
2.4.2 Nitric acid digestion procedure
Apparatus
a) Hot plate
b) Conical flasks, 100 mL, acid-washed and rinsed with water
Reagents
Nitric acid, HNO3, conc. Procedure
Mix sample and transfer a suitable volume (50 to 100 mL) to a
100 mL conical
flask or beaker. Add 5 mL conc. HNO3 and a few boiling chips.
Bring to a slow
boil and evaporate on a hot plate to the lowest volume possible
(about 10 to 20
mL) before precipitation occurs. Continue heating and adding
conc HNO3 as
necessary until digestion is complete as shown by a
light-colored, clear solution. Do not let sample dry during digestion.
Wash down flask or beaker walls with water and then filter if
necessary. Transfer filtrate to a 100 mL volumetric flask with two 5 mL
portions of water, adding these rinsings to the volumetric flask. Cool. dilute
to mark, and mix thoroughly. Take portions of this solution for required metal
determinations.
2.4.3 Nitric Acid-Hydrochloric Acid Digestion Apparatus
see 2.4.2
Reagents
a) Nitric acid, HNO3, conc.
b) Hydrochloric acid, 1 + 1
Procedure
a) Total HNO3/HCl: Transfer a measured volume of wellmixed,
acid-preserved
sample appropriate for the expected metals concentrations to a
flask or
beaker. Add 3 mL conc HNO3. Place flask or beaker on a hot plate
and
cautiously evaporate to less than 5 mL , making certain that
sample does not
boil and that no area of the bottom of the container is
allowed to go dry. Cool
and add 5 mL conc HNO3. Cover container with a watch
glass and return to
hot plate. Increase temperature of hot plate so that a gentle
reflux action occurs. Continue heating, adding additional acid as necessary,
until digestion is complete (generally indicated when the digestate is light in
color or does not change in appearance with continued refluxing). Evaporate to
less than 5 mL and cool. Add 10 mL 1 + 1 HCl and 15 mL water per 100 mL
anticipated final volume. Heat for an additional 15 min to dissolve any
precipitate or residue. Cool, wash down beaker walls and watch glass with
water, and adjust to a predetermined volume based on the expected metals
concentrations. If necessary (when particles are present), let settle
overnight.
b) Recoverable HNO3/HCl: For this less rigorous digestion
procedure, transfer
a measured volume of well-mixed, acid-preserved sample to a
flask or
beaker. Add 2 mL 1 + 1 HNO3 and 10 mL 1 + 1 HCl and heat on a
steam
bath or hot plate until volume has been reduced to near 25 mL,
making certain sample does not boil. Cool and let settle overnight. Adjust
volume to 100 mL and mix.
|
|


