4.6.3 Discussions on uptake mechanism
The discussion on uptake mechanism for zinc was reported that
56.7% of zinc was
accumulated in petioles, 27.0% in leaves and 16.3% in
roots. Table 4.3 indicates that
there is no significant difference
(p<=0.05) according to initial concentration and
exposure time (p<=0.05) in uptake mechanisms of zinc, but a
high difference (p<=0.05) (significant) was observed in plant parts
(p<=0.05) in uptake processes.
Table 4.3: Variability in zinc uptake compared to initial
concentration & exposure time.
|
ANOVA
|
|
|
|
|
|
|
|
Source of Variation
|
SS"
|
dfc
|
MSd
|
Fe
|
P-valuef
|
F crit
|
|
I.Ca & exposure time Plant plants
Error
Total
|
0.05
0.22
0.06
0.33
|
8 2 16
26
|
0.01
0.11
0.00
|
1.68
28.75
|
0.18
0.00
|
2.59
3.63
|
a: initial concentration; b: square sums; c: degree of freedom;
d: means squared; e: Fischer test; f: probability value.
However, for chromium it was observed that 73.7% was taken up
in roots, 14.1% in petioles and 12.2% in leaves. This shows the preference of
the plant to store chromium more in roots than in petioles and leaves. Table
4.4 shows that no significant difference (p<=0.05) existed between plant
parts (p<=0.05) and also between initial concentrations in uptake processes
for chromium (p<=0.05). The inhibition in the uptake was perhaps because of
the competition of both the metals for the same site of the plant during
metabolism processes of the plants.
|
Table 4.4: variability in uptake of chromium ANOVA
|
|
|
|
|
|
|
Source of Variation
|
SS"
|
dfc
|
MSd
|
Fe
|
P-valuef
|
F crit
|
|
plant parts I.Ca.
Error
Total
|
4.57
2.36
2.14
9.07
|
2
2
4
8
|
2.28
1.18
0.53
|
4.27
2.21
|
0.10
0.23
|
6.94
6.94
|
a: initial concentration; b: square sums; c: degree of freedom;
d: means squared; e: Fischer test; f: probability value.
4.7 Translocation Ability (TA)
4.7.1 Variation of translocation ability for
zinc
The translocation ability is a parameter, which shows the
ability of the aquatic macrophytes to take up the trace elements in the top
part of plants (leaves, petioles and flowers). Most times, the translocation
ability of roots/leaves seems to be high when compared to roots/petioles, the
reason is that more trace elements were accumulated in
petioles. When concentration accumulated in roots compared to one
accumulated in leaves is high than roots concentration compared to petioles
concentration.
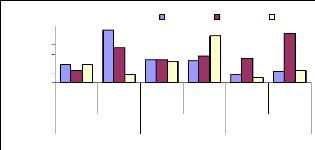
Figure 4.18 shows that the high translocation ability for 1
mg/L was observed for roots/leaves during 1 week, for 3 mg/L for 4 weeks
(roots/leaves) and for 6 mg/L was observed for 2 weeks for roots/leaves, this
can be explain by a little concentration of metal accumulated in leaves during
plants' exposure to zinc.
1.0
0.8
0.6
0.4
values
0.2
0.0
1 week
2 w eeks
4 w eeks
1.2
|
roots vs
|
roots vs
|
roots vs
|
roots vs
|
roots vs
|
roots vs
|
|
petioles
|
leaves
|
petioles
|
leaves
|
petioles
|
leaves
|
Time (week) vs TA
1 mg/L 3 mg/L 6 mg/L
Figure 4.18: Translocation ability for Zinc by water hyacinth
plants
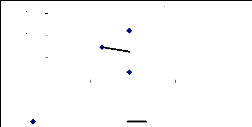
The Figures 4.19, 4.20 and 4.21 show the correlations between
the translocation ability, the metal concentrations and the exposure time of
plants to zinc. This behavior indicates positive or negative correlation
between the above parameters. It was shown that there is no correlation for 1
week between translocation ability and metal concentrations. For 2 weeks, a
negative correlation was found (R square = 0.89) and for 4 weeks, a high
positive correlation (R square = 0.97) was observed. This can be explaining by
the key role of exposure time versus metal translocation ability by the
plants.
1.5
y = -0.7505x + 0.9256
R2 = 0.0133
0.5
0.0
0.0 0.2 0.4 0.6
zinc concentration (mg/L)
roots vs leaves Linear (roots vs leaves)
1.0
TA
Figure 4.19: Translocation ability for 1 week
39
R. J. GAKWAVU (2007) MSc Thesis
TA
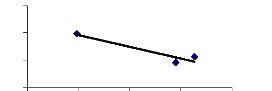
y = -10.817x + 5.7303
R2 = 0.8929
1.5
1.0
0.5
0.0
0.42 0.44 0.46 0.48 0.50
Zn conc. (mg/L)
roots vs leaves Linear (roots vs leaves)

Figure 4.20: Translocation ability for 2 weeks
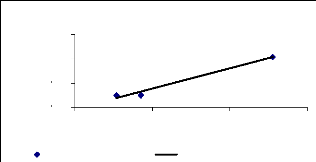
y = 2.0929x - 0.0386
R2 = 0.9752
0.0 0.2 0.4 0.6
Zn conc. (mg/L)
roots vs leaves Linear (roots vs leaves)
1.5
TA
0.5
0.0
1.0
Figure 4.21: Translocation ability for 4 weeks
As shown on the above figures, the positive correlation
between translocation ability and zinc concentration increase progressively
when the exposure time increases, according to the regression coefficients
observed.
4.7.2. Variation of translocation ability for
chromium
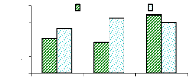
Figure 4.22 presents the translocation ability of chromium;
which is too high when compared to zinc translocation ability. It is explained
by the fact more concentration of chromium was in roots, because the
translocation ability is to analyze the capacity of plant parts storage.
Translocatioon ability of chromium
1 mg/L 3 mg/L 6 mg/L
Initial concentration
8
6
4
2
0
Translocation
ability
roots/petioles roots/leaves
Figure 4.22: Comparison of roots and shoots in translocation
ability
It seems that the translocation ability of chromium is too
high as shown in Table 4.5 compared to the zinc's translocation ability. The
ability of plants to translocate trace elements of chromium is increased for
roots/leaves (5.3 times for 1 mg/L, 6.5 times for 3 mg/L and 6 times for 6
mg/L). The number of times for roots/petioles decreases (4 times for 1 mg/L, 4
times for 3 mg/L and 7 times for 6 mg/L) because the order of storage was
leaves<petioles<roots.
Table 4.5: Translocation ability of chromium by the
plant
|
I.Ca of chromium (VI)
|
|
Roots/shoots
|
1 mg/L
|
3 mg/L
|
6 mg/L
|
|
roots/petioles roots/leaves
|
4.104b
5.288b
|
3.663b
6.487b
|
6.831b
5.965b
|
a: initial concentration; b: times of storage in roots compared
to shoots.
The Figure 4.23 reports that the correlation between roots and
petioles is high (R square = 0.6) compared to the correlation between roots and
leaves (R square = 0.3), this is because less quantity of Cr (VI) was
translocated in leaves.
correlation between roots and shoots
8 y = 1.3635x + 2.139
R2 = 0.6314
6
4
y = 0.3385x + 5.2363
R2 = 0.317
0
0 1 2 3 4
conc. (mg/L)
roots/petioles roots/leaves
Linear (roots/petioles) Linear (roots/leaves)
x times roots/shoots
2


Figure 4.23: Correlation of roots vs. shoots
4.7.3 Discussions on translocation ability
Table 4.6 indicates the ANOVA 2 which shows the variability in
translocation ability for zinc. It can be seen that the difference is not
significant (p<=0.05) between metal concentration (p<=0.05) and no
significant difference (p<=0.05) between roots and shoots translocation.
|
Table 4.6: variations in translocation ability of zinc
ANOVA
|
|
|
|
|
|
Source of Variation
|
SS
|
df
|
MS
|
F
|
P-value
|
F crit
|
|
metal concentration roots/shoots
Error
Total
|
0,42 0,13 1,01 1,56
|
5 2 1 0 17
|
0 , 08
0,07
0,10
|
0,84
0,65
|
0,55
0,54
|
3,33
4,10
|
Stratford et al. (1984) found that the metals
accumulations in water hyacinth increased linearly with the solution
concentration in the order of
leaves<petioles<roots in water hyacinth. For this research,
the situation is different because the following order was observed:
leaves<roots<petioles. When the concentration
is high, the water hyacinth plant can accumulate little concentration in plant
cells. The high translocation ability was observed for roots/leaves
(1.114) for 1 week and the low translocation ability was
observed for roots/petioles (0.109) for 4 weeks. Most of
times, the translocation ability of roots/leaves seems to be high when compared
to roots/petioles. The reason is that more trace elements were accumulated in
petioles. When concentration accumulated in roots compared to one accumulated
in leaves is high than roots concentration compared to petioles
concentration.
Stratford et al. (1984) found that the metals
accumulations in water hyacinth increased linearly with the solution
concentration in the order of
leaves<petioles<roots in water hyacinth. This
agrees with the results of this study in the case of chromium concentration
accumulation in water hyacinth plants, where the high concentration was
accumulated in roots followed by petioles and then leaves.
| 

