Will ASECNA meet the needs of african air navigation for the 21st century? an analysis of asecna strategy for adopting CNS/ATM( Télécharger le fichier original )par Francis NTONGO Cranfield college of aeronautics - MSc Air Transport Management 2005 |

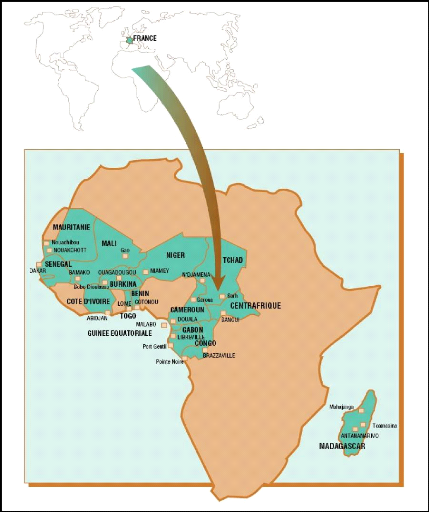
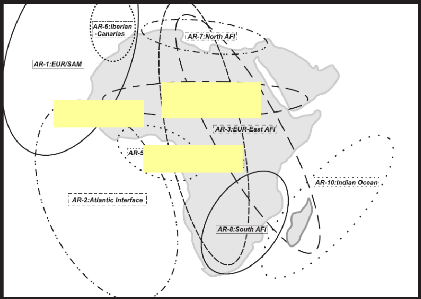
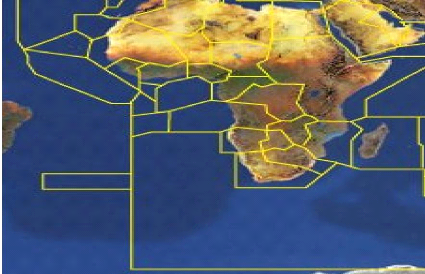
1.5. Structure of ThesisThe choice of performance areas is discussed in chapter 1. The overview of ASECNA region's air transport industry is discussed in Chapter 2. An insight of regional characteristics is given, which provides a better understanding of the operational environment and the context, as well as the importance of a performing air navigation system for the region. A detailed analysis of air navigation systems' performance is provided in Chapter 3. Local navigation characteristics are discussed, and predefined performance areas presented in chapter 1 are examined. That allows highlighting the areas that require improvements and to define what should be the priorities for the region. Chapter 4 presents CNS/ATM systems and concepts and looks at their potential benefits, with regard to local characteristics. Finally, the strategy adopted by the agency to respond to those priorities is examined in chapter 5. 1.6. Data SourcesThe instruments for this study include a one week visit to ASECNA's headquarter in Dakar, Senegal, to collect data and documents, to discuss with professionals involved in daily operations and to observe the actual state of the implementation of the strategy on the ground. Telephone interviews, email-statements, internet documentation are intensively used. Key internet documents come from ICAO, ASECNA, IATA, and CANSO8's CNS/ATM related literature. 1.7. Key Assumptions The geographic boundaries of the study are clearly the region covered by ASECNA. However, as ASECNA9 is part of the wider geographic entity, the study of this region naturally implies to investigate its interactions with the neighbourhood. 8 Civil Air navigation Services Organisation 9 Seen here as a region, not the organization itself A key assumption in the study is that average economic and air traffic prospects that are applicable to the African continent are applicable to ASECNA. This is a sensitive approach as the economic characteristics of the region are similar to the continent's patterns. However, the average growth figures may be driven up by air transport leading countries. In particular, air transport is less developed in ASECNA then Southern, Eastern Africa, and North Africa. Another key assumption is that the relative importance of individual countries' air transport performance is frozen over the period studied. Therefore, the relative importance of airports size and spatial distribution of traffic flows within the region is supposed to remain unchanged. 1.8. Choice of performance indicatorsA large number of indicators could be used to assess ASECNA's performance. How ever, for this study, several factors influenced the choice of indicators: The availability of data: several other indicators could have been used but ASECNA does not collect the corresponding data. Moreover, some chosen indicators could have been broken down into more detailed data, but that has not been possible. The effectiveness of chosen indicators in assessing an ANSP's performance: Safety, Capacity, Flight efficiency, Cost Effectiveness, cross border cooperation are aspects of an ANSP operation that effectively evaluate the quality of service provision. Safety Safety performance measures are hardly available in ASECNA. However, indicative incidents reports are used to assess the safety level. A comparison with other Regions' safety records with respect to the level of traffic gives an idea of ASECNA's performance. Capacity Capacity is closely related to delays and the level of traffic. Although delays data are not available, interviews allow having an idea of influent factors. Flight Efficiency The availability of a maximum number of direct routes and the possibility to chose optimum flight levels are crucial to airlines as it allows reducing their fuel bill. Cost effectiveness The bill paid by airlines for service provision depends on ASECNA's ability to maintain low operating costs. Cooperation The level of technical and political cooperation indicates how states and ANSPs work together to avoid unnecessary costs to airlines, and make the airspace as seamless as possible. 1.9. Summary This chapter laid the foundations for the thesis. It introduced the research problem and questions: Will ASECNA meet the needs of the African Air Navigation for the 21st century? In addition, what are the problematic and the challenges related to the achievement of that mission? The research was justified, and the methodology, based on an analytical approach was detailed. Performance indicators have been presented and discussed. Key assumptions were presented. Chapter 2: ASECNA's Air Transport Industry The aim of this chapter is to find out the region's air transport industry's characteristics. This is an important step as it helps to understand in which environment ASECNA evolves, and the factors that may influence its activities. Further details on ASECNA as an organization and its history are included in appendix 1. Figure 2.1: ASECNA area in this report
Source: ASECNA 2.1 Economic Characteristics ASECNA comprises developing countries, mainly located in western or Central Africa, except Madagascar and the Comoros Islands located in the Indian Ocean (See map above). Their Economies are relatively weak. Mali, Niger, Chad, Burkina Faso Togo and the Central African Republic (CAR) are among the poorest country in the world. The general picture is one of underdevelopment, political instability, economic volatility and high poverty. Comparative Gross Domestic Products and populations between ASECNA, the world average and UK's performance reflect that situation (Table below).
Table2.1: Comparative GDP and
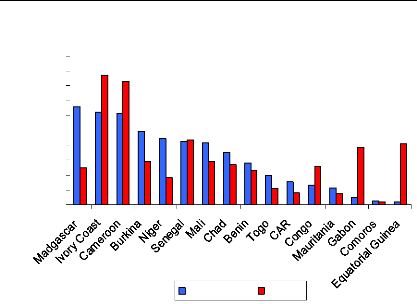
populations; The region accounts for just 0.2 per cent of world GDP. But in contrast to its low share of economic activity worldwide, as the table above shows it, 141 million people live in ASECNA, which is 2.2 % of world population. That combination of low input and high population means the GDP per capita in ASECNA is the lowest among the world regions (1700 dollars). UK for instance is 24 times wealthier, and its GDP per capita is 26 times ASECNA's average. 46 per cent of the population lives under the poverty line in the region. Countries in ASECNA remain to a large extent producers of raw materials. They export agricultural goods such as coffee, cocoa and cotton, or mineral such as crude oil and copper. Trade exchanges in ASECNA region tend to be dominated by agricultural exports. 1 Data compiled from CIA world Fact book 2006 However, economic development is not homogeneous within the region. Noticeable disparities between countries exist. For example, while Equatorial Guinea represents only 0.4 per cent of regional population, it accounts for 8.3 per cent of GDP. In contrast, Madagascar that contains 13 per cent of total population accounts only for 4.9 per cent of regional GDP. (Figure 2.2) Figure 2.2: Share of Population and GDP by country
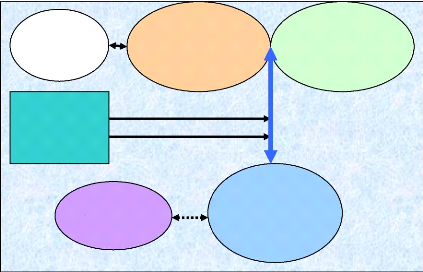
20 18 16 (percentage) 14 12 10 8 6 4 2 0 % Population %GDP Source: CIA fact book 2006 Ivory Coast, Cameroon, Senegal, Gabon and Equatorial Guinea account for almost 60 percent of ASECNA GDP and one third of the population, while Comoros, Niger, Mauritania, Togo, and CAR own 9.3 per cent of GDP and host 20 per cent of population. Regional integration processes are on the way. ASECNA members countries located in West Africa are part of ECOWAS (Economic Community of West African States). Those located in Central Africa are members of CEMAC (Central Africa Economic and Monetary Union). The level of integration varies significantly. The ECOWAS is much more advanced than the CEMAC. But the two entities are confronted to the economic disparities described above, which slow the pace of integration. The lack of a real political will in CEMAC, or persisting political instability and civil wars in key countries such as Ivory Coast, and the Republic of Congo have also had a damaging impact on regional economic and political integration. In other respects, bad Governance is a common practice at the state level and in public companies. States continue to own a high number of companies in strategic sectors such Telecommunications, Water, Energy and Transports, although privatisations are spreading across the region, mainly on the basis of International Monetary Funds Recommendations (IMF). It is generally admitted that state ownership, «poor management and monitoring, and anti-competitive arrangements have bred corruption in Africa» and particularly in the ASECNA area (Morrell, 2005) These factors, combined with the low level of investments (Foreign Direct Investments are among the lowest in the world), contribute to explain the underdevelopment of basic infrastructures, particularly in the transport sector. 2.2 Transport infrastructure 2.2.1 Roads Roads are the predominant mode for freight and passenger transport in Africa (World Bank, 2005). But within individual countries, very often, only the main cities are linked by paved roads. Regional interconnection is very limited. There are only 39,000 Kilometres of paved roads in the entire region, which represents 18 percent of total road network. Moreover, these roads are often in a relatively bad state due to poor maintenance. In comparison, UK alone has 392,931 Kilometres of highways, which is ten times more. That situation renders economic exchanges very difficult and slows their intensity as well as it limits regional integration. 2.2.2 Railways Railway links are very poor or do not exist within and between countries. Two third of the actual rail infrastructure were inherited from the colonial period (OEDC, 2005, P.22). There are only 8228 Kilometres of railways in ASECNA countries (17300 in the UK). Some states such as Niger, Chad, Equatorial Guinea, Comoros, and CAR have simply no railway infrastructure, which means their economic activity depends heavily on the road system. 2.2.3 Ports There are a dozen key ports in ASECNA. The most important of them is Dakar, with about 10 millions tonnes of goods. The essential of ASECNA countries trade activities is carried out through these ports. For instance, 98 per cent of exchanges between Cameroon and the outside world are done through Douala autonomous port, with about 5.2 millions tonnes per year (Mission Economique, 2006) But, the reliability and the speed of exchanges of goods and mobility of people is a crucial factor for regional integration. Given the under performance of road, and rail systems, and the slowness of sea transport, the availability of an adequate air transport infrastructure is therefore of paramount importance for ASECNA countries as they try to integrate into the world economy. 2.3 Air Transport industry A developed air transport industry is a driving force for economy, and a catalyst for development and trade. It facilitates exchanges between countries in which air transport substitutes, the road and rail systems are underdeveloped. Passenger aviation is the principle mean of transport for business and tourism travellers. Airports link the movement of passengers and goods to national economies; they serve as a primary hub for the tourism industry, and as key logistical centre for international trade. Stakeholders in ASECNA are the states, airlines, ANSPs, airports and international institutions. The study focuses on the relation between ANSPs and other stakeholders (Figure 2.3). States are represented by civil aviation authorities and Governments. They make air transport policies, on the basis of strategic objectives, through legislations applying to all the others stakeholders in the region. Airlines are of different types: International, Domestic, and Regional. Both ASECNA originated airlines and the others are considered. Airports are divided into main and secondary airports. The region only air navigation service provider is ASECNA. The institution has links with others neighbouring ANSPs. Figure 2.3: The stakeholders2
Policy Makers Authorities Air Travel Other ANS Policy Cooperation Airlines International Legislations Air Navigation ASECNA Performance Airports 2.3.1 Airport Infrastructure Main Airports The airport infrastructure (airstrips, air terminals, aircraft hangars) of ASECNA member states comprises about 25 international airports (2400 to 3500 m of tarred runways) regularly used. The main airports are Dakar, Abidjan, Douala, Libreville, Brazzaville and Antananarivo. They are served by major regional, continental and intercontinental airlines. The service provided is acceptable, but is far from being good. The airport sector is not free from financing, safety and
security problems. Built for the 2 All the stakeholders are not taken into account: Ground Handling, Maintenance, Catering... etc unsuitable; passenger terminals are cramped or saturated in peak hours. There are insufficient cargo hangars, refrigerating warehouses and fencing (African Union, 2005). There are needs for the updating of these installations to meet international standards. The inexistence of airport fences or in disrepair poses serious security and safety problems. Secondary Airports The region counts about 150 domestic airports (runways of 1000 to 2000 m, usually unpaved) and about 200 other national aerodromes (poorly maintained), with for several of them inexistent traffic. These airports do not often have adequate navigation aids, or basic airport commodities, which constrains their accessibility. 2.3.2 Airlines In West Africa, and particularly in ASECNA, the liquidation of Air Afrique after 40 years of existence marked the end of a symbol of African airline integration. Data from Air Transport Intelligence show that nearly 81 per cent of airlines serving ASECNA are African. 50 per cent are from member states and 31 per cent from other continents. The main local carriers are Air Madagascar, Air Senegal international, Cameroon Airlines, Air Gabon, Air Ivoire, Air Burkina, Air Mauritania, Air Togo, and Toumai Air Tchad. Domestic Airlines The poor domestic markets are served by national carriers or very small companies of which the fleet is often constituted by a single aircraft. Regional Airlines Air Senegal International, Bellview (Nigeria), Air Ivoire, Cameroon Airlines, Toumaï Air Chad and Air Burkina have put in a lot of efforts to fill up the vacuum left following the demise of Air Afrique. These airlines propose flights to travel within the region from and to the main cities in the regions. International Airlines The region can be divided into two groups of countries:
Local Airlines Cameroon Airline, Air Gabon, Air Madagascar and Air Senegal International are the three main local flag carriers. They link the respective countries to Africa and mainly Western Europe and less regularly the Middle East (During the hajj3) Foreign Airlines Air France-KLM is the dominant carrier on the long haul market. It serves all ASECNA's main airports. Swiss, SN Brussels, Iberia, Lufthansa and Alitalia also regularly flight to the region. An important figure to highlight is the percentage of international traffic ensured by Western airlines. In fact, according to ASECNA about 80 per cent of the commercial traffic is operated by these carriers4. The Libyan carrier, Afriqiyah Airways is now operating to most of the defunct Air Afrique member countries transforming Tripoli into a hub for passengers connecting to Europe and the Middle East. Tunisia has also started flying to Bamako and Abidjan. Royal Air Maroc (RAM) has opened routes to Dakar, Douala and Gabon. Ethiopian, South African Airways, Kenyan Airways and Air Inter5 also have regular connections with ASECNA. 2.3.3 Fleet A study by Boeing showed that about 75 per cent of African
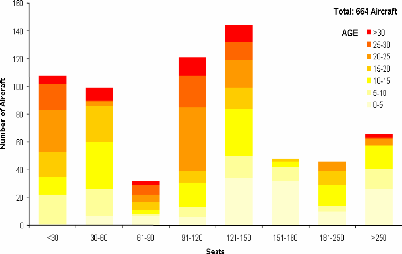
fleet is composed by 3 Pilgrimage to Mecca 4 Air France-KLM, TAP, Alitalia, SN Bruxels, SWISS, Iberia, Lufthansa... 5 South African carrier Most intra African routes are operated with narrow bodies, or very small jets or turbo propellers. Figure 2.4: Proportion of Aircraft types in Africa
415 78% 92 17% 24 5% Jets Turbo PropellersSmall size aircraft Source: Afraa, 2005 Figure 2.5: Intra African market Fleet (Jets + Turbo Propellers)
Source: Ambraer, 2006
Table 2.2: Situation of aircraft operated in the
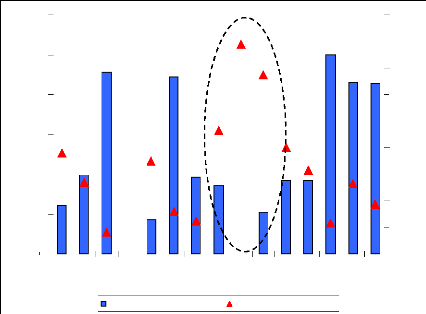
world About 54 % of aircraft operated in Africa are considered to be old or very old. Nearly 45 % of aircraft are more than 15 years old. 20 % are between 10 and 15. 13 % are aged between 5 and 10. Around 22 % are less than 5 years olds (figure 2.5). The average age of the fleet is comprised between 16 and 20 years old. A large proportion of aircraft still operated are aged over 25 and even 30. These aircraft are largely fuel inefficient. Figure 2.6: African fleet annual utilization
2500 2000 3000 1500 1000 500 0 (Flights Hours per Aircraft) Fleet age (Years) 45 40 25 20 35 30 5 0 15 10 TP20 TP35 J35 J44 TP50 J50 TP70 J70 J80 J100 J120 J150 J175 J250 J>300 African annual fleet utilization African Fleet Average Age Source: Ambraer, 2006 The average annual utilization is 1167 hours per aircraft. There is a strong correlation between fleet utilization and fleet age (Coefficient of correlation equal to «- 0.8»). Figure 2.7: African fleet Evolution from 2003 to 2023
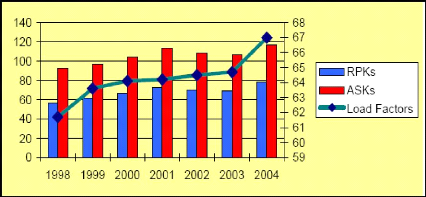
392 Growth 309 Replaced 332 Stay 60 641 aircraft 701 Source: Airbus, 2005 Airbus estimates that African airlines will take delivery of about 641 new aircraft to replace the current fleet or to sustain growth (Figure above). 2.3.4 Performance Figure 2.8: RPK, ASK (Billion) and Passengers load factors in Africa
Source: AFRAA, 2005 Load factors, RPK and ASK are improving. But the overall industry's health remains critical in Africa. Load factors may look remarkably high, but they highlight the airlines' dilemma in the African operating climate. The problem is that break even load factors remain higher. Financial Performance A sample of 8 airlines serving ASECNA region, comprising South African Airways, Royal Air Maroc, Ethiopian Airlines, Kenya Airways, Air Mauritius, Bellview airways, and Tunisair, made a net profit of over $200 million in 2005 (AFRAA, 2005, p.4). These are encouraging and remarkable results in a world where airlines made huge losses in the recent past But they do not reflect the real picture of the industry's performance. Most airlines, some very small, some bigger, are facing serious difficulties. Excessive debts, uncoordinated operating networks, liquidation, bankruptcy, are examples of discrepancies generally observed (African Union, 2005). Airlines post very poor financial results. The issue of profitability is crucial in the region: as the market is narrow; it is difficult for local airlines to raise the necessary investment required by the standards of modern airlines. These airlines often operate the same routes. That competition leads to a price war resulting merely in weakening the economic health of these companies which have difficulties in covering their operating costs. Air Afrique6 best represents the airline industry's situation in the area. Air Afrique officially lost 194 million dollars between 1984 and 1996. It almost never made significant profit. In 2002, after years of financial crisis, the 11 states that owned the pan-African airline decided to file for bankruptcy. The Bankruptcy came after the failure of a restructuring plan brokered by the World Bank. The Yaoundé treaty countries have revised their national carriers by designating them as the flag carriers. But they are left under the control of private interests, like Air Ivoire, Air Senegal International, Toumaï Air Chad... etc. Cameroon Airlines and Air Gabon, once the two leading carriers in the region, are now being liquidated or privatized. High Fuel prices Fuel price is constantly rising. Fuel represents on average 25
per of operating costs. One 6 Air Afrique was established in 1961 to provide passenger and cargo service within the 12 West African Nations of Benin, Burkina Faso, Central African Republic, Cote d'Ivoire, Congo, Mali, Mauritania, Niger, Senegal, Chad, Togo & Guinea Bissau. expected to last. These sky-rocketing fuel prices are devastating the industry. As airlines are struggling to improve their bottom lines, fuel efficiency is critical. Figure 2.9: Trend in Aviation fuel cost
Source: Airbus, 2005 Yields and Unit Costs Figure 2.10: Yields and Unit costs in Key markets 14,0
Europe Southern Europe Western Within Europe North Atlantic Africa Africa Yield Unit Cost Yield Cost Margin
Source: Airbus, 2005 Yields are declining and the margins remain low. The Southern Africa - Europe market has the lowest unit cost but also the lowest yields, and the lowest margins. Europe - Western Africa is a healthy market for efficient airlines, mainly European, with relatively high yields. Yields are also low in the domestic market. The industry is not expecting a significant improvement of yield. Most African airlines are inefficient. This results into high unit costs as the figure below shows it. These airlines possess old fleets which are highly oil-consuming. High unit costs reflect low aircraft utilization rates, high maintenance, rental and insurance costs. High air navigation and airport unit costs reflect their old avionics, and their low aircraft utilization. Figure 2.11: African Airlines 7 Operating costs (Unit cost $ per tonne per Km) 0,5 0,4 0,3 0,2 0,1 0 0,6
Fuel & Oil Flight Equipment Airport and Navigation Charges Avg inefficient Airline Avg Efficient Airline Avg Efficient Worldwide
Source: Airbus, 2005 7 Flight Equipment comprises maintenance, insurance, and rental. The others operating expenses are not mentioned here. But it's interesting to note that administration unit costs for non efficient airlines are extremely high, almost twenty times higher than an efficient airline' unit costs. 2.4 Regulatory In the absence of valid local carriers, ASECNA states have liberalized their skies because bilateral agreements (Principle of reciprocity) are no longer functioning. Although the deregulation process is on the way, with the ongoing implementation of the Yamoussoukro8 liberalisation decision, the open sky agreements, civil aviation codes are still obsolete and not harmonised. Texts on competition are not fully applied: Current regulations impose restrictions over the number of operating airlines, and frequency and capacity. Western carriers want more liberalization, and would like to see the process speeded up, as they are in a position to dominate the market further. 8 Ivory Coast, 1999 2.5 Air Travel demand 2.5.1 Traffic figures Africa accounts for about 3% of global air traffic in term of Passenger Kilometres performed (African Union, May 2005). Figure 2.12: Regional share of global international scheduled air passenger traffic
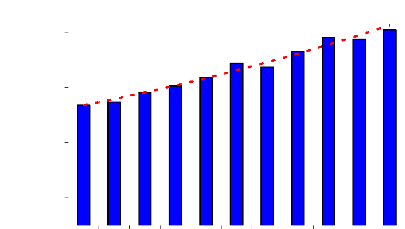
Europe Latin America and Caribbeans North America Middle East Asia Pacific Africa 587,998 (29%) 132,934 (7%) Percentage share by region 354,353 (18%) 64,326 (3 %) 88,027 (4%) 785,828 (39%) Source: UNESCAP, 20059 This situation reflects its low income, and the lack of air transport infrastructure. This being said, the situation of air transport in Africa is not uniform. It varies from one region to another. Northern, Southern and Eastern Africa's air transport performance is good (Kenyan airways, South African, Ethiopian and Royal Air Maroc). ASECNA area remains in a difficult situation with less traffic and unreliable structures. ASECNA's figures show that the region generates about 7 million passenger traffic per year (2003), which is below what South Africa alone represents in term of annual air passengers. 9 United Nation Economic and Social Commission for Asia Pacific Propensity to travel Given the low level of incomes, and the widespread of poverty across the region, the propensity to travel is very low. Moreover, the tariffs are «very high», 20 to 30% higher than the rest of the world according to the African Union. High air travel fares reflect the low level of traffic, and limited load factors in most of the routes. Moreover, there are little frequencies between city pairs. That increases aircraft operating costs. Passenger Traffic10 Figure 2.13: Evolution of passenger traffic (1994-2003) 1994 1995 1996 1997 1998 1999 2000 2001 2002 2003 (Year)
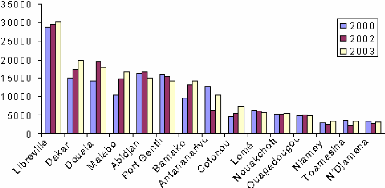
8,0 7,3 (Million Passengers ) 4,0 6,0 5,0 3,0 2,0 0,0 7,0 1,0 4,0 Source: ASECNA, annual reports (1994-2003) Passenger traffic has grown by about 75% from 1994 to 2003, increasing from about 4 million to around 7 million in 2003. This evolution is due to a sustained economic growth on the continent and worldwide. Traffic recovery is particularly significant in some countries. After recent political unrests in Madagascar and Congo, passenger traffic in main airports grew respectively by 70 and 17 per cent between 2002 and 2003. The increase of figures in the region is also driven by oil- related activities in Chad and 10 Ässengers Traffic in ASECNA main Airports Equatorial Guinea. The construction of the pipeline between that country and the oceanic coast through Cameroon has stimulated traffic. Passenger Traffic by Airport Figure 2.14: Average Airport Passenger Traffic (2000-2004) Dakar (Senegal) Abidjan (Ivory Coast) Libreville (Gabon) Douala (Cameroun) Brazzaville (Rep Congo) Antanarivo (Madagascar) Pointe Noire (Rep Congo) Bamako (Mali) Malabo (Guinea) Port Genrtil (Gabon) Cotonou (Benin) Yaounde (Cameroon) Ouagadougou (Burkina) LOME (Togo) Nouakchott (Mauritania) Ndjamena (Chad) Niamey (Niger)
787 700 500 484 1336 0 200 400 600 800 1000 1200 1400 1600 (Thousand Passengers) Source: ASECNA, annual reports (2000-2004) Among the main airports, Dakar airport is the first in the region with more than 1 million passengers per year. It's has been the fastest growing airport in term of passenger volume. The important tourism activity in Senegal is the major factor that explains this performance. The traffic is globally increasing in other airports. Secondary airports in ASECNA receive insignificant passenger traffic and are often served by very small aircraft. Domestic passenger traffic Domestic markets are particularly poorly developed across the region. People tend to travel by road or rail despite the poor state of the network. Only the elite, and business men who can afford it, use air travel to move within countries. Only Gabon has a relatively developed domestic market with more than 340,000 passengers in 2003 (Bergonzi, 2006, P7). Regional passenger traffic While regional traffic has significantly increased within the other African regions, it has stagnated in West and Central Africa from 1994 to 2001. Political trips, seminars, regional emigration and business travels are the main drivers of regional traffic. However, the mobility from one country to another remains extremely difficult. It's sometimes easier to reach another country within the region through Paris for instance. On the 276 regional city pairs, only 5 per cent of them have 150 passengers per day (table below). The busiest city-pair is Abidjan - Dakar.
Table 2.3: Daily passenger traffic between city
pairs. The most frequent connections in ASECNA are: Dakar-Bamako, Dakar-Abidjan, Bamako-Abidjan, Douala-Libreville, and Cotonou - Pointe Noire. They all have more then 100,000 passengers per year. Dakar and Abidjan are the two destinations with the highest regional passenger traffic, performing respectively 350000 and 200000 passengers per year (OEDC, 2005). Dakar has 15 direct links with others regional cities and Abidjan is directly linked to 12 others West African cities. The heaviest traffic flows are the Gulf of Guinea (Abidjan-Accra-Lagos corridor), then the Dakar/Abidjan axis. The lack of air links in the Central and Western regions is at a damaging situation with the presence of a number of landlocked states (e.g. Congo, Central African Republic, Chad, Mali, Niger), where aviation is needed most. International Passenger traffic Almost 50% of passenger traffic (6 million out of 11 in 2003) in western and central Africa is international. Traffic at major airports in ASECNA is presented in table below.
Table 2.4: International traffic at major regional
airports (Thousand). In international traffic, for the West and Central Africa region, and particularly in ASECNA, the dominant connection is towards Europe. This traffic can be divided in 3 groups: The ethnic Passenger Group, who has ties with the former European colonial powers, France mainly, creates a natural emigration of workers in both directions (South-North, North-South). The Leisure and Tourism group, concerns high-income people who travel to Europe, America or Asia for reasons such as shopping, Visits to family and friends. The Business travellers, because of economic ties with Europe, and oil companies are also important drivers for air traffic in the region. A large part of the traffic is also due to governmental, non-governmental and international bodies' staff. Traffic towards the Middle East is increasing, mostly due to
the attraction of Dubai and due to the dynamism of Maghrebian airlines, which take a large share of the 6th freedom11 traffic departing from Paris to ASECNA. There is also a significant traffic between African sub regions and ASECNA, mainly towards South Africa. Traffic towards the United States of America is carried out essentially via Europe. Cargo Traffic Figure 2.15: Evolution of Cargo traffic (1994-2003)
1994 1995 1996 1997 1998 1999 2000 2001 2002 2003 (Year) (Thousand Tonnes) 134 180 160 140 120 100 80 60 40 20 0 98 Source: ASECNA, annual reports (1994-2003) Freight traffic has regularly increased from 1994 to 2000 due
to economic upturn. The 11 The right to carry passengers or cargo from a second country to a third country by stopping in one's own country. main cargo airports (Pointe Noire and Brazzaville in the republic of Congo). But overall cargo traffic has increased by nearly 37 per cent since 1994. 2.6 Conclusion The aim of this chapter was to introduce to ASECNA's air transport industry, and to find out its main characteristics. This is what was found. 1. ASECNA region is characterised by under development and extreme poverty 2. Air Transport infrastructure is in a bad state or is largely insufficient and the substitutes to air transport are poorly developed. 3. The airline industry is very weak, and mostly composed of small aircraft
4. Air travel is still constrained
5. Some changes are being observed
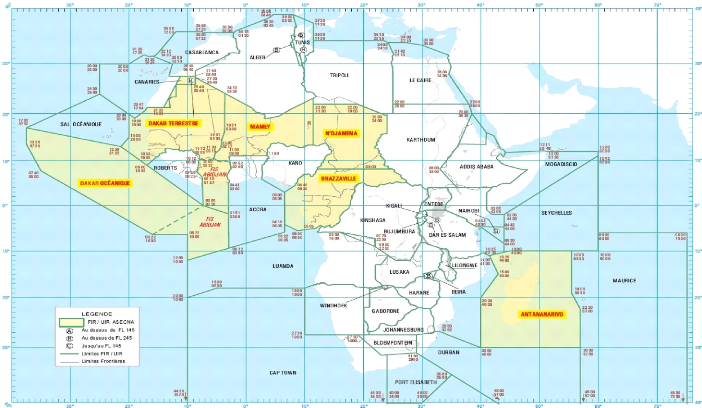
What do these characteristics mean for air navigation service provision and for ASECNA? The poor development of air transport substitutes means air transport is crucial to ASECNA region and should be among the priorities. In order to develop safely and orderly, the region's air transport industry needs a reliable air navigation infrastructure and an adapted air navigation service provision. Air transport cannot develop without these conditions. Airlines facing difficulties need to improve their efficiency to mitigate the effects of high fuel costs. With the very low level of yields on the domestic markets and on some international routes, and given the ultra competitive environment in a limited number of profitable routes in ASECNA, it is unlikely that there is significant scope for a recovery in the yields in the next years. Airlines are going to renew their assaults on costs according to African Airlines Association (AFRAA). These include flying the shortest routes, carrying optimum of fuel, cruising at optimum speed, minimizing flights at low altitude during descend and climb. Therefore ASECNA must deliver enough capacity and airspace flexibility to its customers But efficiency also means that ASECNA must deliver a cost effective service provision. These airlines' fleets are often very old. Ageing fleet means they are unable to cope with technological advancements and automation of security and safety systems. However the fleet renewal expected by manufacturers means higher speeds, and increased speed variability in ASECNA's airspace. The predominance of foreign carriers in ASECNA means the agency must pay attention to their requirements as well as those of local airlines. The liberalisation process and the growth of economies in the region will have a positive impact on competition and on air travel. ASECNA must anticipate these mutations, and their foreseeable impact on the air navigation system, and articulate its strategy to match the other exigencies mentioned above. Chapter 3 : Air Navigation Performance review The aim of this chapter is to analyse the performance of ASECNA's air navigation system, and to find out the current system's shortcomings. Figure 3.1 shows the region's Flight Information Regions (FIRs). 3.1 Introduction The agency controls an area 1.5 times as large as Europe. The region is characterised by the presence of large inhospitable areas: Oceans, Deserts, and Forests. The area is divided into 6 Flight Information Regions (FIRs): Antananarivo, Brazzaville, Dakar Oceanic, Dakar Terrestrial, Niamey, and N'Djamena1. The airspace is divided into lower and upper zones. The FIRs encompass Terminal Control Areas (TMAs) or Upper Control Areas (UTAs) as required by ICAO. ASECNA ensures the control of air navigation flows, aircraft guidance, the transmission of technical and traffic messages, airborne information. ASECNA delivers terminal approach aids for the region's 25 main airports2, as well as for 76 secondary airports. This includes approach control, ground aircraft guidance and movements, radio aids, and fire protection services. The agency also gathers data, forecasts, and it transmits aviation weather information. Theses services are delivered for en route, terminal approach and landing phases of flights. 3.2 Airspace organization 3.2.1 Description of ASECNA's FIRs Dakar's FIRs They are located in western Africa. A large part is constituted
of inhospitable desert 1 These cities are respectively the capitals of the following countries: Madagascar, Congo, Senegal, Niger and Chad. The Senegalese FIR is divided into an Oceanic FIR and a terrestrial FIR. 2 Douala, Port Gentil, Mahajanga, Garoua, Malabo, Bamako, Bangui, Ouagadougou, Gao, Brazzaville, Bobo-Diolasso, Niamey, Pointe Noire, Nouakchottt, Dakar, Abidjan, Nouadhibou, N'djamena, Cotonou, Toamasina, Sarh, Libreville, Ivato, Lome. classified Class G and F3 and D airspaces. The lower limit is flight level 245 (FL 245). There are about two dozens Prohibited, restricted and dangerous (P.D.R) zones in the area. The situation is critical above Ivory Coast where three large PDRs areas are located next to Abidjan's TMA. Dakar's FIRs are bordered by the Following FIRs: Atlantico SBAO, SAL, Canaries, Alger, Accra (Ghana) and Niamey (Niger). Sierra Leone, Guinea and Liberia manage Roberts' FIR, which is a dismemberment of Dakar's FIR. There are one Area Control Centre (ACC) in Dakar and one Flight Information Centre (FIC) in Abidjan. N'djamena's FIR It covers Chad and partly Cameroon, CAR, and Niger. The Airspace is classified G. The FIR is bordered by Khartoum's FIR in Sudan, Kano's FIR in Nigeria, and Tripoli's FIR in Libya. One ACC manages the airspace. Niamey's FIR It is located in Western Africa and largely covers an inhospitable desert area. The airspace is classified class G. The lateral and vertical limits are equivalent to those of Dakar's FIR. The FIR divided in two parts: East and West. It is bordered by Kano in Nigeria, Alger, Khartoum in Sudan, Tripoli in Libya and N'Djamena in Chad. One Flight Information Centre controls the airspace. Brazzaville's FIR Brazzaville's FIR (Congo) occupies a central position, between eastern southern and western Africa. The land below the airspace is an inhospitable virgin forest. The lower limit is FL 245. The Bordering FIRs are Kano, N'djamena; Kinshasa and Kisangani in Democratic Republic of Congo (DRC), Khartoum, and Luanda in Angola. One FIC manages the airspace. 3 Typically Class F Advisory airspace is designated where activities such as gliding, parachuting, high traffic training areas, and military operations take place and it would be of benefit to aircraft operators to be aware that such activities are taking place there. Antananarivo's FIR Antananarivo's FIR is in the trans-Indian ocean area, interfacing with the Asia pacific region, where there is high density traffic. The airspace is classified G, and the horizontal limit is FL 245. The Neighbouring FIRs are Maurice, Seychelles, Durban in South Africa, and Beira in Mozambique. One FIC manages the region. 3.2.2 Fragmentation FIRs in ASECNA do not strictly follow the contours of national boundaries, and the delimitation of these FIRs is generally in line with operational requirements. Brazzaville's FIR for example regroups partly or entirely 5 countries: Cameroon, Congo, Equatorial Guinea, Gabon and a part of the Central African Republic (CAR). N'djamena's FIR regroups Northern Cameroon, Chad, Northern CAR, and Eastern Niger. Niamey's FIR is composed of Niger's airspace, Eastern Mali, and Burkina. However, the neighbouring airspaces are managed by different countries: as said earlier, Sierra Leone, Guinea, and Liberia jointly control their airspaces. Ghana manages its airspace and that of Benin, Sao Tome and Principe and Togo from Accra's FIR. Cape Verde has an extensive oceanic airspace called Sal FIR. Nigeria's national airspace is composed of two FIRs: Kano in the North and Lagos in the South. Algeria, Morocco, Libya, Sudan, the DRC and South Africa also manage their own airspace separately. Aircraft that fly from one airspace to another have to switch to the local frequency. This goes along side with varying requirements and procedures from region to region, and proliferation of ATC systems and technologies according to national and regional considerations. That fragmentation is an important cause of inefficiency, in term of cost-effectiveness and productivity. It contributes to the multiplication of fixed assets and costs, as well as to higher coordination and transaction costs:
Figure 3.1: ASECNA'S FIRs
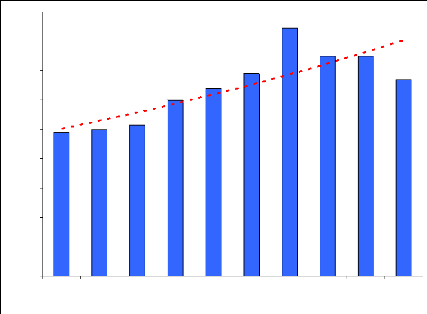
3.3 Traffic Figure 3.2: Number of flights from 1993 to 2003 1993 1994 1995 1996 1997 1998 1999 2000 2001 2002 2003 (Year)
(Number of Movements) 400 000 354 774 350 000 300 000 250 000 200 000 150 000 100 000 50 000 0 218 209 Source: ASECNA, annual reports (1994 - 2003) As defined by ICAO, air traffic is the number of aircraft flights operated in a given airspace. In 2003, more than 354774 flights were operated in ASECNA, which represents a 63 per cent increase comparing to 1993. This represents 646 aircraft movements every day. The growth has been constant, at an average yearly rate of 5.3 per cent (Figure 3.2). 3.3.1 Airport Activity During the last ten years, traffic in the region's airports has continuously grown. The number of aircraft movements has increased by 5.3 per cent per year on average. In 2003, international and local airlines' activity4 has increased, mainly driven by a noticeable economic recovery in the region, with a 3.1 per cent average growth (ASECNA, 2003) and between 4 and 5 per cent in 2004. 4 Air Madagascar, Air Senegal International, Air Mauritanie, Nouvelle Air Ivoire, Air France, Air Burkina SA, Societe de Transport Aerien Malien, National Airways Gabon, UTAGE, Afriqyah Airways, Afric Aviation, Air Excellence, West African Airlines. Figure 3.3: Number of aircraft movements at 15 key airports
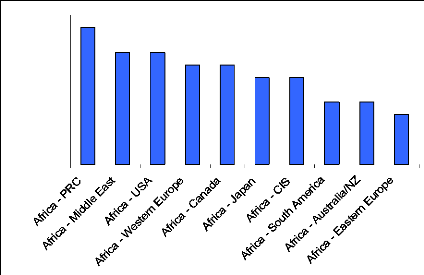
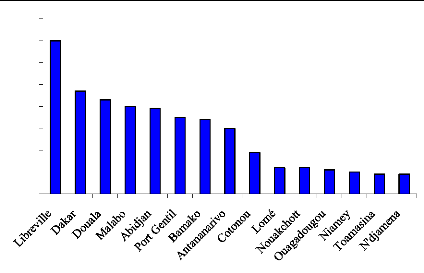
Source ASECNA, annual report (2003) Libreville is the busiest airport in the region in term of movements as Figure 3.3 shows it. Dakar and Douala are respectively second and third. Runway Capacity Runway capacity is often the limiting factor for airport capacity. The queuing theory indicates that smoother arrival flows allow increased throughput and reduced delay. It allows the trade off between capacity and delay to be improved. To maximise the use of runway capacity, it is essential to accurately guide aircraft at the final approach fix (FAF). There were about 18.66 aircraft movements per hour in ASECNA's airports from 2000 to 2003. Libreville's airport had 3.37 movements per hour, followed by Dakar and Douala, respectively 1.99 and 1.95. Six international airports had less than one movement per hour. Of course, these average figures do not take into account the variation of traffic. However, even during busy periods, the busiest platforms, like Libreville or Dakar hardly reach 9 movements per hour. The runway occupancy remains at very low levels. This clearly indicates that runway capacity is not an issue of concern in the region as it is in European or North American airports. 3.3.2 En route Traffic The main Airstreams The statistics from 2001 to 2003 indicate that the segmentation of en route traffic is stable, and is mainly composed of intra Africa activities, and flows between Africa and European countries (Table 3.1). The heaviest traffic flows are the Gulf of Guinea (Abidjan-Accra-Lagos corridor), followed by the Dakar/Abidjan axis and the North-South traffic flow. The East-West traffic is less dense. The traffic between European countries and the region which represents 25 per cent of all activities is driven by Air France-KLM. The activity is less important towards other parts of the world: Traffic towards the middle is low. Exchanges with America are relatively poor. However, routes between that part of the world and Europe go through ASECNA's FIRs (Figure 3.4).
Table 3.1: The main Airstreams in ASECNA
Table 3.2: Traffic by FIR Figure 3.4: Areas of Routing.
FIR Dakar FIR Brazzaville FIRs Niamey & N'Djamena Source: ATNS In Dakar's FIRs, major traffic flows are driven by airstreams from the Americas and Europe. The FIRS are involved in air activities between Europe and South America, and in the Atlantic Ocean interface between the North Atlantic, Africa, and South America regions. Input traffic also comes from the Coastal routes over the Gulf of Guinea and from Trans-Sahelian operations (Figure 3.4). Dakar's FIRs accounted for about 25 per cent of all ASECNA's traffic on average from 2001 to 2003. Niamey's FIR is mainly involved in Trans-Saharan traffic flow and Europe to southern Africa routes. These routes receive an important traffic due to the activity generated by South Africa mainly. Fourteen per cent of the traffic went through Niamey during the period considered. N'djamena's FIR's activity is mainly constituted of over flights from southern, eastern and central Africa. The area accounted for about 10 per cent of activities during the period. Traffic density is low. Brazzaville accounted for 27 per cent of flights during the period. A large part of traffic in Brazzaville's FIR comes from South Africa. En route Capacity5
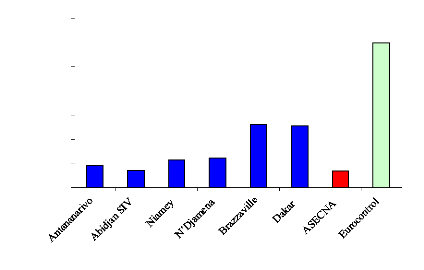
Table 3.3: Average traffic density from 2001 to
2003 Eurocontrol, Performance Review Reports (2001-2004) Dakar's ACC and Abidjan's FIC manage on average 227 flights per day, which is equivalent to 9.4 movements per Hour and 1 movement every 7 minutes. But this does not take into account the time and period distribution of flights. Brazzaville is the second busiest FIR as the FIC manages about 170 flights per day, which represents 7.1 movements per hour and one every nine minutes. About 67 flights are managed by N'djamena's ACC each day, representing 2.8 flights per hour and about one flight every 21 minutes, In Antananarivo, on average, 91 aircraft movements are managed every day, 3.8 flights per hour, and 1 every 17 minutes. Traffic density in ASECNA is very low when compared to the level of traffic in Europe. 5 The average number of flight per day and per are obtained by dividing the number of flights per year by 365. 6 Air Traffic Controllers (2004 figures). Controllers' Productivity Productivity is defined as the average number of aircraft controlled per hour per air Traffic Controller (ATCO). It is calculated by dividing the total number of aircraft movements in the FIRs by the total number of ATCOs. A better way to measure productivity would have been to measure the number of flight-hours controlled per controller-hour in duty, but the data were not available. Eurocontrol's figure is derived from the average flight-hours controlled per ATCO-Hour in duty, and annual number of IFR flights and the number of flight-hours. The average flight-hours controlled per controller-hour in duty was 0.8 (Eurocontrol). There were 12.2 million flight-hours and 8.9 million IFR flights in Europe in 2004. This means 1.37 Hours per flight on average. Therefore, each controller controls 0.8 divided by 1.37 (0.583) flight per hour. Figure 3.5: Average flights controlled per hour and per controller in ACCs
0.7 0.6 0.5 0.4 0.3 0.2 0.1 0.0 (Control Centres) ATCOs' productivity in ASECNA varies from one ACC to another. The busiest ATCOs are those of Dakar and Brazzaville. Each air traffic controller controls on average 0.1 flight per hour in ASECNA, whereas the equivalent figure is about 0.6, which is 6 times higher. 3.4 Delays Air transport delays are given by the scheduled departure and arrival times. Delays can be broken down by phase of flight. When traffic demand is anticipated to be higher than the actual ATM capacity in en-route control centers, or at the airports, Air Traffic Units may apply Air traffic Flow Management (ATFM) regulations. This means that airplanes subject to that regulation are held at departure airports. The AFTM delay is then allocated to the busiest ATC unit. In ASECNA, delays are almost never the result of Air traffic services. Except during bad weather periods, the totality of delays is due to airlines' preflight operations. There is no ATFM unit like in Europe for instance (Ngoué Celestin, Head of Air Navigation, ASECNA). Many airlines managers confirmed that reality, which is also corroborated by the availability of sufficient airspace capacity. 3.5 Impact of future trends 3.5.1 Prospects All aircraft manufacturers (Boeing, Airbus...) or airlines organisations (IATA, ICAO) use roughly the same methodology for assessing long term traffic forecast. It is based on the assumption that long-term demand for air travel is driven by economic developments, notably the growth of world and regional income levels. Figure 3.6: Projected traffic growth over the next decade
Percentage 4,8 4,6 4,4 4,2 5,2 4 5 Source: Boeing, Airbus, ASECNA, IATA. Western and Central Africa countries economies are expected to grow at an average pace of 4.5 per cent during the next decade according to African bank of development (BAD). It can be assumed that air travel and air traffic are going to follow that pace. Depending on the industry's estimate taken into account, air traffic will grow in Africa between 5 and 7 per cent over the next 15 years. ASECNA expects even a 7 per cent growth. However, Africa's overall share of traffic is expected to decrease to 2 per cent instead of the current of 3 per cent. The average growth rate for the next 15 years is 5 per cent yearly. This means there will be about 737550 flights in ASECNA by 2020; traffic will have doubled. 3.5.2 Impact on Runway Capacity With the projected growth rate, there would be about 41 landings or take-off each hour in all ASECNA area airports. If the relative importance between airports does not change, Libreville will handle around 7 movements per hour followed by Dakar and Douala with respectively with 4.7 and 4.3 operations per hour on average (Figure 3.7). Comparatively, the busiest hour at London Heathrow in 1999 saw 93 movements per hour on the airport's two runways. Figure 3.7: Projected Runway Occupancy in main airports (flights per hour)
0 8 7 6 5 4 3 2 1 Source: ASECNA, compiled from annual report 2003. 3.5.3 Impact on en route Capacity
Table 3.4: Average traffic density by 2015 ASECNA's FIRs would receive about 1342 flights per day (56 per hour). It is insignificant when compared to Europe's records, 30,000 flights per day, and one operation handled every 3 seconds (CFMU, 2005). Controllers' productivity Figure 3.8: Projected Controllers' productivity in 2015 0.6 0.5 0.4 0.3 0.2 0.1 0.0
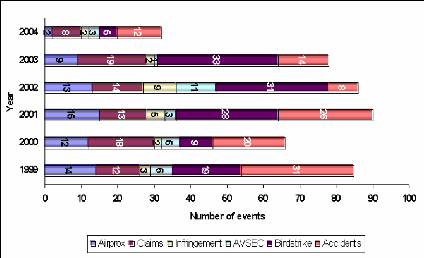
Controllers' productivity would remain lower than European controllers' 2003 record. 3.6 Traffic complexity A good analysis would require additional data such as flow structure (horizontal intersection per miles), traffic mix (standard deviation of aircraft speed), and traffic evolution (number of flight level changes per miles, horizontal intersection per miles). These information were not available. However, traffic density is low and will remain so in ASECNA. All the busiest routes are north and south bound. These routes generate the highest levels of passenger traffic. They link major local airports to Europe. Domestic traffic is inexistent and East-West routes are not really busy, except the golf of Guinea corridor, and routes between certain capital cities. But, seasonally, during the pilgrimage period, routes towards Saudi Arabia (East-West) cross major North-South traffic flows, and create convergent points generating traffic complexity (Samake Wodiaba, ASECNA). The projected growth suggests that traffic complexity is going to increase as east-west flows are going to grow faster than north-south operations. 3.7 Safety Safety is the prime objective of ATM. In ASECNA's safety reports, events are composed of 6 elements: Air proximities (Airprox), users' claims, Aviation security, Bird strikes and Accidents. The period considered goes from 1999 to 2004. 2004 figures in the chart below are only partial data. 3.7.1 Air Proximities An airprox is a situation in which, in the opinion of a pilot or a controller, the distance between aircraft as well as their relative positions and speed have been such that the safety of the aircraft involved was or may have been compromised. The number of Air proximities is constantly high with regard to the low traffic density in ASECNA. Figure 3.9: Evolution of Air proximities
250 275 300 325 350 Number of flights (000) Source: ASECNA, annual reports (1999-2003) The situation seems to improve with the increase of traffic (Correlation between the number of air proximities and traffic figures is equal to «-0.8»). This may reflect a better surveillance and communication capability in the region. The number of safety-related events seems to vary significantly between ASECNA's regions. Central Africa concentrated 50% of total events during the year 2004. It is not clear whether or not this is due to differences in reporting practices, or the concentration of traffic on certain corridors not properly furnished with surveillance means. Figure 3.10: Evolution of incidents during the last six years
Source: ASECNA, (unpublished document). 3.7.2 Users' claims Users' claims accounted for about 20 per cent of reported events. These are made by airspace users. ASECNA statistics do not tell if every claim is investigated. It's likely that many are purely ignored, due to the lack of mean to conduct an efficient investigation. 3.7.3 Birdstrikes Birdstrikes are very frequent in ASECNA. 28
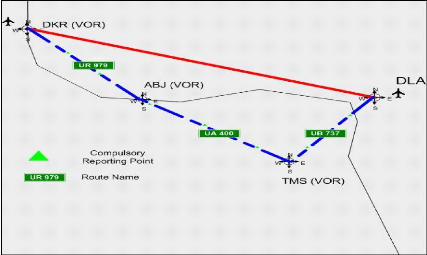
per cent of incidents during the period Accidents reported are not always related to air navigation events. They nearly constitute 26 per cent of events. Most of them occur on the ground, at major or secondary airports (runway incursions). The figures presented on Figure 3.10 are probably optimistic as many accidents or incidents are not reported at all, particularly at remote airports. 3.7.4 Safety Review System Four features are essentials to make incident reporting useful for accident prevention and safety management: 1 A reliable, timely and large enough information flow 2 Data analysis 3 Severity Classification 4 Exposure of the data For every incident assessed ASECNA determines one or more causal factors. These tell the agency why events started in each instance and signposts the lessons to emerge. ASECNA has safety committees that perform that job. It is self evident that attention paid to the cause of an accident is worthwhile because it is likely to deliver and promote better prevention and to establish the responsibilities. ASECNA is often responsible for safety related events. But the agency does not seem to systematically investigate incidents, and information on safety data is hardly available. When it is, it's not adequately classified. 3.8 Efficiency 3.8.1 Flight efficiency Flight efficiency is the next key performance Area considered in this study. Flight efficiency has implications for fuel burn, pollution and its environmental impact. Flight efficiency has horizontal and vertical components, which can be split into en-route and terminal flight phases. The report focuses on en-route flights. Insufficient information is currently available to address vertical flights efficiency. Moreover, it has not been possible to study the most «constraining points7» in ASECNA.The safest routes in ASECNA are controlled routes. These routes are equipped with ground based navigation aids pilots have to follow. That compulsory process increases routes length and reduces flight efficiency. Major routes link South Africa to Western Europe. Aircraft have to go through Brazzaville, Niamey or N'Djamena. To go from Douala (DLA, Cameroon) to Dakar (DKR, Senegal), pilots have to use the following routes:
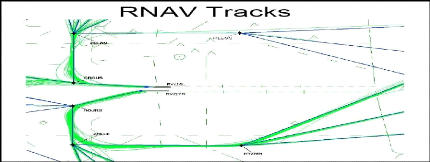
Figure 3.11: Flight Paths between Douala and
Dakar.
3.8.2 Fuel Efficiency The fuel efficiency of an airline is determined by many factors. Some are directly under airlines control, others are not. The later are related to market, technology, and infrastructure. 7 The most constraining point is the point along a trajectory that contributes the most to the additional distance. This point generates additional costs. Figure 3.12: The different phases of a flight
Source: Mitre Corporation To illustrate this requirement of fuel efficiency, the following is an estimation of extra costs related to flight inefficiency on the route Douala (DLA) - Dakar (DKR). Only the cruise portion of the flight is considered. The aircraft operated is a B737-3008. Its seat capacity is 140 and range is 4320 Km. The range is chosen such that the effect of load factor that have an influence when the aircraft is operated at the limits of range can be neglected. The fuel consumption for a B737-300 is estimated at 26 g/ seat.km (Japan Airlines, 2005). Most of the aircraft weight is then considered to be fuel and hull. We assume that the flight altitude on the cruise portion is 32800 feet, and the weather condition are ideal, and the traffic is not complex and does not generate holding patterns. The cruise speed is supposed to be constant at 815 km/h. The descent starts about 100 km from each airport. The Descent phases of flight (Vertical profile) and the taxi times are not considered, although we already know that efficient approach operations allow fuel saving. The Fuel Density is 800g/litre; and the current spot fuel cost around the world is about US$1.80 / US gallons. 8 Details from (Air Charter International, 2005) Conventional Flight (Following ground Navigation aids) Distance Flown during the horizontal profile: 3640 Km - 2*1009 = 3440 Km Seat.Km: 512560 Fuel Burn: 13327 Kg, which is equivalent to 16659 litres, and 4401 US gallons10 Fuel cost: 7922 US$ Direct Flight Distance Flown during the horizontal profile: 3211 Km - 2*100 = 3011 Km Seat.Km: 448639 Fuel Burn: 11665 Kg, which is equivalent to 14582 litres, and 3853 US gallons Fuel cost: 6936 US$ Comments The difference in term of Fuel consumption is about 2077 litres, 12.5 per cent. The savings on the horizontal profile only would be about 986 US$. For 6 legs per week, the total reduction in fuel cost is 5916 US$. Assuming continuous operations without disruptions during the whole year, the savings would be 307,632 US$ on that single route. But a large part of fuel inefficiency also lies on the problem of aircraft age. Old aircraft generally consume more fuel than newly built ones as shown in chapter 2. Flying the direct route would also free 164 hours during the year that a company could use to improve aircraft utilization. But this would depend on the slot structure at the served airports. Beyond the improved aircraft economics, the positive impact on environment is also substantial. On this case, the reduction in Carbon Dioxide (CO2) emission would be about 1815 tonnes11 during the year. 9 We assume that that the descent phase begins 100 Km before the airport 10 1 USGAL = 3.785412 Litres 11 1 Kg of fuel burn produces 3.5 Kg of CO2 (Japan Airlines, ) 3.9 Cost effectiveness 3.9.1 Navigation charges Figure 3.13: Evolution of Air Navigation charges (Unit Rate) in ASECNA (Euros)
DOMESTIC FLIGHTS REGIONAL FLIGHTS INTERNATIONAL FLIGHTS
1999 2000 2001 2004 2005 2006 Source: ASECNA ASECNA's current charging policy is as follows: Charge for use of en-route facilities and services managed by the agency are payable whatever are the conditions in which the flight is accomplished (IFR or VFR) and whatever are the departure and the destination aerodrome. Charging varies depending on the nature of the flight (national, regional, international). For regional or domestic flights, users pay a fixed price. For international flights, users pay a price that varies with the weight of the aircraft and the distance flown. From 1999 to 2005, charges for international flights increased by 40 per cent. But, the price is stabilized since 2004 thanks to an agreement with IATA. The price of regional flights is being reduced since 2001, and the price of domestic flights is stable. 3.9.2 Air Navigation Services Costs Evolution of Costs12 Figure 3.14: Personnel, ANS and Transport costs from 1996 to 2003
Costs of Personnel Cost of ANS Other Costs Cost of Transport
Source: ASECNA, annual reports (1996 - 2003) The costs of personnel represent more half of total costs. They have increased continuously since 1996. ANS and personnel costs accounted for about 80 per cent of expenses in 2003, and their share is stable. Transports costs are stable. 12 ANS costs include supplies and materials. ANS personnel costs are included in personnel costs Figure 3.15: Evolution of the average cost per flight from 1996 to 2003 (Euros)
290 280 270 260 250 240 230 220 300 1996 1997 1998 1999 2002 2003 Trend Line Source: Compiled from ASECNA's annual reports (1996 - 2003) The average unit cost is increasing. The cost per flight was about 288 Euros in 2003. Unit cost has increased by 18 per cent on average from 1998 to 2003, which represents an annual increase of 3.6 per cent. On average, ASECNA's unit cost is the lowest as shown on the table below. But that figure does not reflect the exact reality, as domestic and regional airlines only paid a fixed price, whereas international flights are much more expensive. It means international airlines pay a much higher unit cost per flight. Nearly 80 per cent of these charges are paid by major western and international airlines (ASECNA, 2003).
Table 3.5: Average ANS cost per flight (Euros) in Europe ASECNA and the USA (2003) The totality of charges above is passed to users. En route revenues have continuously increased since 1996 by 11.6 per cent on average per year (Figure 3.16) 13 ASECNA's figure includes all personnel costs. ANS personnel costs were not available separately 14 357 dollars Figure 3.16: Evolution of En route revenues from 1996 to 2003 (Million Euros)
180 160 140 120 100 40 20 60 80 0 1996 1997 1998 1999 2002 2003 Source: ASECNA, annual reports (1996 - 2003) 3.10 Cooperation ASECNA cannot deliver a satisfactory service without interacting with other air navigation authorities in the region. The agency encircles large blocks of airspaces like Nigeria, and Ghana as described in chapter 2. It also shares common airspace borders with huge entities such as the Canaries, SADC, Algeria, Libya, Sudan and others. Nigeria has deep infrastructural deficiencies, which gave rise to the blacklisting of their airspace by some international organizations: Obsolete navigation and landing aids as well a collapsed surveillance system. The navigation and landing aids are not functional most of the time, the six terminal approach radar stations are broken down and air traffic control service are not provided to some en-route traffic (Nigeria Airspace Management, 2005). Figure 3.17: Regional Fragmentation of ATM sectors
Source: CANSO Clearly cooperation is needed between all these states to develop a seamless and cost efficient ATM system at a regional level. Harmonisation provides much of the answer. The region needs a plan to achieve common standards procedures and technology, and ensure interoperability between various systems. Multi-national cooperation among provider States and users are essential to minimize investment costs, ensure compatibility and avoid duplication of effort. Moreover, by agreeing on common technologies, ANSPs and state would increase their bargaining power when buying new systems. Trans-national bodies provide coordination (ICAO's AFI CNS/ATM regional Sub-Groups). But still, there are challenges in bringing the regulators and the governments to commit to an efficient air navigation system. African states, airspace users, ATC service providers, and equipments suppliers do not have the same motivations and benefits. Moreover, «different regulatory models, different regulatory requirements undermine moves towards harmonisation. Sovereignty issues, slowness in administrative and legislations procedures, differences in time frames, often contribute to delay advances in the system» (Yoro Amadou Diallo, ASECNA). 3.11 Training Traffic is growing and complexity is increasing. ASECNA needs to go hand in hand with changes. In Africa, many air ANSPs have unfortunately tended to invest in equipment but have hardly paid attention to the training needs of the human beings who must operate it. ICAO has established minimum standards for approved ATC training and has approved institutions in several African countries like in ASECNA. ASECNA trains part of its controllers in its own institutions it manages in Niamey, Niger. However, the total capacity of these institutions is less than 30 per cent of the total training requirements of Africa. Many African ANSPs are compelled to train their students in foreign ATC training institutions. Since there is a global shortage of air traffic controllers, most ATC training institutes outside Africa are fully booked to train their own nationals to meet local needs. In addition, training fees keep increasing as a result of growing demand. 3.12 Financing Figure 3.18: Financial results from 1994 to 2003
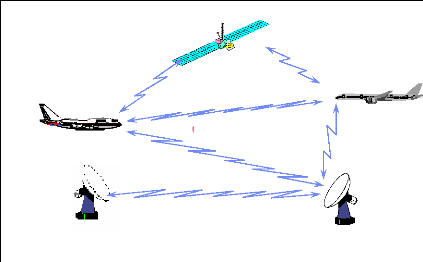
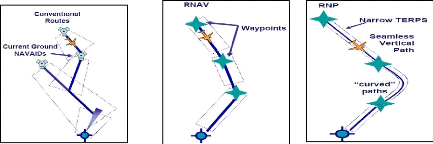
Operating revenue Operating Expenses Operating Result Operating ratio Million Euros % 40 80 60 20 0 180 160 140 120 100 1994 1995 1996 1997 1998 1999 2000 2001 2003 180 160 140 120 100 80 60 40 20 0 Source: ASECNA, annual reports (1994 - 2003) One of the major concerns for management of air navigation systems is the financial requirements for developing countries like in ASECNA. «Member states do not always have the means to finance air navigation infrastructure improvement as they have other priorities, such as health, education, poverty reduction» (M. Marafat, ASECNA). A survey conducted by ICAO's technical cooperation bureau estimated that 97 per cent of the least developed countries and 83 per cent of the developing states require technical and financial assistance to improve their air navigation systems (ICAO-Rio Conference 1998). ASECNA regularly posts good financial results. Its operating revenue almost doubled from 1996 to 2003, and its operating ratio is constantly very high (144 per cent on average during the last 10 years). 3.13 CNS and Aviation Weather Management issues 3.13.1 Shortcomings of conventional systems used by ASECNA It is recognised that current air navigation systems suffers from technical, operational and procedural shortcomings, which has serious economic impact on air transport community. These shortcomings amount to the following factors. Communications Despite recent improvements in ATC such as new radar scopes, voice switching systems, today's air traffic control primarily relies on a single tool to actually separate aircraft: a highly congested voice radio frequency. The current ATC system uses voice communications between air traffic controllers and pilots to relay instructions and other information critical to operate safely. These communications are necessary to support coordination of aircraft movements in all phases of flight, to ensure aircraft separation, transmit advisories and clearances, and to provide aviation weather services. Skies over international airports are made more dangerous by the lack of standardised terminology or proficiency levels in English for flight crews and air traffic controllers. Language confusion is a frequent cause of pilot error. Although English was made the common language of world aviation in 1951, miscommunication and crashes in which communication was a contributing factor are common. These include ambiguities and misnomers. Phrases are not derivations of a master plan as they should be. The inability of English to express specific instructions to pilots without confusion disqualifies it as a language for permanent use by aviation (Kent Jones, 2005). One speaker at a time: The voice communications link between controllers and pilots is similar to a conference call, with the controller and all pilots flying within an airspace talking over the same channel. This is very similar to ATC voice communications in congested airspaces. It is not unusual for pilots to key their microphone and accidentally "step on" the communication of other pilots or a controller. These are time consuming routine messages. They waste more time on the ATC voice channel as repeated attempts to communicate are made. This problem will only get worse as air traffic continues to increase. Each voice radio exchange takes a certain amount of time for the originator to transmit and the receiver to respond, and there is a point of saturation where a controller physically cannot fit in any additional voice radio communications. At this point, no additional aircraft can be handled within the controller's assigned airspace (Mitre-Caasd, 2005). Navigation Fixed airways: Airlines are currently required to plan their flights on the basis of a fixed route structure, which is largely defined by ground-based navigation aids. The fixed point-to-point route segments, indirect routings, which rely mostly on ground based navigation aids, are not the most efficient way of getting from one place to another. That limits enroute capacity and reduces efficiency. But it has been necessary because of the limitations in air traffic control technology (Department of Foreign Affairs and Trade, 2005). Range Limitations:The current system of land-based
navigation requires to over-flight as mentioned previously, that airways depend on the geographic location of navigation aids. Moreover, airways are like a highway system on the ground. Like the later, at intersections with crossing traffic, some aircraft can get stuck waiting for the «light to change» (holding). By creating airways independent of the geographic location of a ground navigation aid, those airways can be spread out. Spreading the traffic out increases capacity and safety (Zelechosky et Al, 2005). Large amount of airspace between each aircraft: Conventional air guidance systems on board the aircraft and are not precise enough. Therefore, Control centres have to maintain a 15 minutes horizontal separation between aircraft. As a result, there is a large amount of space is lost. Surveillance Basically, the surveillance systems presently in use can be divided into two main types: dependent surveillance and independent surveillance. In dependent surveillance systems, aircraft position is determined on board and then transmitted to ATC. The current voice position reporting is a dependent surveillance system in which the position of the aircraft is determined from on-board navigation equipments and then conveyed by the pilot to ATC by radiotelephony. Independent surveillance is a system which measures aircraft position from the ground. Ground-based separation assurance: The Separation ensures that an aircraft maintains a safe distance from other aircraft, terrain, obstacles. Capabilities include ground based separation functions on the airport surface and in the terminal, en route, and oceanic domains. New on-board systems such as the Traffic Alert and Collision Avoidance System (TCAS) can allow the pilot to execute an evasive manoeuvre. But all aircraft are not fitted with such systems, especially, local small airlines in regions like ASECNA area. Primary Surveillance Radar (PSR): PSR radars operate by radiating electromagnetic energy and detecting the presence and the character of echoes returned from reflecting objects. It is an active device using its own controlled illumination for target detection based on reflected radar energy. However, detection depends on radar cross-section and line-of-sight and it requires high energy transmission results in costly implementation on ground. The fact that the antennas rotate limits the detection to the beam direction and suppresses targets within the cone of silence. Moreover, PSRs offer no possibility to identify the target: It only allows detection. At last, it is very sensitive against reflections (clutter, sea, weather), and detection depends on a sufficient signal to- noise ratio. Secondary Surveillance Radar (SSR): SSR radars transmit coded interrogations to receive coded data from any aircraft equipped with a transponder. It provides a two-way data link on separate interrogation and reply frequencies. Replies contain either positive identification (1 of 4096) or aircraft pressure altitude. But they have similar drawback to PSRs' ones. Even the identification is only limited to 4096 codes, and they are subject to FRUIT (False Replies from Interfering Transmissions), Garble (reply overlap at the ground receiver) and over-interrogation (due to a high number of interrogators). All these reduce the probability of detection. Airport Operations Airport movements severely restricted during low visibility: During good visibility conditions the landing capacity of major airports is mainly limited by the final approach separation minima defined by ICAO, and that sequences accuracy and runway occupancy times. When the visibility deteriorates and becomes less than a certain limit the use of landing runways is stopped because pilots cannot maintain visual separation in case of simultaneous missed approaches for instance (Hans Offerman, 2005). Moreover, during these conditions, separation requirements between aircraft increase to avoid runway incursions. All this results into decreased «airport capacity» and increased controllers' workload. Aeronautical information and weather services (AIS) Disparate formats and standards: The objective of AIS
is to ensure the flow of is responsible for the information provided15. It is provided to pilots in face-to-face briefings at the aerodrome AIS unit, or in flight, through air traffic control. Communication of the latest information to users is effected through the aeronautical fixed telecommunication network (AFTN) in the form of notices to airmen (NOTAM). This information is however not already available in real time due to technical limitations. 3.13.2 ASECNA's systems' performance VHF coverage ASECNA area is 16,000,000 Square kilometres large. A VOR Beacon range is 240 KM. therefore the number of VORs necessary to cover the entire area is equal to 88.46. This means that to cover its entire airspace with VHF capability and makes it available for flights, 89 VORs are necessary. In 2003, ASECNA had only 60 in operation, which represents 68 per cent coverage of the area. But VHF technics that use VSAT (Very Small Aperture Terminal) and SATCOM technologies to extend the VHF coverage in inhospitable areas have improved the situation. Many VSAT have been installed in the region, and there are other projects under implementation. The most frequently used means for Aeronautical Mobile Service (AMS - air/ground and air/air communications) is the HF, which has an extended range but presents drawbacks and the VHF. These technologies operate well on the whole in ASECNA. But on the one hand, the VHF is increasingly used and has considerably improved; both from the point of view of quality and availability (Table 3.6 below), and on the other hand, the HF is still the only available mean in several sectors, like in the oceanic FIR, and large parts of the Sahara desert and forests. The Aeronautical Fixed Service (AFS), which ensures the
transmission of flight plans 15 Conventional aeronautical information services consist on the provision of hardcopy documents in the form of the Integrated Aeronautical Information Package (IAP), which contains information for the entire territory and also areas outside the territory for which a State is responsible for the provision of air traffic services. The information must be provided in a suitable form and must be of high quality, be timely and include, as necessary, aeronautical information of other States. In addition, pre-flight and in-flight information services must be provided. especially at main airports. The Fixed Service is often backed up, or replaced by the SITA16 network, a private network generally used by airlines.
Table 3.6: Equipments availability in 2003. Source: ASECNA, annual report, 2003 Transmission speed The requirement of a minimum modulation rate of 1200 bauds is not met by some main circuits. The following AFTN main circuits do not meet this requirement: Niamey /Addis Abeba, Dakar/Casablanca. Tributary circuits connected to the main centres of Brazzaville, Dakar, Johannesburg and Niamey have been upgraded to higher transmission speeds, while the outgoing main circuits are operated still at 50 baud. Use of analogue technology The level of digitalization is rather low: only 29 out of 65 circuits (44.3%) are digital circuits in the region, which limits the bandwidth and the data processing capability. Statistics show that the requirements of 5 minutes maximum for high priority messages and 10 minutes maximum for other messages are not met most of the time. Navigation The main navigational aids in the region operate fairly well.
However, many of them 16 Société internationale des télécommunications aéronautiques operational. All these ground facilities work towards providing safe navigation in the ASECNA. Navigation aids equipments' availability rate (95.9 on average) is below international standards (Table 3.6). Secondary airports do not often have Landing aids, and some international airports, like in Equatorial Guinea, do not posses such systems. Surveillance The use of radar is very rare in ASECNA area and in West Africa in general. The explanation given is that ICAO recommends that states should use radar only if the situation really warrants it. If this is taken as a rule, it would apply to the Gulf of Guinea States (Ivory Coast mainly). A secondary radar system has been undergoing tests in Abidjan for the past few years. Its official commissioning has been delayed because of a problem between the government and ASECNA. It has nonetheless proven very useful. As an example, recently, a few hours after a recent takeoff from Accra, an aircraft heading west realized that its navigation instruments were no longer functioning. It therefore decided to land in Accra, its point of departure. Soon after, it was seen on the Abidjan radar screens heading north. The Ivorian controllers were able to guide it safely to its final destination.
Table 3.7: Air circulation control: Controlled routes The absence of radar is strongly felt. Authorities are frequently informed of violations of their airspace by pilots who come across illegal traffic. They are also aware that aircraft operators can operate with impunity in their sphere of sovereignty, without their knowledge. This situation is mainly due to the large number of uncontrolled routes as shown in table 3.7. Only 81.3 per cent of routes are controlled, and most of them by conventional means of which limitations have been presented. It can be noted that all the routes in the oceanic FIR are controlled. These routes are used by airlines flying from South America to Europe. In spite of the absence of radar, ASECNA's air traffic services still provide the classic elements of control, which is to prevent collision between aircraft in the air and on the ground, and to speed up and regulate air traffic generally. Aviation Weather Table 3.6 reveals that MET equipments' availability rate (92.8 %) is below international standards. The performance of weather data collection systems are not better as shown in the figure 3.19 which represents the system's efficiency17 in June 2005. Only 68 per cent of TAF messages were received, and the figures are event lower for METAR messages, with 43 per cent success. Met stations' efficiency varies from 77 per cent to 100 per cent. These bad performances have to be link to the poor quality of transmission systems we presented earlier. 17 Number of messages received on-time divided by the number of messages due to be receive Figure 3.19: OPMET availability rate 350000 300000 250000 200000 150000 100000 50000 0
Metar required Metar received TAF required TAF received
Source: ASECNA, annual report, 2003 A large number of OPMET messages are received more than 15 minutes after their transmission. This impacts pilots and controllers' ability to quickly react in case of severe weather conditions. More than 40 per cent of weather irregularities are related to low visibility. Another 40 per cent are due to storms, and the others are windshears, strong winds, and rains. Pilots are often confronted to these conditions following inaccurate forecasts. Very often they have to engage deviation manoeuvres. Go-Around, Release, Landing delayed, half turn. These are extra fuel consuming operations for airlines. 3.14 Conclusion The aim of this chapter was to analyse the performance of ASECNA's air navigation system, and to highlight its shortcomings. Air navigation characteristics are as follows:
Chapter 4: CNS/ATM Systems and Concepts The aim of this chapter is to present the main CNS/ATM systems and concepts, and to determine suitable solutions for ASECNA, based on experimental performances and local characteristics. 4.1 Introduction The process of getting an aircraft safely and efficiently from its origin to its destination requires effective Air Traffic Management systems supported by three key functions: Communications, Navigation and Surveillance (CNS). The concept is based primarily on the following technologies: data link communications, digital aeronautical information services (AIS), the Global Navigation Satellite System (GNSS) and Automatic Dependent Surveillance (ADS). CNS systems are a set of technologies employing digital techniques, including satellite navigation systems, together with various levels of automation. These are applied to support a global Air Traffic Management system. The strategic vision is to foster a global ATM system that enableS airspace users (Aircraft operators), to better meet their schedules, and to adhere to their preferred flight profiles with fewer constraints. Of course, this has to be done without lowering the safety levels. These technologies will enable the transformation of air traffic management to provide for collaborative decision-making (CDM)1, dynamic airspace management, strategic conflict management, flexible use of airspace and all weather operations. The airline industry is looking for ways to improve its bottom-line profitability as shown in chapter 2. It is focusing its efforts on the need for change. One Sky, global ATM is the industry's vision of a global air navigation system that improves Safety and Efficiency whilst accommodating worldwide air traffic growth in an airspace that is 1CDM brings together airlines, civil aviation
authorities and airports in an effort to improve air traffic seamless and devoid of national borders. According to IATA, achieving this vision will result in a wide range of benefits such as, environmental benefits (Reduced emissions), and lower overall costs for the airlines through operational improvements, efficiency, avionics equipage and equitable user charges. Therefore, CNS/ATM systems are crucial to the industry, in their attempt to simplify the business, and to gain more freedom in the way they operate. ANSPs expect that better communications, navigation and surveillance systems will undoubtedly increase the level of safety. With the use of voice and data communications, satellite and precision navigation, SSR Mode S and ADS surveillance, and all the other new concepts, ANSPs will significantly reduce the hazards due to the use of conventional systems. A common digital aeronautical information exchange model is the industry's objective. The new systems make possible the sending of right information to the right user at the right time. Particularly, satellite technology and data link provide, where it is used for aviation weather purposes, a highly reliable, fast and efficient method of communication. Faster and more-efficient transmission methods ensure that much more information can be made available. Suppliers of meteorological aviation data can therefore provide a more comprehensive service to airline operators. Capacity will be increased thanks to the implementation of new ATM practises and concepts. RVSM (reduction of vertical separation limits) has already brought consequent capacity gains where it is been applied (In Europe and Northern America for instance). More capacity also means increased safety margins in non-congested airspaces. States consider Air transport industry as a critical component, and a development tool for their economies as explained in chapter 2. A performing and safe air navigation system that can absorb air traffic growth and guarantee safety must be considered as a matter of strategic importance. Developing states like those in ASECNA are provided with a timely opportunity to enhance their air navigation infrastructures. Countries in ASECNA, as many developping nations continue to have large parts of their airspace available but unsusable because they are unsafe as shown in chapetr 3. This is due to the cost of maintaining the necessary ground infrastructure. According to ICAO, CNS/ATM systems offer them opportunities to modernize at a low cost, their air navigation system. Moreover, the impact of air transport on environment increases with the industry's growth. States are committed to reducing aviation emissions. By allowing efficient aircraft operations and fuel consumption reduction, CNS/ATM systems appear to be a part of solution to achieve that goal. That's why states have to assist the industry in that modernasation process, by facilitating financing and cooperation. 4.2 Suitable CNS/ATM systems for ASECNA The following tables summarize ASECNA's characteristics and indicate the corresponding current solutions used, and CNS/ATM alternatives, that are supposed to bring significant improvements. 4.2.1 Geographic characteristics
4.2.2 Efficiency
4.2.3 Capacity for Safety
4.2.4 Surveillance
4.3 Study of selected systems 4.3.1 Communication systems The communication requirements for each phase of flight depend on the controller-pilot communication needs. These requirements vary with the traffic complexity and density, the weather conditions, the controller's needs to issue clearances and vector2 the airplane or to establish contact with the aircraft crew. Enhanced communication performance is provided through air-ground data link communications integrated into the Aeronautical Telecommunication Network (ATN) to complement the current voice communications means (see ATN page 83). Voice communication will be used for critical messages, such as vectoring to avoid traffic and landing clearance at airports with heavy traffic. It will also serve as back up. 2 Headings by the ATC to an aircraft, for the purpose of providing navigational guidance Figure 4.1 : Aeronautical communication links
Aircraft 1 Ground: ATC, ANSPs, AOC Communications Satellite Ground: ATC, ANSPs, AOC Aircraft i Data Link A key feature of communication is the use of digital Data Link as a primary means for exchanging aeronautical information and delivering ATC services: pre-departure clearance (PDC), digital Automatic Terminal Information Service (ATIS), selected Flight Information Services (FIS) and oceanic ATC services for instance. Today's most prominent Data Link advanced features are CPDLC and VDL, Mode S Data Link. CPDLC (Controller Pilot Data Link Communication) CPDLC is an important tool that addresses the problems generated by the growth in aviation communications and the accompanying needs for effective communications, and acceptable safety levels (Hancock, 2005). CPDLC resolves a number of drawbacks. For instance, it provides automatic data entry capabilities. This permits ground systems and airborne flight management computers to enter critical information, such as flight routes... etc. It cuts down on errors resulting from manual data entry. It also permits a significant reduction in transmission time, thus reducing the congestions. It eliminates misunderstanding due to a deficient quality of the voice received, propagation problems, dialects and the possibility of having instant access to previous voice transmission recording. The following figure represents a screen shot of a CPDLC message between a controller and a Pilot. The ATC ask the pilot to climb at a certain altitude, and the pilot replies that the aircraft performance could not tolerate this manoeuvre. Figure 4.2 CPDLC test message on SAS3 B737-600 LN-RRZ MCDU
Source: SAS, 2005 CPDLC Trials As explained, CPDLC supplements the essential communications bridge between controllers and pilots. It helps to reduce routine workload, non-time critical exchanges from the voice channel to a data channel, freeing the voice channel for time critical communications such as vectors around weather or traffic. Voice channel occupancy: In high fidelity simulations conducted at the Federal Aviation Administration's (FAA) Technical Centre, the voice channel occupancy decreased by 75 percent during realistic operations in busy en route airspace. The net result of the decrease of voice channel occupancy is increased flight safety and efficiency through more effective communications between controllers and pilots, with fewer missed, repeated, and misunderstood communications. Capacity Gains and Workload reduction:
A real-time simulation performed at 3 Scandinavian Airways and 200% of the baseline volume, and at four levels of Data Link aircraft equipage: 0%, 50%, 75% and 100%. A clear positive correlation was obtained between aircraft equipage level and reduction in voice frequency usage. The following figure presents the results (Boeing, 2000). Figure 4.3: Estimated Capacity gained as a function of percentage of CPDLC equipage
Source: Mitre Corporation, 2005 Working with these data, Eurocontrol used findings from previous non-data link studies conducted by National Air Traffic Services (NATS), in the United Kingdom and the Centre d'Études de la Navigation Aérienne (CENA) in France to estimate reductions in total sector workload associated with communication under current voice-only conditions (table 4.1). These earlier results indicated that communications normally constitute 35% to 50% of total sector workload. Based on the reductions in frequency usage previously identified in the real-time simulation, Eurocontrol calculated total sector workload reduction due to CPDLC for each level of data link equipage using the conservative estimate of communications workload (35%). The link between sector workload and airspace capacity was estimated using prior results obtained with an ATC Capacity Analyser tool.
Table 4.1 Workload reduction as a function of aircraft equipage (Boeing, 2000) The results suggested that proportional sector capacity increases are approximately one-half of the amount of workload reduction achieved in a sector. The results of the workload reduction calculations performed by Eurocontrol in 1999 are presented in table 4.1 above. Delays reduction: Eurocontrol investigated the impact of traffic and capacity variations on Air Traffic Flow Management (ATFM) delays in the European airspace. The traffic sample and the airspace used for the delay calculations were identical to those used in the real-time simulation baseline described previously. The results are shown in table 4.2 below.
Table 4.2: Delays Reduction as a Function of aircraft
Equipage As suggested earlier, future efforts should allow to identify and to quantify benefits that will be gained not only by airspace users, but also by ANSPs. For the later, benefits flow directly from the increase in productivity (controllers' workload, capacity) associated with the use of CPDLC. However, they are realized as an alternative means to increase airspace capacity without increasing the number of en-route control centres. The keys to assessing the benefits of CPDLC lie in an understanding of how CPDLC facilitates the job of air traffic controllers, and how these changes affect the effective capacity of airspace and the associated costs of maintaining a safe and efficient air traffic system and the cost of using it. The physical infrastructure that supports the CPDLC is the VHF Data Link (VDL) presented below. VHF Data Link (VDL) VHF analog communication means available today are not compatible with CNS/ATM technologies. VHF Data Link operations require a VHF digital radio. VDL is essential for Data Link; VDL formats specify a protocol for delivering data packets between airborne equipments and ground systems similar to that used in Aircraft Communication Addressing and Reporting SystemS (ACARS). The difference is that VDL provides a capacity 10 times greater than the equivalent of 25 KHz VHF channel. VDL Mode 1: VDL mode-1 is a low speed bit oriented data transfer system. It uses carrier sense multiple access (CSMA4) protocol. The new development has overtaken VDL mode-1, which is no longer in use. VDL Mode 2: It is an improved version of VDL Mode 1 and it uses the same technology and Differential 8 Phase Shift Keying (D8PSK) modulation. It is supported by VHF and HF capabilities. Its average data transmission is 31.5 kbps5. This is over 13 times the VHF ACARS 2.4 kbps rate using Double Sideband Amplitude Modulation (DSB-AM). It employs a globally dedicated common signalling channel6 (CCS) of 136.975 MHz. VDL Mode 3: it is an integrated digital data and communication system allows to use up to four voice and/or radio channels on a single carrier with 25 KHz spacing. The data link technology used is called TDMA7. The data capability provides a mobile sub network that is compliant to the Aeronautical Telecommunication Network. 4 Carrier sense means that every device on the network listens to the channel before it attempts to transmit the information. Multiple access means that more than one network devise can be listening at the same time, waiting to transmit the data. 5 Kilo Byte per second 6 Signalling is the use of signals for controlling communications. CCS means that a data channel in combination with its associated signalling terminal equipments. It only requires one signalling channel for up to 1000 data communication channels and is able to do this by only signalling when required. 7 TDMA is a technology for delivering digital wireless service using time-division multiplexing (TDM). TDMA works by dividing a radio frequency into time slots and then allocating slots to multiple calls. VDL Mode 4: It uses a data link technology called self-organizing time division multiple access (STDMA). In this mode, stations transmit their geographical position together with data message in time slots that are dynamically modified at frequent intervals. Before starting a transmission using the STDMA technique, the aircraft keeps listening on the frequency to be used and establishes a track and a table of time slots for all other aircraft. An algorithm in the aircraft transceiver selects a free slot or takes the slot of the most distant aircraft. This modulation system allows distant stations to transmit in the same slot with little interferences. The aircraft is not involved in any manual frequency tuning for any station change. Reception of the geographic position gives a surveillance capability. VDL mode 4 is a candidate technology for ADS-B operations. Airlines prefer VDL Mode 2. The technology is perceived as the only logical choice because it is a globally accepted standard supported by the communication service providers such as SITA8 and ARINC9. VDL Mode 2 has been standardized as a digital data link to be shared by Air Traffic Services (ATS) and Aeronautical Operational Control Centres (AOC). This is done within the framework of ICAO's standardized Aeronautical Telecommunications Network (ATN). Mode S Data Link (Mode Select) Mode S is use for surveillance as it's will be explained later in page 96. Nevertheless, it also makes available an air-ground data link, which can be used by ATS in high-density airspace. Mode S Transponders send and receive data link messages via Mode S message formats. During normal operation, ATC ground stations and other aircraft automatically receive altitude, discrete address, and transponder code via interrogate and reply formats. 8 Societe International des Telecommunications Aeronautiques 9 Aeronautical Radio Inc The Mode S ground interrogator transmits a sequence of pulses. The timing, the level and the sequence of the pulses determine the interrogation mode. The ground interrogator can distinguish between the surveillance function and the data link function due to the availability of different pulses, pulse amplitudes and pulse times. Mode S data link function uses four distinct pulses. Aeronautical Mobile satellite System (AMSS) AMSS are geostationary communications satellites, designed especially for mobile communications, which offer wide/near global coverage and voice and data communications. The digital voice component of AMSS is designed to interface with terrestrial public switched telephone network (PSTN) and to provide high quality telephone service both for aeronautical passenger communications (APC), ATS & Aeronautical operational control (AOC). The use of AMSS is particularly suitable for cross-oceanic flights. High frequency Data Link (HFDL) The HF data link provides an air-to ground data link that is ATN-compatible. Its development within lCAO has progressed rapidly and appears to provide an alternative and possibly cheaper communication medium than SATCOM for data. HF data link is also an excellent standby system for the AMSS presented above, in oceanic and remote areas. Aiircraft can contact three or more HFDL ground stations constantly and its hub can become ATN routers. The dependence on HF voice continues to remain the backbone for ANSPs communication systems in oceanic and remote regions. AMSS, VDL, Mode S and HF data link use different data transmission techniques. Individually, they all use the same network access protocol in accordance with International Standardization Organisation (ISO). This allows the interconnection between these technologies and other ground-based networks. The communication service that allows ground, air-ground and avionics data network to interoperate is the Aeronautical telecommunication Network presented in figure 4.4. Aeronautical Telecommunication Network (ATN) «Without ATN, there is no CNS/ATM». (Dr Hilaire Tchicaya, Head of Aeronautical Telecommunications, ASECNA). In fact, ATN is the inter-networking infrastructure for the technologies presented above and others. ATN will link the various air-ground data systems together. A variety of ground networks, implemented by states, a group of states or commercial networks that use packet switching techniques and are compatible with ISO's OSI reference model will be able to use ATN's internetworking services. With the gradual implementation of ATN, the use of the current Aeronautical Fixed telecommunication network that serves to transmit messages between ANSPs, and between ANSPs and users. AFTN will diminish. However, during the transition period, interconnection of AFTN terminals to the ATN will be possible via special gateways. Figure 4.4 Aeronautical Telecommunication Network concept Source: ICAO, 2002, p.69
Airline Data Base FMS HF Private Flight crew Gate Airline Admin Service Airline Operation Control Airborne Gateway to PDN Router VHF Router Cabin Crew Mode S ATS ATS PAX Satellite ATFM ATN allows communication between all the stakeholders. The design provides for incorporation of different air-ground sub networks and different ground-ground sub networks, resulting in a common data transfer service. The two aspects are the basis for interoperability that will provide a reliable data transfer service for all users. Furthermore, the design is such that user communication service can be introduced in an evolutionary manner. As shown in Figure 4.4 above, the routing of messages over ATN are controlled by routers. The routers direct data messages to their destinations. ATN aims at operating globally, encompassing all aeronautical data communication services. 4.3.2 Navigation systems CNS/ATM navigation technology improves the accuracy of the position and provides better predictions of future positions to enable aircraft to fly more accurately.. Improvements in navigation include the progressive introduction of area navigation (RNAV) and required navigation performance (RNP) capabilities along with the global navigation satellite system (GNSS). These systems provide for worldwide navigational coverage and are being used for en-route navigation and for non-precision approach. With appropriate augmentation systems and related procedures, it is expected that these systems will also support precision approaches even under bad visibility conditions. Global navigation satellite System (GNSS) GNSS is a satellite system that is used to pinpoint the geographic location of a user's receiver anywhere in the world. Two GNSS systems are currently in operation: the American system: Global Positioning System (GPS), and the Russian's Global Orbiting Navigation Satellite System (GLONASS). A third one, Europe's Galileo, is slated to reach full operational capacity in 2008. Each system employs a constellation of orbiting satellites working in conjunction with a network of ground stations. Satellite-based navigation systems use a version of triangulation10 to locate the user, through calculations involving information from a number of satellites. Each satellite transmits coded signals at precise intervals. The receiver converts signal information into position, velocity, and time estimates. Using this information, any receiver on or near the earth's surface can calculate the exact position of the transmitting satellite and the distance (from the transmission time delay) between it and the receiver. Coordinating current signal data from four or more satellites enables the receiver to determine its position. There are nearly 30 satellites giving an accurate positioning and timing information worldwide. They can be used to give positioning accuracies of better than 10 metres and timing accuracies of better than 30 nanoseconds. World Geodetic System coordinates (WGS-84): An important tool in implementing these navigation principles are the World Geodetic System coordinates (WGS-84). 10 Triangulation is a process by which the location of a radio transmitter can be determined by measuring either the radial distance, or the direction, of the received signal from two or three different points. Triangulation is used in aviation to pinpoint the exact geographic position of an aircraft for instance. WGS-84 coordinates system is a conventional earth model, established in 1984 from assembled geometric and gravitational data. This model portrays the earth as being ellipsoidal, contradicting former beliefs that the earth was spherical (ASECNA, 1996). The origin of this system is the earth's Centre of mass (assuming for simplicity that the earth rotates at a constant speed around a fixed meridian pole). The WGS-84 system responds to the present navigational needs: RNAV, RNP, ATS routes and satellite navigation. In 1989, ICAO adopted WGS-84 as the standard geodetic reference system for future navigation (For further information, refer to Appendix 3). Satellite Based augmentation Systems (SBAS): There are four Satellite Based Augmentation Systems being developed: EGNOS in Europe, GAGAN in India, MSAS in Japan and WAAS in the USA. These are all civil-controlled regional systems and there is a form of coordination to ensure that they are interoperable to provide a seamless worldwide navigation system so that one SBAS/GPS receiver can be used all of them. Each SBAS provides GPS corrections to improve positioning accuracy to around 1 metre horizontally and 3 metres vertically. Timing accuracy is enhanced to better than 10 nanosecondes. ASECNA has chosen the European Augmentation Systems EGNOS as part of his satellite navigation strategy. European Geostationary Navigation Overlay Service (EGNOS): EGNOS, the European Geostationary Navigation Overlay Service, is a SBAS that is being deployed to provide regional satellite-based augmentation services aviation, maritime and land-based users in Europe. EGNOS is the first step in the European Satellite Navigation strategy that leads to Galileo. Availability is improved by broadcasting GPS look-alike signals from up to three geostationary satellites; accuracy is improved to between 1 and 2 metres horizontally and between 2 and 4 metres vertically; Integrity and Safety are improved by alerting users within 6 seconds if a malfunction occurs in EGNOS or GPS. The following are the benefits that are derived from EGNOS. Figure 4.5: Comparison between EGNOS and GPS
Source: ESA, 2004 EGNOS enables Precision Approach Operations (APV 2 and APV 1)11. They are achievable on every runway. The Integrity of EGNOS vertical guidance protects aircraft against CFIT12 accidents. Thanks to SBAS APV1, all non-precision approach (NPA) procedures are suppressed. New SBAS APV1 services open the door to new feeder routes between secondary and inter national airports. New APV1 procedures suppresse the need of CAT-1 service for many runways A major advantage of this system is that it requires less costly ground installations than is required by present conventional systems. It allows the full coverage of navigational services over sparsely populated, desert and forest areas. It must be highlighted that there is no technical requirement for the implementation of EGNOS ground stations in each African country. In other words, this means that EGNOS service provision scale is at regional (i.e. sub-continental) supra-national level. 11 Approach Procedure with Vertical guidance 12 Controlled Flight Into Terrain EGNOS Trials The aim of the flight trial was to assess EGNOS' capability to provide aircraft guidance during two different approach types:
The following parameters among others that are not reported here have been investigated: Accuracy: The navigation system error (NSE13), the total system error (TSE14), Integrity, and Noise Contour. 13 The navigation system error (NSE) is defined as the difference between the actual flight path (i.e. Trimble reference position) and the flight path indicated by the navigation system in the lateral and vertical plane. 14 The Total System Error (TSE) is defined (See figures above) as the difference between the desired flight path and the actual flight path (i.e. Trimble reference position). The Results The Total System Error (TSE)
Distance to the runway Distance to the runway Figure 4.6: Lateral and Vertical TSE for three
approaches. The performance in terms of the Horizontal NSE and the Vertical NSE were found to be in the order of 1-4 m (95%) in the lateral and vertical plane and can be rated as very good according to Eurocontrol. The lateral APV-II and CAT I requirements as specified in ICAO SARPs were easily met (tables 4.3, 4.4 and 4.5 below). The vertical APV-II criteria specified in the SARPs were met during all curved approaches.
Table 4.3 Results for lateral vertical accuracy
Table 4.4 Results for Availability Vs ICAO's SARPs
Table 4.5: ICAO's SARPs for lateral
and In general, the aircraft arrived at the runway threshold slightly right of centreline during the curved approaches. The navigation system error was relatively small. Noise Contour: This noise impact study confirmed that the Riviera approach reduces annoyance for the local area, especially at the located right below the ILS eastward approach trajectory. The study also revealed that the use of a SBAS navigation system might bring further improvements around the southeast local area by considerably reducing the dispersion of aircraft trajectories. However, for the SBAS scenario all aircraft were assumed to have the same 3D trajectory, which is a strong assumption. The benefits of SBAS guidance in terms of noise will strongly depend on the way it is implemented and how pilots and controllers respect procedures. GNSS and improvements in avionics allow better navigation and approach manoeuvres. Area Navigation and Required navigation performance are two of the main concepts made possible by these CNS/ATM tools. RNAV (Area Navigation) Area Navigation is a method of navigation that enables an aircraft to fly in any desired path within the coverage of referenced air navigation aids, or within the capacity of self contained systems or a combination of both. The use of routes and procedures based on RNAV, improves access and flexibility, through point-to-point navigation. These routes are not restricted to the location of ground based NAVAIDs. Safety of such operations is achieved thanks to a combined use of navigation accuracy, ATC monitoring, communication, multilateration15, or increased separation. RNAV was developed to provide more lateral freedom and a better use of available airspace. This method of navigation does not require a track directly to or from any specific radio navigation aid as explained above, and has three principal applications: 1) A route structure can be organized between any given departure and arrival point to reduce flight distance and traffic separation. 15 Multilateration is today's version of triangulation (use of three satellites to locate an object), where the location of an object is determined by taking its bearing from several different places.(Refer to appendix 2 for more details)
The following figures represent the navigation performance when using RNAV or RNP. They clearly show the advantages of new systems in term of efficiency. Figure 4.7: Comparison between RNAV, RNP and Conventional navigation
Source: Federal Aviation Administration, 2006 Trials have been conducted and RNAV is already implemented in many parts of the world since the year 2000. The following are the results from trials in Atlanta (USA). RNAV Trials As the next figure depicts it, Non RNAV flights are characterised as follows:
Results Figure 4.8: Atlanta SID trials: Non RNAV tracks
Source: IATA, 2005 Flights with RNAV capabilities give the following results: Figure 4.9: Atlanta SID, RNAV tracks
Source: IATA, 2005 The results are as follows:
RNP (Required Navigation Performance) RNP operations are RNAV operations that use on-board containment16 and monitoring. The ability of the aircraft navigation systems to monitor its achieved performances, and to indicate to the crew whether the operational requirement is being met during an operation, is a critical component of RNP. Aircraft RNP capability is important in determining the separation requirements to ensure that containment is met. RNP approach is already being implemented in some American airports. In the Caribbean and Latin America regions, introduction of RNAV is generating an annual reduction of around 40,000 tonnes of CO2 emissions. In cross polar-routes, satellite based navigation has enabled flights over previously untravelled territory using Russian, Canadian and US airspace close to the North Pole. The first official polar route flight between North America and Asia by a commercial airline was conducted in July 1998. Currently, more than 200 flights per month use near polar routes between Europe and Asia and Asia and North America thereby benefiting airlines and passengers through significant time and fuel savings and associated emissions reductions. Figure 4.10: Projected RNP-RNAV capability, RNP capable aircraft:
Source: Eurocontrol, 2002 16 Onboard containment is onboard alerting and monitoring capability that reduces the reliance on Air Traffic Control intervention, via Radar or ADS, multilateration... American and European aviation regulators have recently approved the integrity of navigation data provided by Boeing. It enabled carriers to use the information for precision area navigation procedures: Carriers using the navigation data will be able to implement new precision area navigation (P-RNAV) procedures. They require that aircraft are able to maintain a track with lateral accuracy of 1nm (1.85km) for 95% of the time (Kaminski-Morrow, August 2005) As the figure 4.10 suggests, aircraft RNP and RNAV capability will be greater than 90 per cent by 2010. Which means no ANSP could ignore that, and therefore they need to prepare themselves consequently to be able to offer that service to their users. RVSM (Reduced Vertical Separation Minimum) The goal of RVSM is to reduce the vertical separation above flight level (FL) 290 from the current 2000-ft minimum to 1000-ft minimum. This will allow aircraft to safely fly more optimum profiles, gain fuel savings and increase airspace capacity. The process of safely changing this separation standard requires a study to assess the actual performance of airspace users under the current separation (2000-ft) and potential performance under the new standard (1000-ft). RVSM was successfully implemented across 41 European and North African States in January 2002. During the first summer of operations, ATM capacity in European airspace was increased by approximately 15%. 4.3.3 Surveillance systems Secondary Surveillance Radars are still being used, along with the gradual introduction of Mode S presented below, in both terminal areas and high-density continental airspace. The major innovations are the introduction of Automatic Dependent Surveillance (ADS), Mode S surveillance and multilateration. The latter is not presented here although it has great potential. ADS systems allow the aircraft to calculate its position, its
heading and other data such are automatically transmitted to the air traffic control unit. ADS data are transmitted via satellite or the communication means presented earlier (Data Link...). The position of the aircraft is displayed on a screen like with a radar display. ADS is defined as the true merging between Navigation and Communication technologies. Along with enhanced ground systems' automation, ADS helps to improve ATM, especially in oceanic airspaces. The need for new HF radios on Atlantic routes has been averted through the gradual introduction, over the past few years, of ADS waypoints reporting, which allows better flight plan conformance monitoring and a reduction in gross navigation errors. There are presently three types of ADS: ADS-A, ADS-B and ADS-C. These are presented below. ADS-A (Addressable) ADS-A enables appropriately equipped aircraft to send position information messages at predetermined geographical locations or at specified time intervals. ADS-A can be relayed via high frequency data link, satellite communication, and very high frequency. Some pacific ATS providers already use Automatic Dependent Surveillance-Addressable to apply 50 nm longitudinal separation between aircraft. ANSPs' systems in countries like New Zealand, Australia, Tahiti, and Fiji support the use of FANS 1/A ADS-A operating systems in Pacific oceanic airspace (Cirillo, 2004). ADS-B (ADS-Broadcast) ADS-B involves broadcast of position information to multiple aircraft or multiple ATM units. ADS-B-equipped aircraft or ground vehicle periodically broadcast their position and other useful data derived from on-board equipments. This is called aircraft derived data (ADD). The position is calculated through GPS and associated augmentation systems. Any user, either airborne or ground-based, within range of this broadcast, can process the information. It will remove the reliance on voice reports and is expected to add significant en-route safety. The technology is also envisaged to be applied for surface movements, thus being an alternative to surface radars such as airport surface detection equipment. Figure 4 .11: ADS-B operational capabilities.
Source: RockwellCollins.com The figure above (figure 4.11) illustrates the operational capabilities of the technology. It will bring significant operational enhancement in airport surface management, air-to air and air-to-ground communications, and in surveillance operations. On airports' surface, it will enhance pilots' situation awareness, and above all, it will reduce runway. In-flight, ADS will improve separation standards. ADS-B Operational trials (Bundaberg, Australia) In recent years, Australia has been active in the field of automatic dependent surveillance-broadcast because the technology offers the possibility of continent-wide coverage. In 2002, Air Services Australia installed a single ADS-B ground
station at Bundaberg Mode S extended squitter17. The focus of Bundaberg's trials was to improve lower level surveillance coverage to allow early insurance of clearances as aircraft climbed into controlled airspace. 28 ADS-B ground stations are planned nationwide. Some will replace 11 secondary surveillance radars, saving a fortune in maintenance cost. Each ADS-B station costs $1 million. It will replace a $US10 million worth radar that costs $US1 million per year to maintain. The other ADS systems will provide coverage in airspace that has never had radar. Results The systems performance exceeded expectations. Detection coverage, position accuracy, velocity vector accuracy and update rate were found to be better the conventional fast rotating monopulse secondary surveillance radar used (Dunstone, 2005). Gotzenhein (Germany) Operational trials This site was chosen because Frankfurt had been evaluated as the region with the highest FRUIT density world-wide. The ADS-B antenna elements were positioned either side of the airport radar tower for 360° coverage. Results Evaluated as a Terminal application (100 Nm) with a 4 second update rate,the Probability of Detection (Pd) was greater than 99.8%. Evaluated as an En-route application (150 Nm) with a 6-second update rate, the Pd was above 99.6%. As shown on the following figure (Figure 4.12), ADS-B is far better than Radar. While radar data gated to 150 NM, ADS-B was only limited by terrain screening. The results also showed a higher update rate, which allow a better accuracy (Wakefield, 2005). 17 Works on 1090 megahertz, and is recommended as initial worldwide interoperable ADS-B Link Figure 4.12: Comparison between ADS and Radar's.
Source: Wakefield, 2005 ADS-C (ADS-Contract) ADS-C is another ICAO standardised technique that allow aircraft to report data items, including position, identity, intent, etc, to the ground over a point-to-point data-link. It has been deployed mainly in oceanic areas and uses satellite communications. However, it can also be used over any point-to-point data-link (VHF, HF... etc). The technology is presently used only in areas of low traffic density because of bandwidth limitations in point-to-point data-links. Secondary Surveillance Radar Mode S (SSR-Mode Select) Mode S radar is a relatively new type of secondary radar that is also based on the use of a transponder on board the aircraft, responding to interrogations from the ground. The radar thereby detects the aircraft with better link means, and above all retrieves information that can help identify the aircraft at the same time. Communication between conventional secondary radar and a
conventional transponder transmitting its code with the same name (allocated to the flight by air Traffic Control, and entered by the pilot into the transponder via the interface). When interrogated in mode C, the transponder replies by giving its altitude. The radar mode S operates at the same frequencies (1030/1090 MHz). The Mode S provides more accurate position information and minimizes interferences by discreet interrogations of each aircraft. Its selectivity is based on precise identification of an aircraft by its 24-bit address. That address can be considered as its communication address and is linked to the aircraft, or at least to its transponder. But it does not replace the Mode A code which is linked to a flight or a flight plan. There are also plans for recovery of the A and C codes via Mode S. 4.3.4 Air Traffic Management The future domestic ATM Using satellite-based navigation and communication networking technologies presented above, the future domestic and oceanic ATM systems will be seamless. They will employ similar systems and procedures regardless of location. However, complete transition to the new environment may not be completed in the near term. Therefore, the near-term domestic CNS concept must maintain some reliance on current ground ATC capabilities, albeit upgraded, particularly in terminal areas. Terminal air traffic controllers will continue to separate and sequence aircraft. Pilot-controller connectivity will include both voice and data. Radar will continue to provide some aircraft position information but the introduction of Mode S secondary radars will facilitate the selective interrogation of aircraft. In addition, ADS-B will be introduced in the en route structure where aircraft broadcast position information derived from GPS and corrected by augmentation systems to the ATM system. SBAS corrections will be transmitted from ground earth stations through communications satellites. GPS and Augmentation systems may also provide precision approach information in the future for aircraft, eliminating the need for ILSs and precision approach radar (PAR). Data link networks will route CNS data as presented earlier. The future oceanic ATM In the near future, the greatest changes will occur in the oceanic environment. Here we expect the full implementation of satellite-based CNS (ADS, Data-Link... Etc). Aircraft will relay GPS/Augmentation-derived positions to ATM systems through satellites. The same satellites will be used to relay aircrew requests and ATC instructions, many of which will involve ATM to aircraft data links. The data link network will route CNS information accordingly. In the oceanic environment, the first implementation of aircrew-based separation is expected. Today, some airlines are already using a TCAS «in-trail climb» procedure in which aircrews coordinate manoeuvres that allow aircraft to pass one another. |
| |||||||||||||||||||||||||||||||||||||||||||||||||||||||||||||||||||||||||||||||||||||||||||||||||||||||||||||||||||||||||||||||||||||||||||||||||||||||||||||||||||||||||||||||||||||||||||||||||||||||||||||||||||||||||||||||||||||||||||||||||||||||||||||||||||||||||||||||||||||||||||||||||||||||||||||||||||||||||||||||||||||||||||||||||||||||||||||||||||||||||||||||||||||||||||||||||||||||||||||||||||||||||||||||||||||||||||||||||||||||||||||||||||||||||||||||||||||||||||||||||||||||||||||||||||||||||||||||||||||||||||||||||||||||||||||||||||||||||||||||||||||||||||||||||||||||||||||||||||||||||||||||||||||||||||||||||||||||||||||||||||||||||||||||||||||||||||||||||||||||||||||||||||||||||||||||||||||||||||||||||||||||||||||||||||