
DEDICATION
To the Almighty God
To my late parents
To my late
brother KALISA P.
To my brother KWIZERA J D
To the family HABIRYAYO
Cyprien
To my friends and relatives
I dedicate this dissertation
«God bless you»
II
DECLARATION
I, KABERA Lambert, hereby declare that this dissertation
entitled «The use of accounting ratios in decision making» is my own
work and it has not been submitted anywhere for the award of any degree
Student's Names
Student's signature
III
ACKNOWLDGEMENT
I am thankful to many individuals who have contributed to the
accomplishment of this dissertation. Special appreciation goes to my director
Prof RAMA B. RAO for his pieces of advice and corrections throughout the course
of the course of this research.
Further thanks go to the Faculty of Economics and Management
especially to the Head of the Management Department and all lecturers for their
tireless efforts towards the accomplishment of this dissertation in particular
and the completion of my course in general.
I further convey my gratitude to the family Habiryayo Cyprien,
the family Munyengabe Joseph, the family Munyanziza Andre, my cousins, brother
and sisters for their financial and moral support rendered to me over since I
lost my both parents.
My thanks go especially to Mrs Kabarere Venantie for her role
played in the darkness event that I passed through, also for both my
grandmothers, uncles and aunts I do recognize their effort to help me to
recover when I lost my parents.
Further appreciation goes to my friends Ndati, Kibonge Sam,
Hilde, Tiro, Makombe, Muhire and I would like to extent my heart-felt
appreciation to all BAS Year IV 2005-2009 friends for their co-operation during
my stay at NUR.
Last but not least, my best regards go to the Government of
Rwanda that granted me a Scholar ship at the National University of Rwanda as
well as for AMAZI YA HUYE management staff for being cooperative with me to
conduct my research on their company.
iv
TABLE OF CONTENTS
DEDICATION I
DECLARATION II
ACKNOWLDGEMENT III
TABLE OF CONTENTS IV
LIST OF ACCRONYMES AND ABBREVIATIONS VII
LIST OF TABLES VIII
LIST OF FIGURES IX
ABSTRACT XI
CHAPTER 1 1
INTRODUCTION 1
1 1 BACKGROUND OF THE STUDY 1
1 2 STATEMENT OF THE PROBLEM 2
1 3 RESEARCH QUESTIONS 3
1 4 OBJECTIVES OF THE STUDY 3
1 5 HYPOTHESES 3
1 6 SIGNIFICANCE OF THE STUDY 4
1 7 SCOPE OF THE STUDY 4
1 8 ORGANIZATION OF THE STUDY 4
CHAPTER II 6
LITERATURE REVIEW 6
2.0 INTRODUCTION 6
2 1 DEFINITION OF KEY TERMS 6
2 1 1 Accounting 6
2 1 2 Ratios 6
2.1.3 Accounting ratios 6
2 1 4 Financial ratios 7
2 1 5 Decision making 7
2 2 ESSENCE OF RATIOS ANALYSIS 7
2 3 STANDARDS OF COMPARISON 7
2 3 1 Time series analysis 8
2 3 2 Pro forma analysis 8
2 3 3 Industry analysis 8
2 3 4 Cross-sectional analysis 9
2 4 TYPES OF ANALYSIS USING ACCOUNTING RATIOS IN DECISIONS MAKING
9
2 4 1 Analyzing Liquidity 9
V
2.4.2 Analyzing Debt 9
2 4 3 Analyzing Sales and Profita bility 10
2 4 4 Analyzing Efficiency 12
2.4.5 Multiple Discriminant Analysis 12
2.4.6 Trend Analysis 13
2.5 THE COMPONENTS OF DECISION MAKING 13
2.5.1 Decision environment 13
2.5.2 Decision Model 14
2.6 USES AND LIMITATIONS OF RATIO ANALYSIS 15
2.6.1 Uses 15
2.6.2 Limitations 15
CHAPITER III 16
METHODOLOGY 16
3 0 INTRODUCTION 16
3 1 RESEARCH DESIGN 16
3 1 1 The analyti cal research 16
3 2 POPULATION OF THE STUDY 17
3 3 SOURCES OF DATA 17
3 3 1 Primary Data 17
3 3 2 Secondary Data 18
3 4 DATA COLLECTION TECHNIQUES 18
3 4 1 Documentary Review 18
3 4 2 Document Analysis 18
3 4 3 Interview Guide 19
3 4 4 Sample size and selection 19
3 5 SAMPLING TECHNIQUE 19
3 6 DATA PROCESSING AND ANALYSIS 19
3 7 STUDY LIMITATIONS 20
CHAPTER IV 21
DATA ANALYSIS AND INTERPRETATION 21
4 1 INTRODUCTION 21
4 2 THE PROFILE OF AMAZI YA HUYE 21
4 1 2 AMAZI YA HUYE location 21
4 3 AMAZI YA HUYE'S MISSION 22
4 4 AMAZI YA HUYE'S OBJECTIVES 22
4 5 THE ENVIRONMENT OF AMAZI YA HUYE 22
4 6 JURIDICAL STATUTE OF AMAZI YA HUYE 23
4 7 TASKS DESCRIPTION 23
4 8 DATA ANALYSIS 25
4 8 1 In depth Interview 26
4 8 3 Preferred ratios in decision making 27
4 10 ACCOUNTING RATIOS AND DECISION MAKING 29
vi
4 11 ANALYSIS OF ACCOUNTING RATIO AS A DECISION MODEL 30
4 11 1 Liquidity analysis 30
4 11 2 Debt analysis 33
4 11 3 Sales and profitability analysis 34
4 11 4 Efficiency analysis 38
4 11 5 Multiple discriminant analysis 40
4 12 HYPOTHESIS TESTING 41
CHAPTER V 43
SUMMARY, CONLUSION AND RECOMMENDATIONS 43
5 1 SUMMARY 43
5 2 CONCLUSION 44
5 3 RECOMMENDATIONS 46
5 6 AREA FOR FURTHER RESEARCH 47
BIBLIOGRAPHY 48
APPENDICES 50
VII
LIST OF ACCRONYMES AND ABBREVIATIONS
A P: Accounts payable
BAS: Bachelor of Accounting Sciences
EAT: Earnings after taxes
EBIT: Earnings before interest and taxes
ICPAR: Institute of Certified Public Accountants
of Rwanda
MDA: Multiple Discriminant Analysis
NUR: National University of Rwanda
ROA: Return on assets ROE:
Return on equity ROI: Return on investment
ROS: Return on sales
SGR: Sustainable growth rate
VIII
LIST OF TABLES
TABLE 3 1 TOTAL POPULATION OF MANAGEMENT AND ACCOUNTING
DEPARTMENTS OF AMAZI YA HUYE 17
TABLE 4 1 RESPONDENTS' VIEW ON THE LINKAGE BETWEEN
ACCOUNTING RATIOS AND DECISION MAKING 29
TABLE 4 2 TREND OF LIQUIDITY RATIOS 31
TABLE 4 3 TREND OF DEBT RATIOS 33
TABLE 4 4 TREND OF SALES AND PROFITABILITY RATIOS
35
TABLE 4 5 TREND OF EFFICIENCY RATIOS 38
TABLE 4 6 TREND OF MULTIPLE DISCRIMINANT ANALYSIS
40
ix
LIST OF FIGURES
FIGURE 4 1 ORGANIZATION STRUCTURE OF AMAZI YA HUYE 23
FIGURE 4 2 AMAZI YA HUYE LIQUIDITY RATIOS 2003 - 2007 32
FIGURE 4 3 AMAZI YA HUYE DEBT RATIOS 2003 - 2007 34
FIGURE 4 4 AMAZI YA HUYE EXPENSES ANALYSIS, GROSS MARGIN TO
SALES, RETURN ON SALES RATIOS 2003-2007
37
FIGURE 4 5 AMAZI YA HUYE RECEIVABLES AND PAYABLES TURNOVER RATIOS
2003-2007 39
FIGURE 4 6 AMAZI YA HUYE MULTIPLE DISCRIMINANT ANALYSIS 2
003-2007 41
x
LIST OF APPENDICES
1. A qui de droit
2. The letter of request for collaboration in the research
3. Interview guide
4. Financial statements of AMAZI YA HUYE
xi
ABSTRACT
This research entitled» The use of accounting ratios in
decision making» tried to find out the degree to which accounting ratios
can be used to draw conclusion upon which decision are made. This has been done
considering AMAZI YA HUYE as a case study. The research specifically had to
identify different ratios used in financial statement analysis in decision
making, also the role of financial ratios analysis in decision making had to be
indicated and lastly the use and limitation of accounting ratios .
Both secondary and primary data were consulted during this
research. Primary data was collected with the help of interview given to the
members of the management staff. Respondents were selected based on their role
in financial activities in AMAZI YA HUYE. Under secondary data financial
statements of AMAZI YA HUYE, textbooks, and internet resources were
consulted.
This study revealed that the accounting ratios are
indispensable in reasonable decision making. Generally, some of business entity
uses accounting ratios in a proper way. The use of accounting ratios in
financial statements analysis varies according to the decision to be made by
those who use them. Different managers use different analytical tools and
techniques depending on the objectives of the analyst and nature of the
business, it was further found out that the accounting ratios reduce the long
array of financial statement in decision making.
On the basis of the study's major findings, there was no
sufficient evaluation to reject the alternative, namely,» The use of
accounting ratios guides management as an effective tool in decision-making.
CHAPTER 1
INTRODUCTION
1 1 Background of the study
This research is about the impact of using accounting ratios
in decision making. Decision making is the most important element in management
activities of all kinds of enterprises; profit oriented, nonprofit oriented and
public institutions. This research is carried out in profit oriented enterprise
where decisions are made based on different aspects among which the use of
accounting ratios should have a great impact.
The use of financial reporting is the main aspect in decision
making. According to (Charles H. GIBSON, 1989: 10), financial reporting is not
the end in its self but it is intended to provide information that is useful in
making business and economic decisions. It is in this regard the researcher was
motivated in finding the extent to which management dealers may depend on
accounting ratios in decision making.
The main objective of this chapter is to introduce the
researcher' s topic and its content include : background of the study,
statement of the problem, objectives of the study, hypothesis, research
questions, significance of the study, scope of the study and organisation of
the study.
As an art, management has been practised since the early
beginning of twentieth century. It had got a great evolution at the time of
industrial revolution which started in England around mideighteenth century.
Prior to this, most of business enterprises were characterised by craftsmanship
rather than mechanisation or technology and faced the problem much simpler than
those faced today's firms in our complex industrial and technological
society.
With reference to this industrial revolution till nowadays;
legal, social and technological environment tend to generate industrial growth
and economical environment development that prompt entrepreneurs to react. At
the same time when these changes taking place, there were basic changes in the
form of management especially in managerial strategies for decision making;
this generates separation of ownership of the business from its management.
In consequences, managers had to look for the means of
discharging their stewardship responsibility; this can be obtained through the
use of accounting ratios.
The use of accounting ratios is a time-tested method of
analyzing a business. Wall Street investment firms, bank loan officers and
knowledgeable business owners all use accounting ratio analysis to learn more
about a company's current financial health as well as its potential (P.
Vernmmen, 2006).
Ratios analysis simplified, summarises, and systematises a
long array of accounting figures. Its main contribution lies in bringing out
the inter-relationship which exists between various segments of business.
Ratios are more of a diagnostic tool that helps to identify problem areas and
opportunities within a company.
1 2 Statement of the problem
The management of enterprise is depending on accounting
information for taking various strategic decisions. Financial statements
provide such information. This information is made useful by analyzing and
interpretation of financial statements with help of financial analysis
techniques among which the common and easy technique to use is financial ratios
also known as accounting ratios. (Prof. Harvey B. Lermack, 2003).
(James C. Van Horne and John M. Wachowicz, 2005: 132) say
«to evaluate the firm's financial condition and performance, the financial
analysis needs to perform checkups on various aspects of a firm's financial
health. A tool frequently used during these checkups is financial
ratios».
Accounting ratios are important tools in the management for
decision making. (R.K. Sharma, Shashi K. Gupta, 2001: 4.4), financial
statements are prepared primarily for decision making, but the information
provided in financial statements is not an end in itself and no meaningful
conclusion can be drawn from these statements alone. Ratio analysis helps in
making decisions from the information provided in these financial statements.
Thus, the proper use of accounting ratios assists management in communicating
information which is pertinent and purposeful for decision makers to ensure the
effectiveness of management in the enterprise.
In modern business environment, which is becoming more
competitive, the survival of firms, be it small or large; depend upon the
strategic decisions made by management. This is however done with the help of
accounting ratios, which is a big challenge to most countries having shortage
of professional accountants as it is the case to our country.
As such, this study is aimed at finding out the impact of
using accounting ratios in assisting rational decision making by Rwandan
business community with more emphasis on the management of AMAZI YA HUYE.
1 3 Research questions
The researcher has been guided by the following research
questions while carrying out his study.
1. Why should managers rely on accounting ratios in decision
making?
2. Of what significance are different types of accounting ratios
to management in decision making?
3. What is the requirement needed to use accounting ratios?
1 4 Objectives of the study
The general objective of this study is to exanimate the impact of
using accounting ratios for decision making. The specific objectives are as
follows:
1. To understand the importance of using accounting ratios as a
pillar to draw conclusions upon which decisions are made;
2. To identify hindrances of using accounting ratios in AMAZI YA
HUYE;
3. To provide suggestion for further improvement.
1 5 Hypotheses
1. The use of accounting ratios guides management as an
effective tool in decision making;
2. The result of using accounting ratios relies on the
effectiveness of accounting and how accountants are skilled in financial
analysis techniques.
1 6 Significance of the study
This study is of importance to the researcher as it equips him
the knowledge of financial analysis techniques and interpretation of the
available data for managerial purpose using accounting ratios. I t further
helps in designating proper solution for identified problems.
The research enable managers to understand better the role
that plays accounting ratios in decision making and it will attempt to make a
causative analysis and designed the possible alternative for improvement of
managerial decisions for growth of AMAZI YA HUYE, these would thus become a
basis for further research and provide the necessary information for action by
the concerned parties. Finally, this study will enable the researcher to obtain
a Bachelor' degree in Accounting Sciences.
1 7 Scope of the study
The study will make a great emphasis on analysis of financial
reports of AMAZI YA HUYE using accounting ratios. This report is made of all
balance sheets, income statements over the last 5 years period, that from 2003
to 2007.
1 8 Organization of the study
The study is divided into five chapters. The first chap
ter will be made up of introduction, background of the study, statement of
the problem, research questions, and objectives of the study, hypothesis,
methodology, and significance of the study, scope of the study and organization
of the study.
with the research topic will be defined ,the accent will be put
on the impact of using accounting ratios for decision making.
The third chapter will identify methodology to follow
while conducting this research.
Chapter four will focus on the research findings
analysis and interpenetration of data collected. Findings will be linked with
objectives set.
Chapter five will present summary of research findings,
conclusion and recommendations.
CHAPTER II
LITERATURE REVIEW
2.0 Introduction
This chapter presents the related literature and concepts
about accounting ratios and decision making. Accounting ratios as an integral
part in decision making, the researcher wanted to investigate whether the use
of accounting ratios can intervene in decision making in AMAZI YA HUYE. Using
accounting ratios and decision making concepts, the researcher will attempt to
relate their theories and what could be their applicability in AMAZI YA
HUYE.
2 1 Definition of key terms
2 1 1 Accounting
Accountancy or accounting is the art of communicating
financial information about a business entity to users such as shareholders and
managers. The communication is generally in the form of financial statements
that show in money terms the economic resources under the control of
management.
2 1 2 Ratios
According to the Webster's New Collegiate Dictionary, Mass:
G&C (1975: 958), a ratio is defined as «the indicated quotient of two
mathematical expressions» and as «the relation between two or more
things»
(Rustagi R.P., 2000: 53) notes that; a ratio is a relationship
expressed in mathematical terms between two individual and groups of figures
connected with each other in some logical manner.
2.1.3 Accounting ratios
2 1 4 Financial ratios
These are tools for interpreting financial statements to provide
a basis for valuing securities and appraising financial and management
performance.
2 1 5 Decision making
It is the study of identifying and choosing alternatives based
on the values and preferences of the decision maker. Decision making is also
the process of sufficiently reducing uncertainty and doubt about alternatives
to allow a reasonable choice to be made from among them. (Robert Version,
1998).
2 2 Essence of Ratios Analysis
The essence of the financial soundness of a company lies in
balancing its goals, commercial strategy, product-market choices and resultant
financial needs. The company should have financial capability and flexibility
to pursue its commercial strategy.
According to (Butters, K.J., 1981: 3-7), ratio analysis is a
very useful analytical technique to raise pertinent questions on a number of
managerial issues. While assessing the financial health of a company with the
help of ratio analysis answers to questions relating to the company's
profitability, as sets utilization, liquidity, financing and strategies
capabilities may be sought.
2 3 Standards of Comparison
The ratio analysis involves comparison for useful
interpretation of financial statements. A single ratio in itself does not
indicate favorable or unfavorable condition. It should be compared with some
standard.
According to (Anthony, R. N. and Reece, J. S, 1975:
260-263), standards of comparison may consist of:
· Past ratios: ratios
calculated from the past financial statements of the same firm;
· proj ected ratios: ratios developed using the
projected or pro forma financial statements of the same firm;
· competitors `ratios: ratios of some selected
firms, especially the most progressive and successful competitor, at the same
point in time and
· Industry ratios: ratios of the industry to which
the firm belongs. 2 3 1 Time series analysis
This is the way used to evaluate the performance of a firm by
comparing its current ratios with the past ratios. It gives an indication of
the direction of change and reflects whether the firm's financial performance
has improved, deteriorated or remained constant over time. (I. M Pandey, 1995:
105)
2 3 2 Pro forma analysis
Sometimes future ratios are used as a standard of comparison.
Future ratios can be developed from the pro forma financial statements. The
comparison of current ratios and the future ratios shows the firm's relative
strengths and weaknesses in the past ant the future ratios indicate weak
financial position, corrective actions should be initiated. (I. M Pandey, 1995:
105)
2 3 3 Industry analysis
To determine the financial condition and performance of a
firm, its ratios may be compared with average ratios of industry of which a
firm is a member. This sort of analysis helps to ascertain financial standing
and capability of the firm vis-à-vis other firms in the industry.
Industry ratios are important standards in view of the fact each industry has
its characteristics which influence the financial and operating relationship.
(I. M Pandey, 1995: 105)
2 3 4 Cross-sectional analysis
It consists at comparing ratios of one firm with some selected
firms in the same industry at the same point of time. This kind of a comparison
indicates the relative financial position and performance of the firm. A firm
can hardly resort to such a comparison, as it is difficult to get the published
financial statements of the similar firm. (I. M Pandey, 1995: 105)
2 4 Types of analysis using accounting ratios in decisions
making
2 4 1 Analyzing Liquidity
Liquid assets are those assets that can be converted into cash
quickly. The short-term liquidity ratios show the firm's ability to meet
short-term obligations. Thus a higher ratio (#1 and #2) would indicate a
greater liquidity and lower risk for short-term lenders. The Rule of Thumb (for
acceptable values): Current Ratio (2:1), Quick Ratio (1:1) While high liquidity
means that the company will not default on its short-term obligations, note
that by retaining assets as cash, valuable investment opportunities might be
lost. Obviously, Cash by itself does not generate any return only if it is
invested will we get future return. In quick ratio, we subtract the inventories
from total current assets since they are the least liquid (among the current
assets. (Prof. Phill Russeil, 2003)
Since the cash is the most liquid asset, a financial analyst
may examine the ratio of cash and its equivalent to current liabilities. Trade
investment and marketable securities are equivalent of cash therefore they may
be included in the computation of current ratio. (I.M Pandey, 1995: 112).
1. Current Ratio = Total Current Assets/Total Current
Liabilities
2. Quick or Acid-test Ratio = Total Current Assets - Inventories
/Total Current Liabilities
3. Cash ratio = Cash + Marketable securities/Current
liabilities.
These ratios show the extent to which a firm is relying on
debt to finance its investments/operations and how well it can manage the debt
obligation. Obviously, if the company is unable to repay its debt or make
timely payments of interest, it will be forced into bankruptcy. On the positive
side, use of debt is beneficial as it provides valuable tax benefits to the
firm. Note total debt should include both short-term debt (bank advances +
current portion of long-term debt) and long-term debt (such as bonds, leases,
and notes payable). (Prof. Phill Russeil, 2003).
Asset-Equity Ratio or Leverage Ratio= Assets/Shareholder's
Equity
This shows firm's reliance on external debt for financing (or
the degree of leverage). Any number above 100% shows that the company relies on
external debt for financing some of its assets. If the number equals 100%, it
implies that the assets are fully financed by the shareholders.
Some analysts tend to use the Debt ratio (given by total
Debt/total assets) or Debt/Equity ratio given by total long-term debt/equity).
These ratios also show company's reliance on external sources for financing its
assets. (Prof. Phill Russeil, 2003)
1. Total Debt ratio = Total Debt/Total assets
2. Debt-Equity Ratio = Total Debt/Equity
3. Long-term Debt to capital = Debt/Debt + Equity
For a lender, more important than the degree of leverage is the
firm's ability to service the debt and this is captured in the following
ratio.
2 4 3 Analyzing Sales and Profitability
Profitability is a relative term. It is hard to say «what
percentage of profits» represents a profitable firm as the profits will
depend on the product life cycle, competitive conditions in the market,
borrowing costs, expense management. Analysts will be interested in the
(historical and forecasted), the set of ratios here include some of the
traditional earnings based performance
measures such as ROS, ROA, ROI, and ROE. For a better
understanding of growth rates, it will be useful to know the «real growth
rate» as opposed to «nominal growth rate». For example, it is
quite possible that the sales growth rate figures are impressive due to
inflation (rather than an increase in the number of items sold). (Prof. Phill
Russeil, 2003).
The following are ratios selected to analyse profitability and
sales ;
1. Sales Growth Rate = {(Current year sales - last year
sales)/last year sales} * 100
2. Expense analysis = various expenses /Sales
3. Gross Margin/Sales = Gross Profit/Total Sales
4. Operating Profit/Sales = Operating Profit/Net Sales
5. EBIT to Sales = EBIT/Net Sales
6. Return on Sales (ROS) or net profit ratio = Net Income/Net
Sales
7. Return on Investment (ROI) = Net Income/Total Assets
8. Return on Assets (ROA) = Net Income/Total Assets
9. Return on Equity (ROE) = EAT/Shareholders' Equity
10. Payout ratio = Cash Dividends/ Net Income
11. Retention ratio = Retained Earnings/Net Income
12. Sustainable growth rate (SGR)= ROE * Retention Ratio
It is useful to disaggregate the ROE figure into three
elements as follows to get a better insight 13 ROE = {Net Income/Sales} *
{Sales/Assets} * (Assets/Equity)
The above formulation clearly shows that if management wishes
to improve their ROE, they need to improve profitability, efficiently use the
assets, and optimize the use of debt in their capital structure.
SGR shows how much the company will grow in the future if some
of the key ratios remain the same as in previous years. It is useful to
disaggregate the sustainable growth rate (SGR) as follows.
? SGR = f (Profitability, Asset Efficiency, Leverage, Dividend
policy)
· SGR = Return on Sales * Asset turnover ratio * Leverage *
Retention ratio
· SGR= (Net income/sales) * (sales/assets) *
(assets/equity) * (RE/net income)
2 4 4 Analyzing Efficiency
These ratios reflect how well the firm's assets are being
managed. The inventory ratios show how fast the inventory is being produced and
sold. Ratio #1 shows how quickly the inventory is being turned over (or sold)
to generate sales higher ratio implies the firm is more efficient in managing
inventories by minimizing the investment in inventories. Thus a ratio of 12
would mean that the inventory turns over 12 times or the average inventory is
sold in a month. Some High ratio by itself does not mean high level of
efficiency as high ratio could also mean shortage. Ratio #2 is referred to as
the «shelf-life» i.e. how many days the inventory was held in the
shelf. Ratio #3 shows how much sales the firm is generating for every currency
unit of investment in assets, naturally, higher the better. However, note that
this ratio is biased (as assets are listed at historical costs while sales are
based on current prices). Ratios #4 and #5 show the firm's efficiency in
collecting from credit sales. While a low ratio is good it could also mean that
the firm is being very strict in its credit policy, which may drive away some
customers. Ratios #6 and 7 focus on efficiency in making payments. (Prof. Phill
Russeil, 2003)
1. Inventory Turnover = Cost of Goods Sold/Average Inventory
2. Days in Inventory = (Average Inventory/Cost of Sales)*365
3. As sets turnover = Net Sales/Total As sets
4. Receivables Turnover = Credit Sales/Accounts Receivables
5. Average Collection period = (Accounts Receivable/Net Sales)*3
65
6. Accounts Payable turnover = Purchases/Accounts Payable
7. Days AP outstanding = (Accounts Payable/Cost of Sales)*3
65
2.4.5 Multiple Discriminant Analysis
The use of MDA helps to consolidate the effect of a set of
ratios by looking at a number of separate clues (ratios to sickness or
failure).It would be more useful to combine the difference ratios into a single
measure of the probability of sickness or failure (bankruptcy).
According to (Altman E., 1968: 589-609), as the first man to
apply discriminant analysis in finance for studying bankruptcy, his study
helped in identifying five ratios that were efficient in predicting
bankruptcy.
The model was developed from a sample of 66 firms half of which
went bankrupt. He derived the following discriminant function:
Z = 0.01 2X1+0.0 1 4X2+0.03 3X3+0,006X4+0.999X5 Z= discriminant
function score of a firm;
1. X1= net working capital/total assets (%);
2. X2= retained earning/total assets (%);
3. X3= EBIT/total assets (%);
4. X4=market value of total equity/book value of debt (%);
5. X5= sales/total assets (times)
Alman, established a guideline Z score which can be used to
classify firms as either financially sound a score above 2.675 or a headed
towards bankruptcy a score below 2.675. The lower the score, the greater the
like hood of bankruptcy and vice versa.
2.4.6 Trend Analysis
Using the past history of a firm for comparison is called
trend analysis. By looking at the trend in a particular ratio, one sees whether
that ratio is failing, rising, or remaining relatively constant. From this, a
problem is detected or good management is observed. (Charles H.GIB SON, 1989:
123).
2.5 The Components of Decision Making 2.5.1
Decision environment
decision environment would include all possible information, all
of it accurate, and every possible alternative.
However, both information and alternatives are constrained
because the time and effort to gain information or identify alternatives are
limited (Robert Version, 1998).
2.5.2 Decision Model
Decision model can be used to represent a productive system in
mathematical terms. A decision model is expressed in terms of performance
measures, constraints, and decision variables. The purpose of such a model is
to find optimal or satisfactory values of decision variables which improve
systems performance within the applicable constraints. These models can then
help guide management decision making. (ROGER G. SCHROEDER, 1985: 7).
2.5.2.1. The effects of using a decision model
A decision model has great impact on the profits of the
company. It forces the management to rationalize the depreciation, inventory
and inflation policies. It warns the management against impending crises and
problems in the company. It specially helps in following areas:
- The management knows exactly how much credit it could take,
for how long (for which maturities) and in which interest rate. It has been
proved that without proper feedback, managers tend to take too much credit and
burden the cash flow of their companies.
- A decision model allows for careful financial planning and
tax planning. Profits go up, non cash outlays are controlled, tax liabilities
are minimized and cash flows are maintained positive throughout.
- As a result of all the above effects the value of the company
grows and its shares appreciate.
The decision model is an integral part of financial
management. It is completely compatible with financial ratios analysis and
derives all the data that it needs from information extant in the financial
statements of the company.
2.6 Uses and limitations of Ratio Analysis 2.6.1 Uses
· To evaluate performance (compared to previous years);
· To set benchmarks or standards for performance;
· To highlight areas those need to be improved or highlight
areas that offer the most promising future potential;
· To enable external parties (such as investors/lenders) in
assessing the creditworthiness/profitability of the firm.
2.6.2 Limitations
· There is considerable subjectivity involved as there
is no theory as to what should be the «right» number for the various
ratios. Further, it is hard to reach a definite conclusion when some of the
ratios are favourable and some are unfavourable.
· Ratios may not be strictly comparable for different firms
due to a variety of factors such as different accounting practices, different
fiscal year.
· Ratios are based on financial statements that reflect the
past and not the future. Unless the ratios are stable, one cannot make
reasonable projections about the future trend.
· Financial statements provide an assessment of the
costs and not value. For example, the market value of items may be very
different from the cost figure given in the balance sheet.
· Financial statements do not include all items. For
example, it is hard to put a value on human capital (such as management
expertise).
· Accounting standards and practices vary across countries
and thus hamper meaningful global comparisons.
CHAPITER III
METHODOLOGY
3 0 Introduction
This chapter explains methods and instruments used to
collect, analyze and to test the hypothesis the use of accounting ratios guides
management as an effective tool in decision making.(Kenneth R. HOOVER, 1988:
33) says «the scientific method is the method that seeks to test thoughts
against reality in a disciplined manner with each step in the process made
explicit». This section covers the methods that the researcher is going to
use to obtain the necessary data to achieve the objective and to come up with a
suitable conclusion.
3 1 Research Design
Research design refers to outline, plan or strategy
specifying the procedure to be used in investigating the research problem.
(Christensen, 1991: 269). In the due course the researcher collects relevant
data needed to test the researcher hypothesis. The design of the study is
analytical in nature.
3 1 1 The analytical research
According to (Jill and Roger Hussey, 1997: 11) the analytical
research design is continuation of the descriptive research. The researcher
goes beyond merely describing the characteristics to analyzing and explaining
why and how it is happening. Thus, this research aims to understand the use of
accounting ratios by measuring causal relation among them in decision
making.
In this study the researcher adopted a case study approach,
where by AMAZI YA HUYE was particularly chosen. According to (CHRISTENSEN,
1991: 92), a case study is an intensive description and analysis of single
individual, organization or event, based on information obtained from a variety
of sources. It is in this regard AMAZI YA HUYE was chosen because the
researcher was interested in manufacturing enterprises.
3 2 Population of the Study
As (Grinnell and Williams, 1990: 118), put it that, «a
population can be defined as the totality of persons or objects with which a
study is concerned». The population was comprised sorely the staff
managers and accountant of AMAZI YA HUYE, financial statements and other
records available of the 5 year period, which are from 2003-2007.
Table 3 1 Total population of Management and
Accounting departments of AMAZI YA HUYE Description Population Sample
selected Technique used Basic for
selection
Managers 2 1
Accountants 4 3
Cashier 3 2
|
Universal
|
The selection of the population was based on the role of each
personnel plays in decision
making
|
Total 9 6
|
|
|
Source: Primary data 3 3 Sources of
Data
Data source refers to any material consulted or used in the due
course of the study. Both the primary and secondary data were used in the
study.
3 3 1 Primary Data
As put forward by (HAGOOD and PRICE, 1952: 20) «if a
person or agency that has published data has earlier been collected or
supervised the collection of data, the publication is called a primary
source.» (Audrey et al, 1989: 57) adds that «primary sources come
straight from people or workers you are researching and therefore the most
direct kind of information you can
collect». That is the reason why primary data were first
hand gathered by the researcher himself as a result of the researcher's
investigation.
3 3 2 Secondary Data
Roth further states that these are one step removed from the
original and are often an examination of a study someone else has made on a
subject or an evaluation of commentary, or summary of primary materials,
journal articles, critical reviews are the most common secondary sources.
The secondary sources of data for this study included financial
statements, company records, internet publications, library books and
memoires.
3 4 Data Collection Techniques
Documentary review (library, internet search and financial
statement) was used to collect secondary data while primary data was obtained
through interview guide
3 4 1 Documentary Review
A number of documents available in the library, on the
internet, memoires and financial statements of the company chosen as a case
study, were consulted for the purpose of obtaining secondary information
relevant to the subject matter.
3 4 2 Document Analysis
(Paige Wilson, 1989:3) stated that a document analysis
«is a system which formally acknowledges the sources consulted for
researcher». The document review was based on the consultation of the
company's annual reports, journal and other documents. The researcher used the
balance sheets and income statements of the five year period to analyze,
interpret and comment on different types of accounting ratios. The advantage of
this method is that the researcher got useful information about the company's
financial health which would be difficult to acquire using other instruments
3 4 3 Interview Guide
This technique involves exchange of ideas between the
interviewer (researcher) and the interviewee (managers) to get the opinion of
the interviewee on the use of accounting ratios in decision making. During the
course of interview, notes were taken after asking questions on any information
relevant to the study by the interviewer.
3 4 4 Sample size and selection
According to (William G. Cochran, 1997: 126) a sample is a
part of population which is deliberately selected for the purpose of
investigation. For our case study, the sample size is 6 people. The researcher
selected two respondents from the top management and four from financial
executives. The researcher chooses them because they are only respondents who
can provide relevant information concerning the use of accounting ratios n
decision making (AMAZI YA HUYE as the case of the study).
3 5 Sampling technique
The sampling technique that the researcher will use in this
study is universal sampling. According to (Richard & Margaret, 1990: 125)
«Universal sampling refers to the selection of sample where not all the
people in the population have the same profitability of being included in the
sample and each one of them, the probability of being selected is unknown.
The researcher preferred to use universal sampling technique
to select respondents from the top management and finance department because
they are the ones who may provide the useful information to test the hypothesis
of this research.
3 6 Data processing and analysis
(Nachimias D. and Nichimias C., 1976: 143) argue that
«data processing and analysis involves the transformation of data gathered
from the field into a systematic categories and the transformation of these
categories into codes to enable quantitative analysis and tabulation; the data
collected was classified into a meaningful manner for easy interpretation and
understanding.
This involves preparing data collected into some useful,
clear and understandable data. The whole exercise involved calculations of
different types of ratios to analyze, liquidity, debt, efficiency, sales and
profitability, compute the trend analysis and the multiple discriminant
analysis for the secondary sources.
While for the first hand information the researcher has
summarized the recorded interview (discussion).
3 7 Study limitations
Some limitations were encountered during the process of data
collection; however salutation were sought in order to make the findings of the
study available as planned. The following are the limitations that were
encountered:
· Financial constraints as funds provided by the National
University for the research were delayed.
· Access to the financial statements of companies in Rwanda
is not easy Solutions to the above limitations:
· The researcher has to borrow funds from friends and ask
support to his family members in order to accomplish the research in time
· A letter of authorization from the university was used
by the researcher as evidence to the management staff of AMAZI YA HUYE to prove
that the research is conducted for the academic purpose
CHAPTER IV
DATA ANALYSIS AND INTERPRETATION
4 1 Introduction
This chapter presents the findings of the study entitled
«the use of accounting ratios in decision making» in AMAZI YA HUYE.
It also presents a brief description of AMAZI YA HUYE as the case study. It
also based on the analysis of both primary and secondary data collected to
achieve the stated objectives. The analysis of the data collected was done in
accordance with the study objectives and hypothesis. The results were reported
in tables and summarizing answers to major questions asked. The researcher used
focus group interview to obtain first hand information, whereby all six staff
of the company who deal with accounting and finance were involved in the
discussion. In short, this chapter examines the empirical evidence and
establishes grounds upon which the researcher hypothesis can be proved before
concluding the results of this research.
4 2 The Profile of AMAZI YA HUYE
AMAZI YA HUYE is a private company that was formed in 1998, with
the key aim of mineral water production and its base is in Huye District former
Butare town in the Southern Province.
Their first mineral water product appeared at the market
beginning with the year 2000, after the scientific laboratory experiment by the
University of Shanghai in china. Experts from this University confirmed the
purity of the mineral water manufactured by AMAZI YA HUYE enterprise
AMAZI YA HUYE Company do not only produce mineral water but also
produces the plastic bottles into which their mineral water products are
packed.
4 1 2 AMAZI YA HUYE location
Its head office is in Kigali city at Muhima near Kabuga's
building because of availability of large market. This company still sells its
products locally but it imports its raw materials abroad specifically from
China.
4 3 AMAZI YA HUYE's mission
It seeks to increase the productive capacity of the mineral
water and play a key role in transforming the economy and enhancing the well
being of people. Through their dynamic and responsive teams, it aims at
providing the products and maintains the highest levels of customer service and
professional integrity.
4 4 AMAZI YA HUYE's objectives
> To support the development of the industrial sector
generally through innovative and the transfer international best practice.
> To support the drive of the private sector investment for
the development of the economy working with locals as well as international
investment and development focused agencies.
> To meet needs and expectations of its customers by providing
the products at the right quality and at the right time.
4 5 The environment of AMAZI YA HUYE
The AMAZI YA HUYE Company is not a monopoly one but operates with
a perfect competition market structure.
In order to adapt itself to the business investment, this
enterprise makes sure that it has a good relationship with the commercial banks
and even other industries operating in Rwandan territory and other
countries.
4 6 Juridical statute of AMAZI YA HUYE
AMAZI YA HUYE enterprise is an individual Industrial company
of Mr. GAKWAYA Etienne whose capital was 83,404,822 RWF at the beginning in
1998 but currently the capital is 149,000,000 RWF
Figure 4 1 Organization structure of AMAZI YA
HUYE
Executive Director

Director of commerce

|
IT Manager
|
|
|
|
Chief Accountant
|
|
Importation Officer
|
|
Engineer
|
|
Human
Resou rce
manager
|
|
|
|
|
|
|
|
|
|
|
|
|
|
|
|
|
|

|
Accountant A
|
|
Acco unta nt
|
|
|
|
Secretary
|
|
Cashier
|
|
|
Acco unta nt
|
|
|
|
|
|
|
|
|
|
|

|
Manpower
|
|
Drivers
|
|
Officer messengers
|
|
|
|
|
Source: Marketing Department of AMAZI YA HUYE.
4 7 Tasks description
By making description of the above organization structure,
different tasks attributed to general management and different departmental
services are precised in accordance to the organizational arrangement of the
chart.
A. Executive Director
The executive director of AMAZI YA HUYE is responsible for
taking all the dec isions relating to effective management and policy
formulation of the enterprise. He is also in charge of the following
activities:
- To insure the coordination and management of different
department like commercial service, production service and financial
service.
B. Director of commerce
This one is responsible for the evolution of commercial and
marketing services and making survey on the areas of competition. He takes
measures on the quality and quantity of mineral water to be taken to the
market, he makes follow-up on the buying and the selling conditions, for the
interest of the clients.
Sometimes he proceeds to the ground to investigate the consumers
perception upon certain decisions under took and these assist him to underlay
appropriate strategies.
C. Human resource manager
The human resource manager is in charge of recruitment of the
employees and makes sure that the recruited employees are ones with competent
skills which can lead to the general improvement of the company' s
performances.
He assigns duties and responsibilities to the employees and
makes supervisions to different department to approve if the delegation of
power is respected by departments.
He posses power to appoint and dismiss misbehaved workers after
his consent with the executive director.
D. Accounting department
The responsibilities of this department are as follows:
- Keeping records of the day to day business transactions
- Preparation of the financial statements of the company
- Keeping the books of accounts like the journals, ledgers and
trial balance.
- Recording the daily operations of expenses and revenues of the
company of AMAZI YA HUYE
- Analyzing financial transactions and gives information to the
management and the third parties.
- Advising the top management on the financial position and
decision making.
E. Importation officer The importation officer
has the following key duties:
- He makes sure that all the logistical and procurement services
are done smoothly with in the enterprise.
- Importation of required technical instruments to run
enterprise's daily production affairs. - Monitoring on the quality of
production basing on capacity of machines.
F. Engineer The responsibilities of an engineer
include:
- Rendering mechanical services at any time when technical
errors happen. - Repairing of machines that have experienced technical
problems.
- Control and measures the electricity used by the company.
G. IT Manager: This one has got the following
tasks
- System soft ware in the company
- Distribution of information system in all the departments -
Repair of computers that are experiencing errors.
4 8 Data analysis
has been a result of a number of factors, but the main factor
is a lack of rational decision making. As finalist student in Accounting
Sciences in this research, we picked interest in one of techniques that is
commonly used in decision making since it naturally provides much information
in almost every aspect of the business. The researcher was motivated to find
out the effectiveness of using accounting ratios in decision making of the
enterprise. The student was also interested in knowing whether this techniques
is used or not, and what could be the requirement to use them effectively.
4 8 1 In depth Interview
To the opinion of the accountant and management department
executives on important issues related to accounting ratios group interview (in
depth interview) was conducted. All six staff of management department in AMAZI
YA HUYE was interviewed including the accountants of this enterprise
The discussion took place at AMAZI YA HUYE headquarter as well
as at the factory residence whereby all the participants were requested to
think on all matters concerning accounting ratios in AMAZI YA HUYE. After each
interview, notes are taken to unable analysis to be made. For some question
clarifications are given to the interviewee so that they can give their views
and opinions.
The discussion was designated to accomplish the following
objectives:
1. To identify the importance of using accounting ratios in
decision making
2. To know whether accounting ratios are used in AMAZI YA
HUYE
3. To determine the linkage between accounting ratios and
decision made in AMAZI YA HUYE
4. To determine other factors used in decision making
5. To identify the constraints that hinder the proper use of
accounting ratios
4 8 2 Type of ratios used
For this purpose 32 ratios were selected based upon a review
of text books. These ratios were divided into 5 categories of analysis, such as
ratios to use in analyzing liquidity, efficiency, sales profitability, debt,
and in multiple dicsriminant analysis. The management staff of AMAZI YA HUYE
disclosed that ratios are frequently used by the company in analyzing
profitability and liquidity. They said that ratios used in this manner are more
significant to take any decision.
After knowing that accounting ratios are used in AMAZI YA HUYE
as a tool of analysis in decision making and after knowing that the staff
management of AMAZI YA HUYE are interested in their use in decision making the
researcher wanted to investigate how this technique is used.
4 8 3 Preferred ratios in decision making
To determine the preferred ratios the researcher asked the
following question» What among the following kind of accounting ratios do
you take into account while making decisions and for which purpose?»
· Liquidity ratios
· Debt ratios
· Efficiency ratios
· Sales and profitability ratios
One of the respondent said that while analyzing liquidity
position liquidity ratios are used, in analyzing efficiency of the company
inven tory turnover ratio is used and some ratios are used especially in
analyzing sales and profitability.
4 8 3 1 Preferred ratios in analyzing liquidity
Basing on the review of text books, the researcher chose the
following ratios in analyzing liquidity:
· Current ratio
· Quick ratio (acid test ratio)
· Cash ratio
As said in the above response these ratio are used in analyzing
liquidity position of the company. One of the managing explained that the use
of this kind of ratios presents an importance to the company because it helps
to know the level at which the company can pay its short term debts.
4 8 3 2 Preferred ratios in analyzing efficiency
Concerning efficiency ratios, the researcher chose some of them
basing on the review of text books. Following are some of these ratios:
· Inventory Turnover
· Days in Inventory
· Assets turnover
· Receivables Turnover
· Average Collection period
· Accounts Payable turnover
· Days AP outstanding
The management staff showed much interest in efficiency
ratios, one of them said,» efficiency measuring is very important for
any business», He went on commenting that, the efficiency ratios can
help to adjust the inventory to sales collection using inventory turnover, days
in inventory. Most of them had the same views but the put emphasize on
profitability ratios by saying, «When a company is profitable it means
that it is efficiently performing its operations».
4.9.3.3 Preferred ratios in analyzing debt
Basing on the review of text books, the researcher chose the
following set of ratios to analyse debts of our case study.
· Total Debt ratio
· Debt-Equity Ratio
· Long-term Debt to capital
· Asset-Equity Ratio or Leverage Ratio
One of the management staff said that debt ratio help to measure
the extent to which a company rely on outsiders funds.
4 10 Accounting ratios and decision making
To determine whether there exists a linkage between accounting
ratios and organization sustainable growth, the researcher asked the following
question to the respondents «Do you agree that, the use of accounting
ratios can lead to the decision making?» The following table shows
categories of their responses:
Table 4 1 Respondents' view on the linkage
between accounting ratios and decision making
Personnel
Responses
Agree 3
Disagree 1
Neutral 2
Source: Primary data
There seems to be a majority who agree that there is a linkage
between accounting ratios and decision making. The chef accountant commented
that decision model like financial ratios plays a great role in assessing the
financial performance of the company but he presented the problem of a lack of
capacity to use them. One of the accounting department said, though
financial ratio analysis is not the only measure of performance, still it is
the best to measure the financial health of the company to take any
decision.
added that this tool is as important as accounting
ratio. The researcher asked which purpose the have while using this
method; he replied that the use a flexible budget since it gives room for any
change in the future.
Another participant added that in AMAZI YA HUYE they put more
emphasize on the importance of preparing budget for each cots center. The
researcher wanted to know different kinds of budget prepared there, one of the
respondent said, here we prepare various budget like purchase budget, sales
budget, production budget, selling and distribution budget.The remaining
participant didn't to have any comment because she said that her task have no
linkage with decisions taken in the company because she is a book keeper.
The researcher if there are any techniques used to make
decisions that avoid bankruptcy as it had occurred to SORWAL SARL, among this
type of analysis the researcher presented them a set of significant ratios used
in the multiple discriminant analysis. The manager officer said, this could
be the effective tool to take decision for avoiding bankruptcy but he added
that is not yet used in their company. He concluded by saying that,
what is important is to use the accounting ratios as a decision model
effectively, but he insisted saying that the problem related with such
use is a lack of skilled people in this area.
4 11 Analysis of accounting ratio as a decision
model
The secondary data also are used as source of information of a
part of the analytical research, for this reason, financial statements of five
consecutive years of AMAZI YA HUYE are used, that is from 2003 to 2007. The
following analysis was done basing on the secondary data
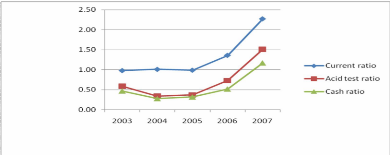
4 11 1 Liquidity analysis
The table below presents the trend of liquidity position of the
company as far as current, quick and cash ratios are concerned, from
2003-2007.
Table 4 2 Trend of liquidity ratios
|
Formula
|
2003
|
2004
|
2005
|
2006
|
2007
|
|
RATIOS
|
|
|
|
|
|
|
|
Current ratio
|
Current asset/current liabilities
|
0.98
|
1.01
|
0.99
|
1.36
|
2.27
|
|
Current asset-Inventory/current
|
|
|
|
|
|
|
Acid test ratio
|
liabilities
|
0.59
|
0.34
|
0.37
|
0.73
|
1.51
|
|
Cash+ Marketable
|
|
|
|
|
|
|
Cash ratio
|
securities/Current liabilities
|
0.47
|
0.28
|
0.32
|
0.52
|
1.17
|
Source: Computed from secondary data Ratio
interpretations
We compare the results of the current ratio basing on the
standard ratio 2: 1. As far as the current ratio is concerned, it was 0.98:1 in
2003 that is not satisfactory even for three successive years of 2004, 2005 and
2006 the ratio computation is 1.01, 0.99.1.36 respectively, for this case the
liquidity position went down below the standard but in 2007, the ratio was
satisfactory as it was above the standard 2:1, as it was 2.27:1.
Compared to the standard of 1:1 the quick ratio of the company
shows unsatisfactory situation from 2003 till 2006, as in 2003 it was 0.59:1,
in 2004 it was 0.34, in 2005 it was 0.37:1 and in 2006 it was 0.73 :1. Since
2007 the ratio became satisfactory as its result was 1.51:1.
As far as the cash ratio is concerned, it is 0.47:1 in 2003,
0.28: 1 in 2004, 0.37:1 in 2005, 0.52:1 in 2006 and 1.17:1 in 2007. Basing on
the standard of 0.5: 1, the result of this ratio shows unsatisfactory case in
2003, 2004 and 2005. But in 2006 and 2007 there is a satisfactory situation of
liquidity as the ratio computation is 0.52:1 in 2006, 1.17:1 in 2007, what we
can also include to the result of 2007 is that there is a portion of idle
resources of 0.17.
Figure 4 2 AMAZI YA HUYE Liquidity ratios 2003 -
2007
RATIOS
Time years
Comments
As the table 4 3 and fig 4 1 show, the company' liquidity
ratios exbhit a diclining pattern from 2003 to 2005 basing on the rule of
thumb.As shown by the above figure, the cuurent ratio, quick ratio, and the
cash ratio dropped from the recommendable ratio in 2003,2004 and 2005 as per
the role of thumb, 2:1 to current ratio, 1:1 to quick ratio, 0.5:1 to cash
ratio, that prove the less liquidity to meet the short term obligations, basing
on the above analysis, in 2003, and 2005 the company has no working capital
even in 2004 it was not interesting. The situation got change in 2006 and get
improvement in 2007 when the results shows the figures above the recommendable
ratio.
4 11 2 Debt analysis
The following table indicates the trend of Debt ratios in AMAZI
YA HUYE for the period of our research that is 2003 - 2007.
Table 4 3 Trend of debt ratios
|
Formula
|
2003
|
2004
|
2005
|
2006
|
2007
|
|
RATIOS
|
|
|
|
|
|
|
|
Leverage ratios
|
Assets/Shareholder's equity
|
2.12
|
1.83
|
2.22
|
1.75
|
1.35
|
|
Total debt ratio
|
Total debt/total asset
|
0.52
|
0.45
|
0.53
|
0.42
|
0.26
|
|
Debt to equity ratio
|
Total debt/equity
|
1.12
|
0.84
|
1.13
|
0.75
|
0.35
|
|
Long term debt to capital
|
Debt/Debt Equity
|
0.52
|
0.45
|
0.53
|
0.42
|
0.26
|
|
Interest coverage ratio
|
EBIT/Annual interest expenses
|
0.53
|
0.46
|
0.53
|
0.43
|
0.26
|
Source: Computed from secondary data Ratio
interpretation
The total debt ratio indicates the extent to which the firm is
using debt to finance its assets. The better when the ratio is 0.5:1 or less.
In 2003 the ratio was 0.53:1, in 2004 it declined to 0.45:1, in 2005 it got
increase to 0.53:1, in 2006 it deceased when it was 0.42 and in 2007 it was
0.26:1.
The result of debt to equity ratio indicates the relationship
between lenders' contribution for each franc of the owners' contribution. It in
this case, the lenders have contributed more in 2006 for 1 franc given by the
owners the lenders give 1.12, and in 2005 for 1 franc from owners the lenders
provide 1.13. For the other periods the situation was good as in 2004 for one
franc from the owners, lenders provide 0.84, in 2006 for 1 franc from the
owner, lenders provide 0.75, and in 2007 for 1 franc from the owners, lenders
provide 0.35.
The total leverage ratio relates total as sets to shareholders
`equity. This ratio is a degree to which
management has financed the
company's asset investment with no ownership capital. The result
of the
leverage ratio computation for AMAZI YA HUYE reveals the following situation:
in 2003
the ratio was 2.21 which means, to 1 franc from owners 1.12
has been used to find the company's assets from outsiders, in 2004 the ratio
was 1.83, to 1 franc from owners, outsiders provide 0.83 to fund the company's
assets, in 2005 the ratio was 2.22, to 1 franc from owners, outsiders provide
1.22 to fund the company's assets, in 2006 the ratio was 0.75, to 1 franc from
owners the outsiders provide 0.75, in 2007 the ratio was 0.32, to 1 franc from
owners the outsiders provide 0.32.
Figure 4 3 AMAZI YA HUYE debt ratios 2003 -
2007

RATIOS
Time in years
Comments
The debt ratios generate the company's ability to meet its
obligations, otherwise it measures the dependability of the company to the
outsiders. Basing on the ratio computation in table 4 3 and its representation
in figure 4.3, in 2003 there was an increase in dependability of the company to
the outsiders funds, it declined in 2004, but in 2005 it increased which means
that in this period the claims of creditors were greater than those of owners.
Starting to 2006 till 2007 these ratios were trending downward, for this
reason, the dependability to the outsiders declined which shows a good sign of
solvency of the company.
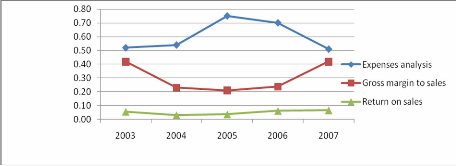
4 11 3 Sales and profitability analysis
The table below shows the sales and profitability of AMAZI YA
HUYE for the period covering five successive years, that is to say 2003 -
2007.
Table 4 4 Trend of sales and profitability
ratios
|
RATIOS
|
Formula
|
2003
|
2004
|
2005
|
2006
|
2007
|
|
Sales growth
|
(current year sales-last year
|
|
|
|
|
|
|
rate
|
sales)/last year sales)*100
|
0.00%
|
15.00%
|
-7.2%
|
-32.04%
|
-1.21%
|
|
Expenses analysis
|
Various expenses/Sales
|
0.52
|
0.74
|
0.75
|
0.70
|
0.51
|
|
Gross margin to sales
|
Gross profit/ Total sales
|
0.42
|
0.23
|
0.21
|
0.24
|
0.42
|
|
Operating profit to sales
|
Operating profit / Sales
|
0.08
|
0.04
|
0.05
|
0.09
|
0.10
|
|
EBIT to Sales
|
EBIT/ Net sales
|
0.08
|
0.04
|
0.05
|
0.09
|
0.10
|
|
Return on sales
|
Net income / Net sales
|
0.06
|
0.03
|
0.04
|
0.06
|
0.07
|
|
Return on investment
|
Net income / Fixed assets
|
1.75
|
1.94
|
1.67
|
1.47
|
1.84
|
|
Return on assets
|
Net income / Total assets
|
0.83
|
1.05
|
0.79
|
0.60
|
0.77
|
|
Return on equity
|
EAT /Shareholder's equity
|
0.09
|
0.58
|
0.06
|
0.07
|
0.07
|
|
Payout ratio
|
Cash dividend /Net income
|
0.00
|
0.00
|
0.00
|
0.00
|
0.00
|
|
Retention ratio
|
Retained earring/ Net income
|
0.01
|
0.01
|
0.01
|
0.01
|
0.01
|
|
Sustainable
growth rate
|
REO*Retention ratio
|
0.0500
|
0.0175
|
0.0021
|
0.0040
|
0.0045
|
Source: Computed from secondary data
Ratio interpretation
The sales growth rate was 0.0 in 2003 as there is no data
given for the previous. Basing on 2003 in 2004 there was growth of 15%, in 2005
comparing to 2004 there was growth of 7.20%, in 2006 basing on 2005 sales there
was growth of -32.04%, and in 2007 there is growth of -1.12% of sales. The
results obtained shows that in 2006 the sales declined with a great percentage
which
follows buy a bit decline in 2007 all of these situations involve
the reinforcements of the marketing activities of the company to ensure a
sustainable growth.
The gross margin to sales ratio is an indication of the
management's ability to mark up its products over their cost. In 2003 the ratio
was 0.42 that means to 1 unit sold the cost of product sold was 0.58, 2004 it
was 0.23 that means to 1 unit sold 0.77 was the cost of product sold, in 2005
it was 0.21 that means to 1 unit sold 0.79 was cost of goods sold, in 2006 the
ratio was 0.24 that means to 1 unit sold 0.76 was the cost of product sold, in
2007 the ratio was 0.42 that means to 1 unit sold the cost of product was
0.58.
The expense analysis ratio shows the rate of expenses incurred
after each sale. It helps to control the expenses comparing to the rate of
margin to sales. The result of this ratio was 0.52 in 2003, in 2004 it was
0.74, in 2005 it was 0.75, in 2006 it was 0.70 and in 2007 it was 0.51.
The return on sales indicates the relationship between sales
and the earning of the period. It helps in controlling expenses with the rate
of margin. In 2003 the ratio was 0.06, in 2004 it was 0.03, in 2004 the ratio
was 0.04, in 2005 it was 0.06, and in 2007 it indicates 0.07.
The return on assets ratio shows the relationship between
total assets and sales realized. The trend of this ratio in AMAZI YAHUYE
indicates that in 2003 for 1 franc invested in fixed and current assets the
return is 0.83 on sales, in 2004 for 1 franc invested in fixed and current
assets the return is 1.05 on sales, in 2005 for 1 franc invested in fixed and
current assets the return is 0.79on sales, in 2006 for 1 franc invested in
fixed and current assets the return is 0.60 on sales, in 2007 for 1 franc
invested in fixed and current assets the return is 0.77 on sales.
The trend of return on investment helps to analyze the income
earned and capital employed. In 2003 to generate 1 franc in sales the company
invested 1.75 in fixed assets , in 2004 to earn 1 franc in sales the company
invested 1.94 in fixed assets, in 2005 to generate 1 franc in sales the company
invested 1.67 , in 2006 to earn 1 franc in sales the company 1.47 , in 2007 to
generate 1 franc in sales the company invested 1.84.
The return on equity indicates how well the company has used
the owners's resources. In our
case study, the result of this ratio was 0.09
in 2003, 0.058 in 2004, 0.06 in 2005, and 0.07 in
2006 and in 2007. The
percentage of this ratio reveals the relative performance and strength of
the company in attracting future investments; it means that in
2003 the capacity of AMAZI YA HUYE was too high comparing to the following
years when it declined slightly till the level of 7% in 2007.
Figure 4 4 AMAZI YA HUYE expenses analysis, gross
margin to sales, return on sales ratios
2003-200 7
RATIOS
Time in years
Comments
Basing on the results from the table 4 4, from 2003 to 2006,
there was a decrease of gross margin ratio, but on the other side there was an
increase in expenses as shown in expenses analysis ratio. This situation leads
to the reduction of net profit regarding these periods that means there is no
expenses management basing on sales and cost of goods sold. This set of ratio
can help to take measures for the future sales and their expenses. In 2007, we
consider a slight decrease of gross profit margin, as well as a slight increase
in expenses analysis ratio which provide a bit higher return on sales ratios
comparing to the previous periods.
The above comments are depicted in the figure 4 4 that
represents together gross profit margin ratio, expenses analysis ratio, and
return on sales ratio of AMAZI YA HUYE from 2003 to 2007. In 2003-2005 the
expenses curve was upward sloping comparing to the gross profit curve that was
down ward sloping in 2006-2007 the expense curve changed, it was down ward
sloping, comparing to the gross profit curve that was up ward sloping. These
situations make an impact on the net profit of the company that could be
greater in 2003-2005, but the expenses became uncontrollable comparing to the
margin of cost of raw material to sales realized in that time, in the following
two years, the expenses management was controlled basing on cost of raw
material
to sales, the reason the sales turnover was lower than the
previous years but the net profit was somehow closer to those of these periods
even the sales turnover of these periods was higher (2003, 2004 and 2005).
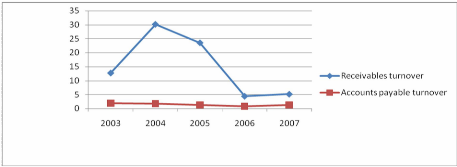
4 11 4 Efficiency analysis
The table below shows the trend of the efficiency ratios of AMAZI
YA HUYE from 2003 - 2004.
Table 4 5 Trend of efficiency ratios
|
RATIOS
|
Formula
|
2003
|
2004
|
2005
|
2006
|
2007
|
|
Inventory
|
Cost of Goods Sold/Average
|
|
|
|
|
|
|
turnover
|
Inventory
|
8.9
|
8.93
|
8
|
7.8
|
8.73
|
|
Days in
|
(Average Inventory/Cost of
|
|
|
|
|
|
|
inventory
|
Sales)*365
|
41 days
|
41 days
|
46 days
|
46 days
|
42days
|
|
Asset turnover
|
Net Sales/Total Assets
|
0.83
|
1.5
|
0.85
|
0.6
|
0.72
|
|
Receivables turnover
|
Credit Sales/Accounts Receivables
|
12.7
|
30.1
|
23.5
|
4.4
|
5.13
|
|
Average collection
|
(Accounts Receivable/Net
|
|
|
|
|
|
|
period
|
Sales)*365
|
28 days
|
12 days
|
16days
|
83 days
|
71days
|
|
Accounts ayable turnover
|
Purchases/Accounts Payable
|
1.98
|
1.8
|
1.32
|
0.83
|
1 29
|
|
Days AP
|
(Accounts Payable/Cost of
|
325
|
183
|
274
|
435
|
282
|
|
outstanding
|
Sales) *365
|
days
|
days
|
days
|
days
|
days
|
Source: Computed from secondary data Ratio
interpretation
The trend of inventory turnover shows how rapidly the
inventory into receivable through sales. In 2003 the ratio was 8.9 that is to
say 41 days the raw material remain outstanding, in 2004 the ratio was 8.93 so
the stock of raw material remain outstanding for 41 days, in 2006 the ratio was
8 it means that the stock of raw material remain outstanding for 42 days, in
2007 7.8 that is to say 42 days that the stock of raw material remain
outstanding.
RATIOS
Time in years
The trend of receivables (debtors) turnover measures the
quality of debtors since it indicates the speed of their collection. Its
interpenetration is combined together with the result of average collection
period. In AMAZI YA HUYE in 2003 this ratio was 12.3 that means 20 days that
the book debts remains outstanding, in 2004 the ratio was 30.1 which means 10
days that book debts remains outstanding, in 2005 the ratio was 23.5 which
means 13 days that the book debts remains outstanding, in 2006 the ratio was
4.4 that means 55 days that the book debts remains outstanding, in 2007 the
ratio was 5.13 that means 42 days that the book debts remains outstanding.
Looking on the trend of accounts receivable turnover ratios in
days from 2003 to 2004, we can see that accounts receivable are well managed at
AMAZI YA HUYE as there is an downward trend from 325 days in 2004 to 183 days
in 2005 the rend became upward a bit till 274 days but the situation changed in
2006 when the trend reached 435 days, this is so because the late payment on
behalf of debtors leads the firm to the lack of liquidity to pay its
liabilities on due time, in 2007 the trend indicated an downward trend from 435
days to 282 this situation became so as the company' s liquidity ratio reached
an interesting level
Figure 4 5 AMAZI YA HUYE receivables and payables
turnover ratios 2003-200 7
From the above table 4 5 and fig 4 4, keeping in mind that
creditors are source of funds and debtors (receivables) are use of funds,
although AMAZI YA HUYE's receivables for the period of the study have generally
been higher in figures than its creditors, the company benefited by collecting
receivables before paying its creditors since 2003 till 2007. It should be
noted that creditors are an interest -free form of financing called, this is a
spontaneous sources of financing.
The collection period in 2003-2005 was not so long and in
2006-2007 it become long a bit, comparing to the days that payables remain
outstanding, the company should take advantage of the extended credit period to
lengthen a bit the credit sales periods for undoubtiful customers to attract
for instance the potential consumers for their products
4 11 5 Multiple discriminant analysis
Table 4 6 Trend of multiple discriminant
analysis
|
RATIO
|
Formula
|
2003
|
2004
|
2005
|
2006
|
2007
|
|
Z
|
discriminant function score of a firm
|
|
|
|
|
|
|
X1
|
Net working capital/total assets (%)
|
-0.72%
|
-0.48%
|
-0.17%
|
15.50%
|
32.40%
|
|
X2
|
Retained earnings/total assets (%)
|
4.60%
|
3.20%
|
2.80%
|
3.70%
|
5.03%
|
|
X3
|
EBIT/total assets (%)
|
6.60%
|
4.45%
|
4.03%
|
5.34%
|
7.18%
|
|
Market value of total equity/book value
|
|
|
|
|
|
|
X4
|
of debt (%)
|
88.80%
|
119.70%
|
88.63%
|
132.80%
|
282.90%
|
|
X5
|
Sales/total assets (times)
|
0.83
|
1.05
|
0.79
|
0.60
|
0.73
|
|
0.01 2X1+0.0 14X2+0.033X3+0,006X4+
|
|
|
|
|
|
|
Z
|
0.999X5
|
1.64
|
1.96
|
1.49
|
1.81
|
3.12
|
Source: Computed from secondary data The MDA
interpretation
The MDA as an academic study on the use of accounting ratios
to forecast the financial failure, the management of each company can use it to
take preventive measures to the bankruptcy. Firms also can use this model in
making credit decisions and in monitoring receivables.
Basing on the standard, the higher of the Z score the better,
and this score below 2.675 the risk to the company to go bankrupt. In our case
study, in 2003, 2004, 2005, 2006 the company shows the sing of going bankrupt
as the Z score as computed in the above table 4 6 was respectively, 1.64, 1.96,
1.49, 1.81 but in 2007 this situation change toward a level to which the
financial sound of the company can't lead to the bankruptcy, as the Z score was
above the standard, it was 3.12.
Figure 4 6 AMAZI YA HUYE Multiple Discriminant
Analysis 2003-2007
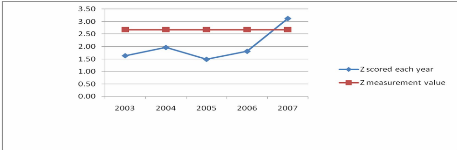
Z score
Time in years
Comments
Looking at the Z measurement curve, the situation of AMAZI YA
HUYE to go bankruptcy was too high in 2005, even in 2003, 2004 and 2006 also
the level of AMAZI YA HUYE towards bankruptcy was remarkable. But in 2007, the
situation changed as seen on the Z scored curve in 2007, so the management of
AMAZI YA HUYE should take measures to maintain such situation by computing the
MDA for each year the predict the financial failure.
4 12 Hypothesis testing
The study hypothesis stated that: The use of accounting ratios
guides management as an effective tool in decision making. From the findings
derived in this study, the researcher has enough evidence to confirm the
hypothesis. Based on the responses of the personnel of the company in table 4 1
of this chapter, about respondent's view on the linkage between accounting
ratios and decision making, it is clear that, there is majority who agree that,
ratio analysis is a
vital tool in decision making. Also the analysis made from
different kind of ratios computed using financial statements of AMAZI YA HUYE
proved that the management stands the better to take decision by using
accounting ratios rather than not.
Another hypothesis stated that: The result of using accounting
ratios relies on the effectiveness of accounting and how accountants are
skilled in financial analysis techniques. From the findings derived in this
study, the researcher has obtained the testimony from the accountant that the
use of accounting ratios can guide management, but there was hindrance
presented of using this technique which is a lack of capacity to use them. Also
this hypothesis is tested.
CHAPTER V
SUMMARY, CONLUSION AND RECOMMENDATIONS
5 1 Summary
Managers are responsible for the business health of their
firms. It is their responsibility to avoid financial mistakes. The financial
side of the business can be managed by the use of appropriate financial
management strategies just as the physical side of the business is managed.
Financial ratios, which measure the relationship between two
financial items or categories, are useful tools in this process. Ratios are
like symptoms in that they do not tell you what is wrong, but rather guide your
thinking and analysis into areas where problems may exist. They facilitate
comparisons among unwieldy numbers, among various parts of the business as well
as among different industry firms. When analyzed over time they can provide an
early warning system to detect emerging trends in the financial condition of
the business.
In the first chapter, the researcher tried to
indicate the background of this study, the problem statement where the
researcher tried to show how the no use of accounting ratio can mislead
management of each company while depending solely on financial statements in
decision making; at this level objectives of this study are stated as well as
its hypothesis.
In the second chapter, the review of what other
researcher have so far done in this area of accounting ratios and decision
making has been given. Different views on ratios and decision making have been
advanced and discussed to provide theories upon which hypothesis are tested,
In the third chapter, the methodology aspects adopted
by the researcher in carrying out this research is defined. Study variable were
determined, sampling techniques used were also discussed; data collection also
was defined for this research to collect both primary and secondary data.
Primary data were collected using interview as quantitative oriented research,
secondary data were collected using financial statements of 5 years period 2003
- 2007.
In chap ter four, the findings obtained by the
researcher were found basing on theories put forward by a number of researchers
in chapter two. The use of accounting ratios can guide decision making. It is
worth noting that, the use of accounting ratios can be effective if these
ratios are carefully used but the problem is lack of capacity to use them. This
has been confirmed by the accountant of the company of our case study.
For any business to prosper there is a need in decision
making. It is in this view, the accounting ratios can be considered as a
decision model, since they provide information from different aspects of the
business. The more the management use accounting ratios, the better the chance
it stands to guide dec ision making.
Finally, the findings enabled the researcher to test the
hypothesis. Basing on the findings the researcher confirms all hypotheses
stated.
5 2 Conclusion
Financial statement analysis involves analyzing the firm's
financial statements to extract information that can facilitate
decision-making. The use of accounting ratios as one of techniques used in
financial statements analysis can guide management in decision making by
playing a centre role in measuring the strength and weaknesses of the firm.
Ratio analysis for a business enterprise like AMAZI YA HUYE centres its efforts
to derive quantitative measures or guide concerning the expected capacity of
the firm to meet its future financial obligations or expectations.
Based on findings, AMAZI YA HUYE does not give much
significance in profitability ratios, the management staff of the company
believe that, net profit margin ratio, not only displays the profitability of
the company comparing to sales, but also the net profit ratio cans help in
expenses management. Thus, according to them there is no need of using any of
the profitability ratios.
right. It is observed that, others ratios like expenses
analysis ratio and gross margin ratio play a great role to determine the
profitability, as gross margin ratio decreases and the expenses analysis ratio
increases the net profit ratio decreases. There is a strong relationship of
these ratios to measure profitability of a company in order to control expenses
within the income earned to take measures for the future financial expenses and
revenues.
In addition to that, this study provides a method that can be
used to predict the financial failure as called Multiple Discriminant Analysis.
For our case study this model is not yet used but the researcher finds the
great role that can play this model to help all business entity to survive in
their economic environment.
Furthermore, it was found that, the accounting department has
a problem of using accounting ratio even the personnel of this department
accepts the effectiveness of using them, this is due to a lack of knowledge
required for the use of accounting ratio. Basing on the discussion with the
management staff, they accept the role that can play accounting ratios in
decision making but they present a problem of lack of capacity to use them.
From the researcher' s point of view, decision making in AMAZI
YA HUYE is effective, this is because of various reasons. First, the
use the accounting packages used by the company facilitates decision making,
whereby there is easy storage and access of data. Second, the use of
some of accounting ratios and other model like the flexible budget can provide
information from various aspects of business; all of these methods put the
management in a better position in decision making. Therefore the combination
of these qualities among others can ensure effective decision making.
However, the facts that AMAZI YA HUYE operates in the perfect
competition market, decision making of the company can have the more value to
survive in competitive market. In competitive market, for any firm to survive
the competition, there is a need of effective decision making to ensure the
efficiency. That is to say, the company should be vigilant on cost management
and profit maximisation.
Finally, the study objectives were attained and the questions to
be study were answered.
5 3 Recommendations
Based on the research findings, skills of the researcher and
other constraints accounted, we can finish this work by giving the following
recommendations that aimed at further improve dec ision making by the use of
accounting ratios for the great success of AMAZI YA HUYE:
1. Since the profit of AMAZI YA HUYE seems to be the same
based on the periods of this study, and this profit earned is obtained with
different sales turnover, for a better understanding of performance and
profitability in AMAZI YA HUYE, the company should calculate expenses analysis
ratio, gross margin ratio and net profit ratio for each period covered. It is
through this analysis that a company can be able to assess the expenses
incurred comparing to sales realized and gross margin obtained for a better
control of production cost and other expenses.
2. The company should improve its capacity to attract
potential investors by calculating its return to equity ratio and compare it to
the result of this ratio from the firms in same industry to test their ability
to increase the equity even from the external resources that the company can
benefit from potential investors.
3. The computation of multiple descriminat analysis should be
made at the end of each accounting period to assess the historical data in
order to predict the financial failure not for AMAZI YA HUYE as our case study,
but also for the other business entity to verify their going concern
situation.
4. The management of the company should look for the means of
disclosing company's financial statement to the professional accountants in
order to get advices and recommendations from these experts to get the fully
disclosed financial statement on which financial analysis could be conducted in
decision making
5. As in the country there is a lack of accounting
regulations, the ICPAR should prompt their settings and train the academician
accountants so that they can fill gaps of shortage of professional accountants
in Rwanda.
5 6 Area for further research
Research on the role of budgeting control in decision making
is encouraged because the budgeting control plays big role in quick decision
making. Further research should be conducted on the stakeholders' perspective
of accounting ratios.
Lastly, further research should also be done on the role of
qualified accountants in decision making and the firm's performance.
48
BIBLIOGRAPHY
1. Alman. E. I (1968), Financial Ratios, Discriminant
Analysis, And the Prediction of Corporate bankruptcy, Journal of
Finance.
2. Anthony, R. N. and Reece, J. S, (1975), Management
Accounting Principle, Taraporewals.
3. Arthur HINDMARCH and SIMPSON (1991), Financial
accounting, Macmillan Education Ltd, Hong Kong.
4. Audrey J. (1989), The Research Paper: process form
and contract, 6 Th edition, wads worth Publishing Company,
California.
5. Baguma J. (2004), The use of accounting ratios for
managerial control in BLALIRWA S.A, SESG, NUR.Butare.
6. Butters, K.J., et. Al., (1981), Case Problems in
Finance, Richerd D.Irwin.
7. Charles H.GIBSON (1989), Financial Statement
Analysis: using financial accounting information, 4th
edition, PWS-KENT publisher company, Boston.
8. I.M. Pandey (1995), Financial Management,
7th edition, Vikas Publishing House PVT ltd, New Delhi.
9. I.M. Pandey (2004), Financial Management,
8th edition, Vikas Publishing House PVT ltd, New Delhi.
10. James C. Van Horne and John M. Wachowicz (2005),
Fundamentals of Financial Management, 11th edition,
Prentice-Hall of India Private limited, New Delhi.
11. Kendal and Kendal J. E (1992), System Analysis and
Design, 2nd edition, Prentice hall, New Jersey.
12. Kenneth R. HOOVER (1988), Research in social
sciences,2nd edition, New York
13. Nachimias C and Nachimias C (1976), Research Methods
in Social Sciences, St Martins, Press, Inc, New York.
14. R.K. Sharma and Shashi K.Gupta (2000), Management
accounting, Kalyani publishers, New Delhi.
15. Richard M. Grinnell and Margaret Williams (1992),
Research in Social Work, 3 th edition, Prentice Hall, New
York.
16. Roger G. Schroeder (1989), Operations Management:
decision making in the operations function, McGraw-Hill Book
Company.
17. Rustagi R.P (2000), Financial Management: theory,
concepts, and problems, 2nd revised edition, Golgotia Publishing
Company.
18. William G. Coachran (1977), Sampling
Technique, 3th edition, John Wiley and sons. Incl, New
York.
19. P Vernmen (2006)@http ://
www.allbusiness.com/query=ratiosanalysis&searchbo
accessed
on 2009 March, 21st
20. Professor Harvey B. Lermack (2004)@http ://
www.ventureline.com/FinAnal.asp
accessed on 2009 March,2009
21. Prof. Phill Russeil, (2003)@
http://www.ibm.com/investor/financialguide/
accessed on the 2009 July, 12th
22. Robert Version (1998)@
http://www.google.com accessed on
2009 July, 7th
APPENDICES


