CHAPTER IV
DATA ANALYSIS AND INTERPRETATION
4 1 Introduction
This chapter presents the findings of the study entitled
«the use of accounting ratios in decision making» in AMAZI YA HUYE.
It also presents a brief description of AMAZI YA HUYE as the case study. It
also based on the analysis of both primary and secondary data collected to
achieve the stated objectives. The analysis of the data collected was done in
accordance with the study objectives and hypothesis. The results were reported
in tables and summarizing answers to major questions asked. The researcher used
focus group interview to obtain first hand information, whereby all six staff
of the company who deal with accounting and finance were involved in the
discussion. In short, this chapter examines the empirical evidence and
establishes grounds upon which the researcher hypothesis can be proved before
concluding the results of this research.
4 2 The Profile of AMAZI YA HUYE
AMAZI YA HUYE is a private company that was formed in 1998, with
the key aim of mineral water production and its base is in Huye District former
Butare town in the Southern Province.
Their first mineral water product appeared at the market
beginning with the year 2000, after the scientific laboratory experiment by the
University of Shanghai in china. Experts from this University confirmed the
purity of the mineral water manufactured by AMAZI YA HUYE enterprise
AMAZI YA HUYE Company do not only produce mineral water but also
produces the plastic bottles into which their mineral water products are
packed.
4 1 2 AMAZI YA HUYE location
Its head office is in Kigali city at Muhima near Kabuga's
building because of availability of large market. This company still sells its
products locally but it imports its raw materials abroad specifically from
China.
4 3 AMAZI YA HUYE's mission
It seeks to increase the productive capacity of the mineral
water and play a key role in transforming the economy and enhancing the well
being of people. Through their dynamic and responsive teams, it aims at
providing the products and maintains the highest levels of customer service and
professional integrity.
4 4 AMAZI YA HUYE's objectives
> To support the development of the industrial sector
generally through innovative and the transfer international best practice.
> To support the drive of the private sector investment for
the development of the economy working with locals as well as international
investment and development focused agencies.
> To meet needs and expectations of its customers by providing
the products at the right quality and at the right time.
4 5 The environment of AMAZI YA HUYE
The AMAZI YA HUYE Company is not a monopoly one but operates with
a perfect competition market structure.
In order to adapt itself to the business investment, this
enterprise makes sure that it has a good relationship with the commercial banks
and even other industries operating in Rwandan territory and other
countries.
4 6 Juridical statute of AMAZI YA HUYE
AMAZI YA HUYE enterprise is an individual Industrial company
of Mr. GAKWAYA Etienne whose capital was 83,404,822 RWF at the beginning in
1998 but currently the capital is 149,000,000 RWF
Figure 4 1 Organization structure of AMAZI YA
HUYE
Executive Director

Director of commerce

|
IT Manager
|
|
|
|
Chief Accountant
|
|
Importation Officer
|
|
Engineer
|
|
Human
Resou rce
manager
|
|
|
|
|
|
|
|
|
|
|
|
|
|
|
|
|
|

|
Accountant A
|
|
Acco unta nt
|
|
|
|
Secretary
|
|
Cashier
|
|
|
Acco unta nt
|
|
|
|
|
|
|
|
|
|
|

|
Manpower
|
|
Drivers
|
|
Officer messengers
|
|
|
|
|
Source: Marketing Department of AMAZI YA HUYE.
4 7 Tasks description
By making description of the above organization structure,
different tasks attributed to general management and different departmental
services are precised in accordance to the organizational arrangement of the
chart.
A. Executive Director
The executive director of AMAZI YA HUYE is responsible for
taking all the dec isions relating to effective management and policy
formulation of the enterprise. He is also in charge of the following
activities:
- To insure the coordination and management of different
department like commercial service, production service and financial
service.
B. Director of commerce
This one is responsible for the evolution of commercial and
marketing services and making survey on the areas of competition. He takes
measures on the quality and quantity of mineral water to be taken to the
market, he makes follow-up on the buying and the selling conditions, for the
interest of the clients.
Sometimes he proceeds to the ground to investigate the consumers
perception upon certain decisions under took and these assist him to underlay
appropriate strategies.
C. Human resource manager
The human resource manager is in charge of recruitment of the
employees and makes sure that the recruited employees are ones with competent
skills which can lead to the general improvement of the company' s
performances.
He assigns duties and responsibilities to the employees and
makes supervisions to different department to approve if the delegation of
power is respected by departments.
He posses power to appoint and dismiss misbehaved workers after
his consent with the executive director.
D. Accounting department
The responsibilities of this department are as follows:
- Keeping records of the day to day business transactions
- Preparation of the financial statements of the company
- Keeping the books of accounts like the journals, ledgers and
trial balance.
- Recording the daily operations of expenses and revenues of the
company of AMAZI YA HUYE
- Analyzing financial transactions and gives information to the
management and the third parties.
- Advising the top management on the financial position and
decision making.
E. Importation officer The importation officer
has the following key duties:
- He makes sure that all the logistical and procurement services
are done smoothly with in the enterprise.
- Importation of required technical instruments to run
enterprise's daily production affairs. - Monitoring on the quality of
production basing on capacity of machines.
F. Engineer The responsibilities of an engineer
include:
- Rendering mechanical services at any time when technical
errors happen. - Repairing of machines that have experienced technical
problems.
- Control and measures the electricity used by the company.
G. IT Manager: This one has got the following
tasks
- System soft ware in the company
- Distribution of information system in all the departments -
Repair of computers that are experiencing errors.
4 8 Data analysis
has been a result of a number of factors, but the main factor
is a lack of rational decision making. As finalist student in Accounting
Sciences in this research, we picked interest in one of techniques that is
commonly used in decision making since it naturally provides much information
in almost every aspect of the business. The researcher was motivated to find
out the effectiveness of using accounting ratios in decision making of the
enterprise. The student was also interested in knowing whether this techniques
is used or not, and what could be the requirement to use them effectively.
4 8 1 In depth Interview
To the opinion of the accountant and management department
executives on important issues related to accounting ratios group interview (in
depth interview) was conducted. All six staff of management department in AMAZI
YA HUYE was interviewed including the accountants of this enterprise
The discussion took place at AMAZI YA HUYE headquarter as well
as at the factory residence whereby all the participants were requested to
think on all matters concerning accounting ratios in AMAZI YA HUYE. After each
interview, notes are taken to unable analysis to be made. For some question
clarifications are given to the interviewee so that they can give their views
and opinions.
The discussion was designated to accomplish the following
objectives:
1. To identify the importance of using accounting ratios in
decision making
2. To know whether accounting ratios are used in AMAZI YA
HUYE
3. To determine the linkage between accounting ratios and
decision made in AMAZI YA HUYE
4. To determine other factors used in decision making
5. To identify the constraints that hinder the proper use of
accounting ratios
4 8 2 Type of ratios used
For this purpose 32 ratios were selected based upon a review
of text books. These ratios were divided into 5 categories of analysis, such as
ratios to use in analyzing liquidity, efficiency, sales profitability, debt,
and in multiple dicsriminant analysis. The management staff of AMAZI YA HUYE
disclosed that ratios are frequently used by the company in analyzing
profitability and liquidity. They said that ratios used in this manner are more
significant to take any decision.
After knowing that accounting ratios are used in AMAZI YA HUYE
as a tool of analysis in decision making and after knowing that the staff
management of AMAZI YA HUYE are interested in their use in decision making the
researcher wanted to investigate how this technique is used.
4 8 3 Preferred ratios in decision making
To determine the preferred ratios the researcher asked the
following question» What among the following kind of accounting ratios do
you take into account while making decisions and for which purpose?»
· Liquidity ratios
· Debt ratios
· Efficiency ratios
· Sales and profitability ratios
One of the respondent said that while analyzing liquidity
position liquidity ratios are used, in analyzing efficiency of the company
inven tory turnover ratio is used and some ratios are used especially in
analyzing sales and profitability.
4 8 3 1 Preferred ratios in analyzing liquidity
Basing on the review of text books, the researcher chose the
following ratios in analyzing liquidity:
· Current ratio
· Quick ratio (acid test ratio)
· Cash ratio
As said in the above response these ratio are used in analyzing
liquidity position of the company. One of the managing explained that the use
of this kind of ratios presents an importance to the company because it helps
to know the level at which the company can pay its short term debts.
4 8 3 2 Preferred ratios in analyzing efficiency
Concerning efficiency ratios, the researcher chose some of them
basing on the review of text books. Following are some of these ratios:
· Inventory Turnover
· Days in Inventory
· Assets turnover
· Receivables Turnover
· Average Collection period
· Accounts Payable turnover
· Days AP outstanding
The management staff showed much interest in efficiency
ratios, one of them said,» efficiency measuring is very important for
any business», He went on commenting that, the efficiency ratios can
help to adjust the inventory to sales collection using inventory turnover, days
in inventory. Most of them had the same views but the put emphasize on
profitability ratios by saying, «When a company is profitable it means
that it is efficiently performing its operations».
4.9.3.3 Preferred ratios in analyzing debt
Basing on the review of text books, the researcher chose the
following set of ratios to analyse debts of our case study.
· Total Debt ratio
· Debt-Equity Ratio
· Long-term Debt to capital
· Asset-Equity Ratio or Leverage Ratio
One of the management staff said that debt ratio help to measure
the extent to which a company rely on outsiders funds.
4 10 Accounting ratios and decision making
To determine whether there exists a linkage between accounting
ratios and organization sustainable growth, the researcher asked the following
question to the respondents «Do you agree that, the use of accounting
ratios can lead to the decision making?» The following table shows
categories of their responses:
Table 4 1 Respondents' view on the linkage
between accounting ratios and decision making
Personnel
Responses
Agree 3
Disagree 1
Neutral 2
Source: Primary data
There seems to be a majority who agree that there is a linkage
between accounting ratios and decision making. The chef accountant commented
that decision model like financial ratios plays a great role in assessing the
financial performance of the company but he presented the problem of a lack of
capacity to use them. One of the accounting department said, though
financial ratio analysis is not the only measure of performance, still it is
the best to measure the financial health of the company to take any
decision.
added that this tool is as important as accounting
ratio. The researcher asked which purpose the have while using this
method; he replied that the use a flexible budget since it gives room for any
change in the future.
Another participant added that in AMAZI YA HUYE they put more
emphasize on the importance of preparing budget for each cots center. The
researcher wanted to know different kinds of budget prepared there, one of the
respondent said, here we prepare various budget like purchase budget, sales
budget, production budget, selling and distribution budget.The remaining
participant didn't to have any comment because she said that her task have no
linkage with decisions taken in the company because she is a book keeper.
The researcher if there are any techniques used to make
decisions that avoid bankruptcy as it had occurred to SORWAL SARL, among this
type of analysis the researcher presented them a set of significant ratios used
in the multiple discriminant analysis. The manager officer said, this could
be the effective tool to take decision for avoiding bankruptcy but he added
that is not yet used in their company. He concluded by saying that,
what is important is to use the accounting ratios as a decision model
effectively, but he insisted saying that the problem related with such
use is a lack of skilled people in this area.
4 11 Analysis of accounting ratio as a decision
model
The secondary data also are used as source of information of a
part of the analytical research, for this reason, financial statements of five
consecutive years of AMAZI YA HUYE are used, that is from 2003 to 2007. The
following analysis was done basing on the secondary data
4 11 1 Liquidity analysis
The table below presents the trend of liquidity position of the
company as far as current, quick and cash ratios are concerned, from
2003-2007.
Table 4 2 Trend of liquidity ratios
|
Formula
|
2003
|
2004
|
2005
|
2006
|
2007
|
|
RATIOS
|
|
|
|
|
|
|
|
Current ratio
|
Current asset/current liabilities
|
0.98
|
1.01
|
0.99
|
1.36
|
2.27
|
|
Current asset-Inventory/current
|
|
|
|
|
|
|
Acid test ratio
|
liabilities
|
0.59
|
0.34
|
0.37
|
0.73
|
1.51
|
|
Cash+ Marketable
|
|
|
|
|
|
|
Cash ratio
|
securities/Current liabilities
|
0.47
|
0.28
|
0.32
|
0.52
|
1.17
|
Source: Computed from secondary data Ratio
interpretations
We compare the results of the current ratio basing on the
standard ratio 2: 1. As far as the current ratio is concerned, it was 0.98:1 in
2003 that is not satisfactory even for three successive years of 2004, 2005 and
2006 the ratio computation is 1.01, 0.99.1.36 respectively, for this case the
liquidity position went down below the standard but in 2007, the ratio was
satisfactory as it was above the standard 2:1, as it was 2.27:1.
Compared to the standard of 1:1 the quick ratio of the company
shows unsatisfactory situation from 2003 till 2006, as in 2003 it was 0.59:1,
in 2004 it was 0.34, in 2005 it was 0.37:1 and in 2006 it was 0.73 :1. Since
2007 the ratio became satisfactory as its result was 1.51:1.
As far as the cash ratio is concerned, it is 0.47:1 in 2003,
0.28: 1 in 2004, 0.37:1 in 2005, 0.52:1 in 2006 and 1.17:1 in 2007. Basing on
the standard of 0.5: 1, the result of this ratio shows unsatisfactory case in
2003, 2004 and 2005. But in 2006 and 2007 there is a satisfactory situation of
liquidity as the ratio computation is 0.52:1 in 2006, 1.17:1 in 2007, what we
can also include to the result of 2007 is that there is a portion of idle
resources of 0.17.
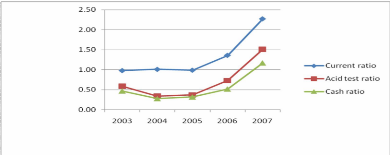
Figure 4 2 AMAZI YA HUYE Liquidity ratios 2003 -
2007
RATIOS
Time years
Comments
As the table 4 3 and fig 4 1 show, the company' liquidity
ratios exbhit a diclining pattern from 2003 to 2005 basing on the rule of
thumb.As shown by the above figure, the cuurent ratio, quick ratio, and the
cash ratio dropped from the recommendable ratio in 2003,2004 and 2005 as per
the role of thumb, 2:1 to current ratio, 1:1 to quick ratio, 0.5:1 to cash
ratio, that prove the less liquidity to meet the short term obligations, basing
on the above analysis, in 2003, and 2005 the company has no working capital
even in 2004 it was not interesting. The situation got change in 2006 and get
improvement in 2007 when the results shows the figures above the recommendable
ratio.
4 11 2 Debt analysis
The following table indicates the trend of Debt ratios in AMAZI
YA HUYE for the period of our research that is 2003 - 2007.
Table 4 3 Trend of debt ratios
|
Formula
|
2003
|
2004
|
2005
|
2006
|
2007
|
|
RATIOS
|
|
|
|
|
|
|
|
Leverage ratios
|
Assets/Shareholder's equity
|
2.12
|
1.83
|
2.22
|
1.75
|
1.35
|
|
Total debt ratio
|
Total debt/total asset
|
0.52
|
0.45
|
0.53
|
0.42
|
0.26
|
|
Debt to equity ratio
|
Total debt/equity
|
1.12
|
0.84
|
1.13
|
0.75
|
0.35
|
|
Long term debt to capital
|
Debt/Debt Equity
|
0.52
|
0.45
|
0.53
|
0.42
|
0.26
|
|
Interest coverage ratio
|
EBIT/Annual interest expenses
|
0.53
|
0.46
|
0.53
|
0.43
|
0.26
|
Source: Computed from secondary data Ratio
interpretation
The total debt ratio indicates the extent to which the firm is
using debt to finance its assets. The better when the ratio is 0.5:1 or less.
In 2003 the ratio was 0.53:1, in 2004 it declined to 0.45:1, in 2005 it got
increase to 0.53:1, in 2006 it deceased when it was 0.42 and in 2007 it was
0.26:1.
The result of debt to equity ratio indicates the relationship
between lenders' contribution for each franc of the owners' contribution. It in
this case, the lenders have contributed more in 2006 for 1 franc given by the
owners the lenders give 1.12, and in 2005 for 1 franc from owners the lenders
provide 1.13. For the other periods the situation was good as in 2004 for one
franc from the owners, lenders provide 0.84, in 2006 for 1 franc from the
owner, lenders provide 0.75, and in 2007 for 1 franc from the owners, lenders
provide 0.35.
The total leverage ratio relates total as sets to shareholders
`equity. This ratio is a degree to which
management has financed the
company's asset investment with no ownership capital. The result
of the
leverage ratio computation for AMAZI YA HUYE reveals the following situation:
in 2003
the ratio was 2.21 which means, to 1 franc from owners 1.12
has been used to find the company's assets from outsiders, in 2004 the ratio
was 1.83, to 1 franc from owners, outsiders provide 0.83 to fund the company's
assets, in 2005 the ratio was 2.22, to 1 franc from owners, outsiders provide
1.22 to fund the company's assets, in 2006 the ratio was 0.75, to 1 franc from
owners the outsiders provide 0.75, in 2007 the ratio was 0.32, to 1 franc from
owners the outsiders provide 0.32.
Figure 4 3 AMAZI YA HUYE debt ratios 2003 -
2007

RATIOS
Time in years
Comments
The debt ratios generate the company's ability to meet its
obligations, otherwise it measures the dependability of the company to the
outsiders. Basing on the ratio computation in table 4 3 and its representation
in figure 4.3, in 2003 there was an increase in dependability of the company to
the outsiders funds, it declined in 2004, but in 2005 it increased which means
that in this period the claims of creditors were greater than those of owners.
Starting to 2006 till 2007 these ratios were trending downward, for this
reason, the dependability to the outsiders declined which shows a good sign of
solvency of the company.
4 11 3 Sales and profitability analysis
The table below shows the sales and profitability of AMAZI YA
HUYE for the period covering five successive years, that is to say 2003 -
2007.
Table 4 4 Trend of sales and profitability
ratios
|
RATIOS
|
Formula
|
2003
|
2004
|
2005
|
2006
|
2007
|
|
Sales growth
|
(current year sales-last year
|
|
|
|
|
|
|
rate
|
sales)/last year sales)*100
|
0.00%
|
15.00%
|
-7.2%
|
-32.04%
|
-1.21%
|
|
Expenses analysis
|
Various expenses/Sales
|
0.52
|
0.74
|
0.75
|
0.70
|
0.51
|
|
Gross margin to sales
|
Gross profit/ Total sales
|
0.42
|
0.23
|
0.21
|
0.24
|
0.42
|
|
Operating profit to sales
|
Operating profit / Sales
|
0.08
|
0.04
|
0.05
|
0.09
|
0.10
|
|
EBIT to Sales
|
EBIT/ Net sales
|
0.08
|
0.04
|
0.05
|
0.09
|
0.10
|
|
Return on sales
|
Net income / Net sales
|
0.06
|
0.03
|
0.04
|
0.06
|
0.07
|
|
Return on investment
|
Net income / Fixed assets
|
1.75
|
1.94
|
1.67
|
1.47
|
1.84
|
|
Return on assets
|
Net income / Total assets
|
0.83
|
1.05
|
0.79
|
0.60
|
0.77
|
|
Return on equity
|
EAT /Shareholder's equity
|
0.09
|
0.58
|
0.06
|
0.07
|
0.07
|
|
Payout ratio
|
Cash dividend /Net income
|
0.00
|
0.00
|
0.00
|
0.00
|
0.00
|
|
Retention ratio
|
Retained earring/ Net income
|
0.01
|
0.01
|
0.01
|
0.01
|
0.01
|
|
Sustainable
growth rate
|
REO*Retention ratio
|
0.0500
|
0.0175
|
0.0021
|
0.0040
|
0.0045
|
Source: Computed from secondary data
Ratio interpretation
The sales growth rate was 0.0 in 2003 as there is no data
given for the previous. Basing on 2003 in 2004 there was growth of 15%, in 2005
comparing to 2004 there was growth of 7.20%, in 2006 basing on 2005 sales there
was growth of -32.04%, and in 2007 there is growth of -1.12% of sales. The
results obtained shows that in 2006 the sales declined with a great percentage
which
follows buy a bit decline in 2007 all of these situations involve
the reinforcements of the marketing activities of the company to ensure a
sustainable growth.
The gross margin to sales ratio is an indication of the
management's ability to mark up its products over their cost. In 2003 the ratio
was 0.42 that means to 1 unit sold the cost of product sold was 0.58, 2004 it
was 0.23 that means to 1 unit sold 0.77 was the cost of product sold, in 2005
it was 0.21 that means to 1 unit sold 0.79 was cost of goods sold, in 2006 the
ratio was 0.24 that means to 1 unit sold 0.76 was the cost of product sold, in
2007 the ratio was 0.42 that means to 1 unit sold the cost of product was
0.58.
The expense analysis ratio shows the rate of expenses incurred
after each sale. It helps to control the expenses comparing to the rate of
margin to sales. The result of this ratio was 0.52 in 2003, in 2004 it was
0.74, in 2005 it was 0.75, in 2006 it was 0.70 and in 2007 it was 0.51.
The return on sales indicates the relationship between sales
and the earning of the period. It helps in controlling expenses with the rate
of margin. In 2003 the ratio was 0.06, in 2004 it was 0.03, in 2004 the ratio
was 0.04, in 2005 it was 0.06, and in 2007 it indicates 0.07.
The return on assets ratio shows the relationship between
total assets and sales realized. The trend of this ratio in AMAZI YAHUYE
indicates that in 2003 for 1 franc invested in fixed and current assets the
return is 0.83 on sales, in 2004 for 1 franc invested in fixed and current
assets the return is 1.05 on sales, in 2005 for 1 franc invested in fixed and
current assets the return is 0.79on sales, in 2006 for 1 franc invested in
fixed and current assets the return is 0.60 on sales, in 2007 for 1 franc
invested in fixed and current assets the return is 0.77 on sales.
The trend of return on investment helps to analyze the income
earned and capital employed. In 2003 to generate 1 franc in sales the company
invested 1.75 in fixed assets , in 2004 to earn 1 franc in sales the company
invested 1.94 in fixed assets, in 2005 to generate 1 franc in sales the company
invested 1.67 , in 2006 to earn 1 franc in sales the company 1.47 , in 2007 to
generate 1 franc in sales the company invested 1.84.
The return on equity indicates how well the company has used
the owners's resources. In our
case study, the result of this ratio was 0.09
in 2003, 0.058 in 2004, 0.06 in 2005, and 0.07 in
2006 and in 2007. The
percentage of this ratio reveals the relative performance and strength of
the company in attracting future investments; it means that in
2003 the capacity of AMAZI YA HUYE was too high comparing to the following
years when it declined slightly till the level of 7% in 2007.
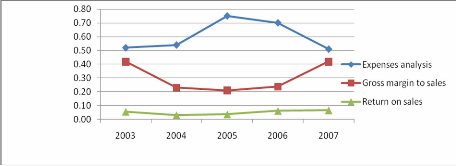
Figure 4 4 AMAZI YA HUYE expenses analysis, gross
margin to sales, return on sales ratios
2003-200 7
RATIOS
Time in years
Comments
Basing on the results from the table 4 4, from 2003 to 2006,
there was a decrease of gross margin ratio, but on the other side there was an
increase in expenses as shown in expenses analysis ratio. This situation leads
to the reduction of net profit regarding these periods that means there is no
expenses management basing on sales and cost of goods sold. This set of ratio
can help to take measures for the future sales and their expenses. In 2007, we
consider a slight decrease of gross profit margin, as well as a slight increase
in expenses analysis ratio which provide a bit higher return on sales ratios
comparing to the previous periods.
The above comments are depicted in the figure 4 4 that
represents together gross profit margin ratio, expenses analysis ratio, and
return on sales ratio of AMAZI YA HUYE from 2003 to 2007. In 2003-2005 the
expenses curve was upward sloping comparing to the gross profit curve that was
down ward sloping in 2006-2007 the expense curve changed, it was down ward
sloping, comparing to the gross profit curve that was up ward sloping. These
situations make an impact on the net profit of the company that could be
greater in 2003-2005, but the expenses became uncontrollable comparing to the
margin of cost of raw material to sales realized in that time, in the following
two years, the expenses management was controlled basing on cost of raw
material
to sales, the reason the sales turnover was lower than the
previous years but the net profit was somehow closer to those of these periods
even the sales turnover of these periods was higher (2003, 2004 and 2005).
4 11 4 Efficiency analysis
The table below shows the trend of the efficiency ratios of AMAZI
YA HUYE from 2003 - 2004.
Table 4 5 Trend of efficiency ratios
|
RATIOS
|
Formula
|
2003
|
2004
|
2005
|
2006
|
2007
|
|
Inventory
|
Cost of Goods Sold/Average
|
|
|
|
|
|
|
turnover
|
Inventory
|
8.9
|
8.93
|
8
|
7.8
|
8.73
|
|
Days in
|
(Average Inventory/Cost of
|
|
|
|
|
|
|
inventory
|
Sales)*365
|
41 days
|
41 days
|
46 days
|
46 days
|
42days
|
|
Asset turnover
|
Net Sales/Total Assets
|
0.83
|
1.5
|
0.85
|
0.6
|
0.72
|
|
Receivables turnover
|
Credit Sales/Accounts Receivables
|
12.7
|
30.1
|
23.5
|
4.4
|
5.13
|
|
Average collection
|
(Accounts Receivable/Net
|
|
|
|
|
|
|
period
|
Sales)*365
|
28 days
|
12 days
|
16days
|
83 days
|
71days
|
|
Accounts ayable turnover
|
Purchases/Accounts Payable
|
1.98
|
1.8
|
1.32
|
0.83
|
1 29
|
|
Days AP
|
(Accounts Payable/Cost of
|
325
|
183
|
274
|
435
|
282
|
|
outstanding
|
Sales) *365
|
days
|
days
|
days
|
days
|
days
|
Source: Computed from secondary data Ratio
interpretation
The trend of inventory turnover shows how rapidly the
inventory into receivable through sales. In 2003 the ratio was 8.9 that is to
say 41 days the raw material remain outstanding, in 2004 the ratio was 8.93 so
the stock of raw material remain outstanding for 41 days, in 2006 the ratio was
8 it means that the stock of raw material remain outstanding for 42 days, in
2007 7.8 that is to say 42 days that the stock of raw material remain
outstanding.
RATIOS
Time in years
The trend of receivables (debtors) turnover measures the
quality of debtors since it indicates the speed of their collection. Its
interpenetration is combined together with the result of average collection
period. In AMAZI YA HUYE in 2003 this ratio was 12.3 that means 20 days that
the book debts remains outstanding, in 2004 the ratio was 30.1 which means 10
days that book debts remains outstanding, in 2005 the ratio was 23.5 which
means 13 days that the book debts remains outstanding, in 2006 the ratio was
4.4 that means 55 days that the book debts remains outstanding, in 2007 the
ratio was 5.13 that means 42 days that the book debts remains outstanding.
Looking on the trend of accounts receivable turnover ratios in
days from 2003 to 2004, we can see that accounts receivable are well managed at
AMAZI YA HUYE as there is an downward trend from 325 days in 2004 to 183 days
in 2005 the rend became upward a bit till 274 days but the situation changed in
2006 when the trend reached 435 days, this is so because the late payment on
behalf of debtors leads the firm to the lack of liquidity to pay its
liabilities on due time, in 2007 the trend indicated an downward trend from 435
days to 282 this situation became so as the company' s liquidity ratio reached
an interesting level
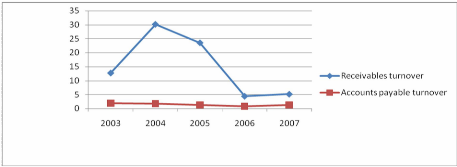
Figure 4 5 AMAZI YA HUYE receivables and payables
turnover ratios 2003-200 7
From the above table 4 5 and fig 4 4, keeping in mind that
creditors are source of funds and debtors (receivables) are use of funds,
although AMAZI YA HUYE's receivables for the period of the study have generally
been higher in figures than its creditors, the company benefited by collecting
receivables before paying its creditors since 2003 till 2007. It should be
noted that creditors are an interest -free form of financing called, this is a
spontaneous sources of financing.
The collection period in 2003-2005 was not so long and in
2006-2007 it become long a bit, comparing to the days that payables remain
outstanding, the company should take advantage of the extended credit period to
lengthen a bit the credit sales periods for undoubtiful customers to attract
for instance the potential consumers for their products
4 11 5 Multiple discriminant analysis
Table 4 6 Trend of multiple discriminant
analysis
|
RATIO
|
Formula
|
2003
|
2004
|
2005
|
2006
|
2007
|
|
Z
|
discriminant function score of a firm
|
|
|
|
|
|
|
X1
|
Net working capital/total assets (%)
|
-0.72%
|
-0.48%
|
-0.17%
|
15.50%
|
32.40%
|
|
X2
|
Retained earnings/total assets (%)
|
4.60%
|
3.20%
|
2.80%
|
3.70%
|
5.03%
|
|
X3
|
EBIT/total assets (%)
|
6.60%
|
4.45%
|
4.03%
|
5.34%
|
7.18%
|
|
Market value of total equity/book value
|
|
|
|
|
|
|
X4
|
of debt (%)
|
88.80%
|
119.70%
|
88.63%
|
132.80%
|
282.90%
|
|
X5
|
Sales/total assets (times)
|
0.83
|
1.05
|
0.79
|
0.60
|
0.73
|
|
0.01 2X1+0.0 14X2+0.033X3+0,006X4+
|
|
|
|
|
|
|
Z
|
0.999X5
|
1.64
|
1.96
|
1.49
|
1.81
|
3.12
|
Source: Computed from secondary data The MDA
interpretation
The MDA as an academic study on the use of accounting ratios
to forecast the financial failure, the management of each company can use it to
take preventive measures to the bankruptcy. Firms also can use this model in
making credit decisions and in monitoring receivables.
Basing on the standard, the higher of the Z score the better,
and this score below 2.675 the risk to the company to go bankrupt. In our case
study, in 2003, 2004, 2005, 2006 the company shows the sing of going bankrupt
as the Z score as computed in the above table 4 6 was respectively, 1.64, 1.96,
1.49, 1.81 but in 2007 this situation change toward a level to which the
financial sound of the company can't lead to the bankruptcy, as the Z score was
above the standard, it was 3.12.
Figure 4 6 AMAZI YA HUYE Multiple Discriminant
Analysis 2003-2007
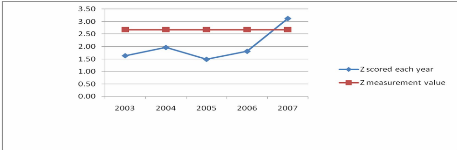
Z score
Time in years
Comments
Looking at the Z measurement curve, the situation of AMAZI YA
HUYE to go bankruptcy was too high in 2005, even in 2003, 2004 and 2006 also
the level of AMAZI YA HUYE towards bankruptcy was remarkable. But in 2007, the
situation changed as seen on the Z scored curve in 2007, so the management of
AMAZI YA HUYE should take measures to maintain such situation by computing the
MDA for each year the predict the financial failure.
4 12 Hypothesis testing
The study hypothesis stated that: The use of accounting ratios
guides management as an effective tool in decision making. From the findings
derived in this study, the researcher has enough evidence to confirm the
hypothesis. Based on the responses of the personnel of the company in table 4 1
of this chapter, about respondent's view on the linkage between accounting
ratios and decision making, it is clear that, there is majority who agree that,
ratio analysis is a
vital tool in decision making. Also the analysis made from
different kind of ratios computed using financial statements of AMAZI YA HUYE
proved that the management stands the better to take decision by using
accounting ratios rather than not.
Another hypothesis stated that: The result of using accounting
ratios relies on the effectiveness of accounting and how accountants are
skilled in financial analysis techniques. From the findings derived in this
study, the researcher has obtained the testimony from the accountant that the
use of accounting ratios can guide management, but there was hindrance
presented of using this technique which is a lack of capacity to use them. Also
this hypothesis is tested.
| 

