ANNEXE
ANNEXE I
Graphique A-1 : Evolution de la production
pétrolière ivoirienne
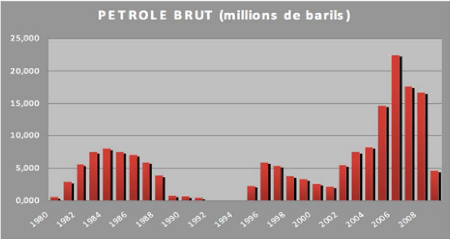
Source: Ministère des mines, du pétrole et de
l'énergie.
ANNEXE II
Tableau A-1 : Imposition des carburants (2009),
USD/litre
|
Pays
|
Supercarburant
|
Gasoil
|
Pétrole lampant
|
|
Benin
|
0.41
|
0.29
|
0.19
|
|
Burkina Faso
|
0.71
|
0.63
|
0.01
|
|
Cote d'Ivoire
|
0.84
|
0.72
|
0.23
|
|
Mali
|
0.73
|
0.43
|
0.14
|
|
Niger
|
0.49
|
0.37
|
0.02
|
|
Senegal
|
0.44
|
0.40
|
|
|
Togo
|
0.39
|
0.38
|
0.11
|
|
|
Ghana
|
0.25
|
0.16
|
0.15
|
|
Nigeria
|
0.20
|
0.49
|
0.21
|
Source : calculs du FMI a partir des données
nationales
ANNEXE III
Schema: 3 aRFOdua1- d'1-stimEtiRn du mRd~l1- 9 $ 5 99 (
C

Modèle Vectoriel à Correction d'Erreur

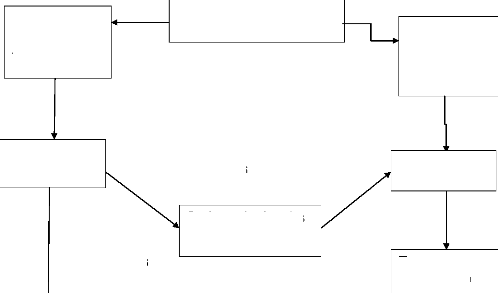
Test de cointégration
Si les variables ne sont pas stationnaires en niveau
Si les variables sont cointégrées
Si les variables ne sont pas cointégrées
Stationnarisation des variables
Test de stationnarito
Estimation VAR
Tests diagnostique
Si toutes les variables sont stationnaires en niveau

Test de causalito
Analyse impulsionnelle

Décomposition de la variance
Source : Auteur
ANNEXE IV
Tableau A-2 : Test de racine unitaire ADF sur les
variables du modèle
|
Modèle(3) avec constante
et tendance (etape1)
|
Modèle(2) avec
constante (etape2)
|
Modèle(1) sans constante
ni tendance (etape3)
|
|
Prix de pétrole (PP)
|
|
Std error
|
0,090908
|
1,267326
|
|
|
T-statistic
|
0,422839
|
-0,826827
|
3,882932
|
|
Probabilité
|
0,6744
|
0,4126
|
0,9999
|
|
Décision
|
La tendance n'est
pas
significative
(prob=0,6744>0,05)
|
La constante n'est
pas
significative
(prob=0,4126>0.05)
|
On accepte H0 de
racine
unitaire
(prob=0.9999>0.05)
|
|
Taux d'inflation (INFL)
|
|
Std error
|
0,063190
|
1,261682
|
|
|
T-statistic
|
-0,707783
|
2,518921
|
-1,908442
|
|
Probabilité
|
0,4830
|
0,1156
|
0,0545
|
|
Décision
|
La tendance n'est
pas
significative
(prob=0,4830>0,05)
|
La constante n'est
pas
significative
(prob=0,1156>0.05)
|
On accepte H0 de
racine
unitaire
(prob=0.0545>0.05)
|
|
Taux de croissance (TXCROISS)
|
|
Std error
|
0,077499
|
0,9443173
|
|
|
T-statistic
|
-1,982496
|
1,127071
|
-1,537939
|
|
Probabilité
|
0,0551
|
0,2670
|
0,1151
|
|
Décision
|
La tendance n'est
pas
significative
(prob=0,0551>0,05)
|
La constante n'est
pas
significative
(prob=0,2670>0.05)
|
On accepte H0 de
racine
unitaire
(prob=0.1151>0.05)
|
|
Exportations (EXPORT)
|
|
Std error
|
12333087
|
1,02E+08
|
|
|
T-statistic
|
0,228138
|
-0,062743
|
4,630168
|
|
Probabilité
|
0,8206
|
0,9502
|
1,0000
|
|
La tendance n'est pas
|
La constante n'est pas
|
On accepte H0 de racine
|
|
Décision
|
significative
|
significative
|
unitaire
|
|
(prob=0,8206>0,05)
|
(prob=0,9502>0.05)
|
(prob=1,0000>0.05)
|
Source, résultat Eviews
Tableau A-3 : Test de racine unitaire ADF en
différence première Test 1 : prix de pétrole
Null Hypothesis: D(PP) has a unit root Exogènes: Constant,
Linear Trend Lag Length: 0 (Fixed)
t-Statistic Prob.*
Augmented Dickey-Fuller test statistic -4.084597 0.0124
Test critical values: 1% level -4.165756
5% level -3.508508
10% level -3.184230
*MacKinnon (1996) one-sided p-values.
Test 2 : taux d'inflation
Null Hypothesis: D(INFL) has a unit root Exogènes:
Constant, Linear Trend
Lag Length: 1 (Fixed)
t-Statistic Prob.*
Augmented Dickey-Fuller test statistic -7.162084 0.0000
Test critical values: 1% level -4.175640
5% level -3.513075
10% level -3.186854
Test 3 : Taux de croissance
Null Hypothesis: D(TXCROISS) has a unit root Exogènes:
Constant, Linear Trend
Lag Length: 4 (Fixed)
t-Statistic Prob.*
Augmented Dickey-Fuller test statistic -3.990599 0.0166
Test critical values: 1% level -4.192337
5% level -3.520787
10% level -3.191277
*MacKinnon (1996) one-sided p-values.
Test 4:exportation
Null Hypothesis: D(EXPORT) has a unit root Exogènes:
Constant, Linear Trend
Lag Length: 0 (Fixed)
t-Statistic Prob.*
Augmented Dickey-Fuller test statistic -4.987182 0.0010
Test critical values: 1% level -4.165756
5% level -3.508508
10% level -3.184230
*MacKinnon (1996) one-sided p-values.
Source, résultat Eviews
Tableau A-4 : Test de cointégration >
No deterministic trend
Unrestricted Cointegration Rank Test (Trace)
|
Hypothesized
|
|
Trace
|
0.05
|
|
|
No. of CE(s)
|
Eigenvalue
|
Statistic
|
Critical Value
|
Prob.**
|
|
None
|
0.267089
|
29.08752
|
40.17493
|
0.4036
|
|
At most 1
|
0.197880
|
14.79392
|
24.27596
|
0.4720
|
|
At most 2
|
0.071148
|
4.651064
|
12.32090
|
0.6170
|
|
At most 3
|
0.026935
|
1.256011
|
4.129906
|
0.3063
|
> No deterministic trend (restricted
constant)
Unrestricted Cointegration Rank Test (Trace)
|
Hypothesized
|
|
Trace
|
0.05
|
|
|
No. of CE(s)
|
Eigenvalue
|
Statistic
|
Critical Value
|
Prob.**
|
|
None
|
0.359742
|
42.58934
|
54.07904
|
0.3474
|
|
At most 1
|
0.202726
|
22.07868
|
35.19275
|
0.5902
|
|
At most 2
|
0.186600
|
11.65704
|
20.26184
|
0.4800
|
|
At most 3
|
0.045800
|
2.156548
|
9.164546
|
0.7464
|
> Linear deterministic trend
Unrestricted Cointegration Rank Test (Trace)
|
Hypothesized
|
|
Trace
|
0.05
|
|
|
No. of CE(s)
|
Eigenvalue
|
Statistic
|
Critical Value
|
Prob.**
|
|
None
|
0.349360
|
36.90552
|
47.85613
|
0.3520
|
|
At most 1
|
0.201479
|
17.13478
|
29.79707
|
0.6301
|
|
At most 2
|
0.126521
|
6.785050
|
15.49471
|
0.6028
|
|
At most 3
|
0.012156
|
0.562594
|
3.841466
|
0.4532
|
Source, résultats eviews
Tableau A-5 : Résultat de l'estimation du
mod~le
Vector Autoregression Estimates
Date: 03/25/11 Time: 09:35
Sample (adjusted): 1963 2008
Included observations: 46 after adjustments Standard errors in (
) & t-statistics in [ ]
|
DEXPORT
|
DINFL
|
DPP
|
DTXCROISS
|
|
DEXPORT (-1) 0.268517
|
-3.30E-09
|
4.70E-09
|
9.15E-10
|
|
(0.15857)
|
(2.2E-09)
|
(2.1E-09)
|
(2.1E-09)
|
|
[1.69342]
|
[-1.47764]
|
[2.21618]
|
[0.44340]
|
|
DINFL (-1) 18153811
|
-0.263418
|
-0.048598
|
0.037765
|
|
(1.0E+07)
|
(0.14122)
|
(0.13395)
|
(0.13027)
|
|
[1.81325]
|
[-1.86528]
|
[-0.36280]
|
[0.28989]
|
|
DPP (-1) 12162971
|
0.028834
|
0.293687
|
-0.143212
|
|
(1.3E+07)
|
(0.18984)
|
(0.18007)
|
(0.17513)
|
|
[0.90373]
|
[2.15188]
|
[1.63095]
|
[-1.81777]
|
|
DTXCROISS (-1) 16049814
|
0.012750
|
0.068751
|
-0.471869
|
|
(1.1E+07)
|
(0.14985)
|
(0.14214)
|
(0.13824)
|
|
[1.51076]
|
[0.08508]
|
[0.48368]
|
[-3.41346]
|
|
C 1.66E+08
|
0.733951
|
0.678665
|
-0.023556
|
|
(7.3E+07)
|
(1.02716)
|
(0.97430)
|
(0.94754)
|
|
[2.28469]
|
[0.71454]
|
[0.69657]
|
[-0.02486]
|
|
R-squared 0.194489
|
0.128120
|
0.209804
|
0.226969
|
|
Adj. R-squared 0.115902
|
0.043059
|
0.132712
|
0.151551
|
|
Sum sq. resids 8.03E+18
|
1597.887
|
1437.650
|
1359.766
|
|
S.E. equation 4.43E+08
|
6.242825
|
5.921540
|
5.758909
|
|
F-statistic 2.474838
|
1.506206
|
2.721473
|
3.009493
|
|
Log likelihood -978.3984
|
-146.8705
|
-144.4400
|
-143.1590
|
|
Akaike AIC 42.75645
|
6.603065
|
6.497392
|
6.441695
|
|
Schwarz SC 42.95522
|
6.801830
|
6.696158
|
6.640460
|
|
Mean dependent 2.32E+08
|
0.166312
|
2.063188
|
0.021452
|
|
S.D. dependent 4.71E+08
|
6.381731
|
6.358477
|
6.252122
|
|
Determinant resid covariance (dof adj.)
|
6.66E+21
|
|
|
|
Determinant resid covariance
|
4.20E+21
|
|
|
|
Log likelihood
|
-1406.264
|
|
|
|
Akaike information criterion
|
62.01150
|
|
|
|
Schwarz criterion
|
62.80656
|
|
|
Source, résultat Eviews
Tableau A-6 : TEST DE LA CAUSALITE
Pairwise Granger Causality Tests
|
Date: 03/26/11 Time: 09:57
Sample: 1960 2008
Lags: 1
|
|
|
|
|
Null Hypothesis:
|
Obs
|
F-Statistic
|
Probability
|
|
INFL does not Granger Cause EXPORT
|
47
|
1.19329
|
0.28061
|
|
EXPORT does not Granger Cause INFL
|
|
0.25442
|
0.61650
|
|
PP does not Granger Cause EXPORT
|
48
|
0.06924
|
0.79364
|
|
EXPORT does not Granger Cause PP
|
|
6.11005
|
0.01729
|
|
TXCROISS does not Granger Cause EXPORT
|
47
|
1.17118
|
0.28506
|
|
EXPORT does not Granger Cause TXCROISS
|
|
5.44061
|
0.02431
|
|
PP does not Granger Cause INFL
|
47
|
0.03916
|
0.84404
|
|
INFL does not Granger Cause PP
|
|
0.09097
|
0.76436
|
|
TXCROISS does not Granger Cause INFL
|
47
|
0.15419
|
0.69646
|
|
INFL does not Granger Cause TXCROISS
|
|
0.33248
|
0.56714
|
|
TXCROISS does not Granger Cause PP
|
47
|
3.88835
|
0.05493
|
|
PP does not Granger Cause TXCROISS
|
|
5.81855
|
0.02010
|
Source, résultat Eviews
GRAPHIQUE A-2 : REPONSE IMPULSIONNELLE
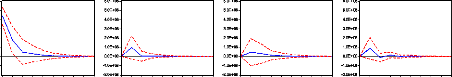
8 8 8
-1.0E+08 10E+08 -1.0E+08
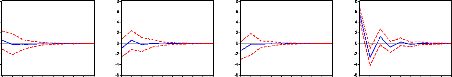
Source, résultat Eviews
TABLEAU A-7 : DECOMPOSITION DE LA VARIANCE
Variance Decomposition of DEXPORT:
|
Period S.E.
|
DEXPORT DINFL
|
DPP DTXCROISS
|
|
1
|
4.43E+08
|
100.0000
|
0.000000
|
0.000000
|
0.000000
|
|
2
|
4.97E+08
|
92.23871
|
3.781334
|
0.829794
|
3.150162
|
|
3
|
5.01E+08
|
91.90361
|
3.733572
|
1.196198
|
3.166622
|
|
4
|
5.02E+08
|
91.78874
|
3.724128
|
1.246214
|
3.240922
|
|
5
|
5.02E+08
|
91.77604
|
3.724637
|
1.259564
|
3.239756
|
|
6
|
5.02E+08
|
91.76987
|
3.724112
|
1.262222
|
3.243795
|
|
7
|
5.02E+08
|
91.76921
|
3.724125
|
1.262887
|
3.243779
|
|
8
|
5.02E+08
|
91.76888
|
3.724098
|
1.263017
|
3.244008
|
|
9
|
5.02E+08
|
91.76884
|
3.724099
|
1.263050
|
3.244010
|
|
10
|
5.02E+08
|
91.76882
|
3.724097
|
1.263057
|
3.244023
|
Variance Decomposition of DINFL:
|
Period S.E.
|
DEXPORT DINFL
|
DPP DTXCROISS
|
|
1
|
6.242825
|
4.294497
|
95.70550
|
0.000000
|
0.000000
|
|
2
|
6.680018
|
10.47090
|
89.47337
|
0.044724
|
0.011013
|
|
3
|
6.690946
|
10.44484
|
89.20598
|
0.091553
|
0.257627
|
|
4
|
6.693558
|
10.45610
|
89.13775
|
0.096237
|
0.309909
|
|
5
|
6.694448
|
10.45932
|
89.11409
|
0.096911
|
0.329673
|
|
6
|
6.694597
|
10.45976
|
89.11027
|
0.097186
|
0.332775
|
|
7
|
6.694644
|
10.45988
|
89.10900
|
0.097221
|
0.333892
|
|
8
|
6.694653
|
10.45990
|
89.10878
|
0.097234
|
0.334077
|
|
9
|
6.694656
|
10.45991
|
89.10871
|
0.097236
|
0.334142
|
|
10
|
6.694656
|
10.45991
|
89.10870
|
0.097237
|
0.334153
|
Variance Decomposition of DPP:
|
Period S.E.
|
DEXPORT DINFL
|
DPP DTXCROISS
|
|
1
|
5.921540
|
13.97876
|
0.002029
|
86.01922
|
0.000000
|
|
2
|
6.708486
|
27.22547
|
0.296021
|
72.16098
|
0.317521
|
|
3
|
6.977731
|
31.18841
|
0.728419
|
67.54642
|
0.536748
|
|
4
|
7.024677
|
31.80241
|
0.752490
|
66.87193
|
0.573168
|
|
5
|
7.035287
|
31.94407
|
0.758557
|
66.71851
|
0.578860
|
|
6
|
7.037694
|
31.97566
|
0.759994
|
66.68353
|
0.580818
|
|
7
|
7.038222
|
31.98267
|
0.760316
|
66.67592
|
0.581098
|
|
8
|
7.038341
|
31.98422
|
0.760384
|
66.67420
|
0.581196
|
|
9
|
7.038367
|
31.98457
|
0.760400
|
66.67382
|
0.581209
|
|
10
|
7.038373
|
31.98465
|
0.760404
|
66.67373
|
0.581214
|
Variance Decomposition of DTXCROISS:
|
Period S.E.
|
DEXPORT DINFL
|
DPP DTXCROISS
|
|
1
|
5.758909
|
1.181507
|
2.249269
|
5.414594
|
91.15463
|
|
2
|
6.352756
|
1.033339
|
2.869741
|
4.508524
|
91.58840
|
|
3
|
6.483404
|
1.101843
|
2.874153
|
4.351623
|
91.67238
|
|
4
|
6.518361
|
1.115057
|
2.848024
|
4.306313
|
91.73061
|
|
5
|
6.526055
|
1.114611
|
2.844361
|
4.297983
|
91.74305
|
|
6
|
6.528106
|
1.115342
|
2.842830
|
4.295322
|
91.74651
|
|
7
|
6.528559
|
1.115292
|
2.842618
|
4.294822
|
91.74727
|
|
8
|
6.528679
|
1.115324
|
2.842530
|
4.294666
|
91.74748
|
|
9
|
6.528706
|
1.115319
|
2.842517
|
4.294635
|
91.74753
|
|
10
|
6.528713
|
1.115321
|
2.842512
|
4.294626
|
91.7475
|
Cholesky Ordering: DEXPORT DINFL DPP DTXCROISS
Source, résultat Eviews
| 
