4.3 Deployment Diagram
This diagram shows the physical organization
of the application design, it specifies the
components to
our application. In our case we need an
application server to deploy our application above;
a database server to store the database tables, as well
as the customer requires a browser to
access web pages.
ESPRIT must have sufficiently
powerful application servers to be able to handle the
traffic of a large number of Internet users.
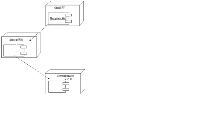
Fig28. Deployment
diagram
4.4 Implementation
The GUI
(graphical user interface) is the most crucial
part in a web application. It contributes to
the construction of the first user impression on the
system. Indeed, it is a criterion
that can adds the difference between two web
applications although they have the same functionality.
Thus, we tried to provide attractive interfaces that should give
the main application features.
The first interface that will be displayed to the
user of our system is the main interface; it contain forum,
request for registration and connexion space. If he already
has an account, he has to provide its parameters,
user name / password so
can access his privileged space. A page will
display to him that contains all his permitted features so can choose any
other fonctionnality he needs; so he will be automatically redirect to another
web page. If not he can only interact in the forum.
-I will present the application and all its interfaces in test
validity-.
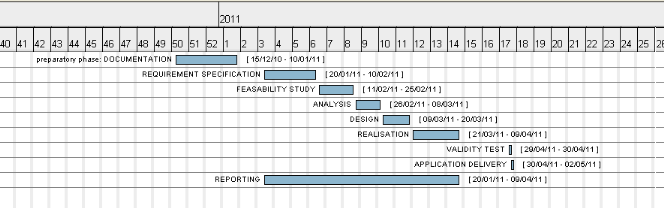
4.5 Timing
diagram
To be managed in a quality, a project must follow different
phases during which, each point should define a step: task, to detect
non-conformances at the earliest and adapt to new stresses due to unforeseen
contingencies initially. Therefore, it is essential to control the time
allocated to each task.
This project was conducted
from November 21, 2010 to April 9,
2011. We first started by a
phase of literature on information related
to our application field and a thorough review of the
existing order to understand the
needs and begin the work. Then, after
clearing and understood what is asked, we were able
to meet the functional and non functional
requirements. Then we started the design
phase and implemented the requested module after
passing through technology documentation
we will use.
How do we devise the work?
What was the followed process to obtain a system that must be
functional?
Tasks that compose our project from documentation to realization
are:
Task 1: Preparatory phase (documentation):
the
preparation of documents having a relationship with the topic of project and
indicating its organizational conditions.
Task 2 : establishment
of requirements specification:
Redaction of tender specification
Task 3:
Feasibility study:
we talk about the technical feasibility of
the project.
This phase is triggered by reception of the specification:
functional and non fictional requirements.
Task 4: The study of
scenarios: Analysis
the feasibility study leads to consider
several scenarios (the « cases study » to be implemented by our
system).
This step aims to identify and document each feature that must
provide our software and create specification documents, which will form the
basis of the specifications trend. It is in this stage that the conception of
the software graphical interface will be created.
Task 5 :
Detailed design: Conception
Design
work is to determine the theoretical technical
solutions that will satisfy the specifications, that is to
apply the expectations of the user. The result of
the work is application
diagrams such as class diagrams and interaction
diagram.
Task 6:Development of application: Realization:
Construction
The construction is the main activity, which occupies more
than half of the total development time. During this step
we write the software source
code.
The various modules of
the software are programmed one by one, then collected.
And quotation of goals achieved compared to those original.
Task 7: Test of application validity
Tests
are performed to verify the functioning of the whole
(integration test); conducts many tests to detect a
maximum of bugs - errors in programming is
advised.
Task 8: application delivery, reporting and
presentation
When the application is running and once we have tested its
operation, we can deliver it with the explanatory report which was written
chapter by chapter simultaneously with all other tasks (every step achieved it
must be explained in the report).
To organize and to carry out the
project, we established a detailed diagram of the
various tasks that constitute our project.
The Gantt
diagram is a tool used in project management for viewing various tasks that
comprise the project according to time. It is a graphical representation of the
progress of the project, modeling and planning tasks.
| 

