CHAPTER II: JUSTIFICATION OF STUDY
The measure of blood pressure is not carried out
systematically during pediatric consultations. This leads to discovery of
hypertension only whensigns of severity occur. Studies in many parts of the
world, have demonstrated a higher blood pressure prevalence in urban
zones[27].
In Cameroon, most studies on HTN in children were carried out
in urban and semi-urban settings
-''''''''''''''''''''''''''''''''''''''''''''''''''''''`'''''''''''''[24-26].
The prevalence varied between 2.2% in
Yaounde'''''''''''''''''''''''`'''''''''''''[25], 2.9% in
Bertoua'''''''''''''''''''''''''''''''[24] and 3.2% in
Buea[26].Lifestyle in urban and rural settings are different,
and knowing its influence on HTN, we decided to carry out this study in a rural
setting. The Mbankomo subdivision found in the Centre region was thereby
chosen, because of its easy access and the abundance of schoolsit has.
From our results, we will draw conclusions and recommendations
to help raise awareness of pediatric HTN; promote screening as well as ensure
early management and foster educational programs on healthy lifestyle from
childhood. This will go a long way to achieve the sustainable development
goal(SDG) 3.4--[28], which aims by the year 2030,at reducing
by one third premature mortality from non-communicable diseases through
prevention and treatment and promote mental health and well-being by the year
2030.
CHAPTER III: RESEARCH QUESTION
What is the prevalence and associated factors of hypertension
in primary school children in Mbankomo subdivision found in theMefou and Akono
division, Centre Region?
CHAPTER IV: RESEARCH HYPOTHESIS
Hypertension exists in primary school children of Mbankomo
subdivision, with associated factors.
CHAPTER V: OBJECTIVES
ü General Objective
· Determine the prevalence and associated factors of
hypertension in children attending primary schools in Mbankomo subdivision
found in theMefou and Akono division, Centre Region.
ü Specific Objectives
· Assess the socio-demographic characteristics of primary
school children in the Mbankomo subdivision.
· Determine the prevalence of elevated BP and
hypertension among primary school children in Mbankomo subdivision.
· Determine the factors associated to hypertension in
this population.
CHAPTER Vi: literature
revIEW
VI.1 OVERVIEW
VI.1.1DEFINITION OF TERMS AND CONCEPTS
· Childhood: This is the period of life
between infancy and onset of puberty and is usually between 2 and 10 years
inclusive[29].
· Adolescence: This is the transition
period of life between childhood and adulthood and is between 11 and 19years of
age[30].
· Childhood hypertension: It refers to
BP equal to or over the age- and gender-specific 95th percentile
value[19].
· Prehypertension: It is considered as
BP equal or greater than 90th percentile and less than
95th percentile for age, height, and gender or BP equal or more than
120/80mmHg[19].
· Body mass index (BMI): It is a simple
index of weight and height that is commonly used to classify overweight and
obesity in adults. It is the weight in kilograms divided by the square of the
height in meters[31].
· Childhood obesity: Children with BMI
equal or greater than the age-gender-specific 95th percentile of
growth chart[31].
· Childhood overweight: BMI equal or
greater than 85th percentile but less than the age-gender specific
95th percentile of growth chart[31].
· Normal weight: BMI equal or greater
than 5th percentile but less than the age-gender specific
85thpercentile of growth chart[31].
· Underweight: BMI less than the
age-gender specific 5thpercentile of the growth chart[31].
VI.1.2EPIDEMIOLOGY
In terms of non-communicable diseases in children, HTN comes
second following Asthma and Obesity[32]. The true incidence of
hypertension in paediatric population is unknown[33]. The
prevalence is increasing in accordance with widespread life-style changes and
epidemic of childhood obesity[23]. Alarming data exist on the
prevalence of childhood HTN not only in industrialized countries, but also in
developing countries'-[6,34]. Because of differences in
genetic and environmental factors, incidences vary from country to country and
even from region to region in the same country[33,35]. The
prevalence of HTN among children reported by various studies ranges from 5.4%
to 19.4%[5,36]. The prevalence appears to be increasing and is
estimated to be 1% to 4% in Europe and 4% to 14% in the
USA[35,37]. In Sub-Saharan Africa: 4.9% in Sudan
[5]; 11.4% in South Africa[38]; 10% in
Congo'-[6]; 4.7% in Port Harcourt,
Nigeria[23]. In Cameroon: 2.2% in Yaoundé
'''''''''''''''''''''''`'''''''''''''[25], 2.9% in
Bertoua'''''''''''''''''''''''''''''''[24]and 3.2% in
Buea[26].
BP in children varies with age, gender, and height. However,
these relations do not become evident until children reach school age (3 years)
[33,39]. Numerous investigators have noted a correlation
between BP of parents and their offspring[40]. Familial
aggregation of BP is detectable early in life. Some data relate this
association to concomitant obesity in both parents and
child[8].
Moreover, studies have shown that there are no significant
differences in BP between girls and boys younger than 6 years. From that age
until puberty, BP is slightly higher in girls than in boys. At puberty and
beyond, BP is slightly higher in male adolescents than in comparable aged
femaleadolescents[35,39,41,42].
There are no differences in BP between African American and
white children[8,41].
VI.1.3CLASSIFICATION
Pediatric HTN is defined and classified by two different
consensus[19,43]:
ü The French consensus
According to the French consensus, normal BP in children is
defined as SBP and DBP less than 97.5th percentile for age, sex and
height[43]; Paediatric HTN defined as SBP and/or DBP equal or
more than 97.5th percentile for age, sex and height taken on at
least 3 separate occasions[19,43]. This school of thought
further classified Pediatric HTN into 3 stages as follows:
Table I: The French
Classification of Pediatric HTN[43]
|
STAGE
|
SBP and/or DBP percentile
|
|
Normal
|
< 97.5th percentile
|
|
Limited or Moderate hypertension
|
= 97.5th to <97.5th percentile +
10mmHg
|
|
Confirmed hypertension
|
= 97.5th + 10mmHg to <97.5th
percentile + 30mmHg
|
|
Emergency hypertension
|
= 97.5th percentile + 30mmHg
|
Source:Andre J. Hypertension
artérielle chez l'enfant et l'adolescent. EMC -
Cardiol-Angéiologie. 2005 Nov;2(4):478-90.
ü The American Consensus
According to the AAP(American Academy of Pediatrics) in
2017[44] which revised the Fourth Report on Blood Pressure
Control in Children of NHBPEP[19], the normal BP in children
is defined as BP less than 90thpercentile for age, sex and height.
Paediatric HTN is defined as BP of 95th percentile or more, measured
on at least three separate occasions using the auscultatory
method[44]. This school classifies paediatric HTN into 4
classes as follows:
Table II: American
Classification of Pediatric HTN[44]
|
For Children Aged 1-13 years
|
For Children Aged =13 years
|
|
Normal BP: <90thpercentile
|
Normal BP:<120/<80 mm Hg
|
|
Elevated BP: =90thpercentile to
<95th percentile or 120/80 mm Hg to <95th
percentile (whichever is lower)
|
Elevated BP: 120/<80 to 129/<80 mm Hg
|
|
Stage 1 HTN: =95thpercentile to
<95thpercentile + 12 mmHg,or 130/80 to 139/89 mm Hg (whichever is
lower)
|
Stage 1 HTN: 130/80 to 139/89 mm Hg
|
|
Stage 2 HTN: =95thpercentile + 12 mm
Hg, or =140/90 mm Hg (whichever is lower)
|
Stage 2 HTN: =140/90 mm Hg
|
Source:-Flynn JT, Kaelber DC,
Baker-Smith CM, et al. Clinical Practice Guideline for Screening and Management
of High Blood Pressure in Children and Adolescents. Pediatrics.
2017;140(3):e20171904..
Presented below are charts showing the approximation of blood
pressure centiles from the task force report on BP control in
children''[45] :
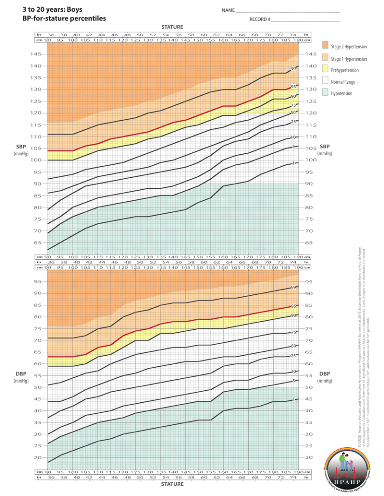
Figure 1: BP-for-stature
percentiles, Boys 3 to 20 years
Source: Ashish B, Cynthia B,
Monesha GM, Joshua S. Blood pressure percentile charts to identify high or low
blood pressure in children. BMC Pediatrics. (2016);16:98.
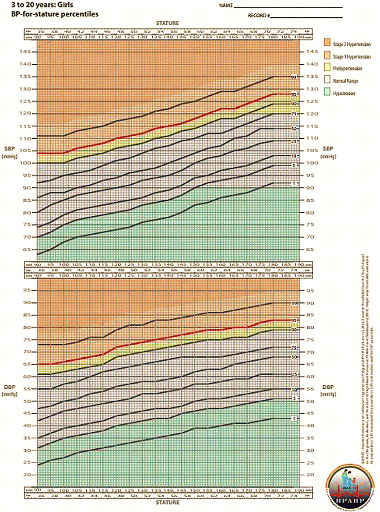
Figure 2: BP-for-stature
percentiles, Girls 3 to 20 years
Source: Ashish B, Cynthia B,
Monesha GM, Joshua S. Blood pressure percentile charts to identify high or low
blood pressure in children. BMC Pediatrics. (2016);16:98.
VI.1.3.1HISTORY OF THE PRESENT DEFINITION AND
CLASSIFICATION OF PEDIATRIC HYPERTENSION
In 1977, the first Report of the Task Force on Blood Pressure
Control in Children was published in the United States [46],
with the aim of standardizing measuring and monitoring methods; standardizing
distribution curves of arterial BP in healthy children; and of organizing BP
into percentile graphs according age and sex[46]. In this
study, the 95thpercentile was established as normotensive levels and
the recommendation that «All children 3 years of age or older should have
their BP measured during any health maintenance visits or emergency
visits». Since then, series of nationwide and international studies have
been undertaken and new concepts elaborated.
In 1987, the 2nd Report of the Task Force on BP
Control in Children was released which established that «Normal BP is less
90thpercentile for age, sex and height: and HTN greater than
95thpercentile» and this report also recommended
«5th phase korotkoff sound as reference for
DBP[19].
The Third Report of the Task Force, published in 1996,
provided further details regarding the diagnosis and treatment of HTN in
infants and children.
In 2004, the Fourth Report later introduced, prehypertension,
Stage 1 HTN and Stage 2 HTN. This classification was created to align the
categories for children with the categories for adults from the recommendations
of the Seventh Report of the Joint National Committee on Prevention, Detection,
Evaluation, and Treatment of Hypertension[19].
In 2017, the AAP updated the 2004 «Fourth Report on the
Diagnosis, Evaluation, and Treatment of High Blood Pressure in Children and
Adolescents» by making the following major changes; the replacement of the
term `prehypertension' with the term `elevated blood pressure', new normative
pediatric blood pressure (BP) tables based on normal-weight children, a
simplified screening table for identifying BPs needing further evaluation, a
simplified BP classification in adolescents =13 years of age that aligns with
the forthcoming American Heart Association and American College of Cardiology
adult BP guidelines, a more limited recommendation to perform screening BP
measurements only at preventive care visits, streamlined recommendations on the
initial evaluation and management of abnormal BPs, an expanded role for
ambulatory BP monitoring in the diagnosis and management of pediatric
hypertension, and revised recommendations on when to performechocardiography in
the evaluation of newly diagnosed hypertensivepediatric patients (generally
only before medication initiation), along with a revised definition of left
ventricular hypertrophy[44].
VI.1.4ETIOLOGIES
There exists 2 forms of HTN: Essential and Secondary
HTN[12,19,44].
Secondary HTN is defined as HTN which occurs as a result of an
underlying disorder. When no identifiable cause is found, it is referred to as
Primary or Essential HTN.
Essential hypertension is mostly found in adults as compared
to that found in children and adolescents''[2,19,47].
Significant determinants for essential hypertension include family history of
hypertension, cardiovascular disease, and obesity as well as low birth weight,
insulin resistance, sedentarity, salt consumption and tobacco
intake'[13,19]. Some sleep disorders like: Obstructive sleep
apnea, insomnia, and restless legs syndrome have been reported to be associated
with essential hypertension [15,48].
Secondary hypertension which the most common form, is more
common in children than in adults''[2,19,35]. It can be
present in adolescents, especially if they have physical findings not typically
seen with essential hypertension.67% to 80% of secondary HTN are of renal
origin with 34.89% being nephrotic
syndrome'''''''''''''''''''''''''''''''[24]. Other causes
include endocrine disease (e.g pheochromocytoma, hyperthyroidism) and
pharmaceuticals (e.g., oral contraceptives, sympathomimetics, some over-the
counter medications, dietary supplements). Transient rise in blood pressure,
which can be mistaken for hypertension, is seen with caffeine use and certain
psychological disorders (anxiety and stress)[49,50].The causes
of secondary HTN can be seen on the following table:
Table III: Causes of
secondary hypertension in Pediatrics[19]
|
CAUSE
|
ABNORMALITY
|
CONDITION
|
|
Renal
|
Parenchymal
|
· Glomerulonephritis
· Chronic kidney failure
· Hemolytic uremic syndrome
· Polycystic kidney disease
· Tumor(nephroblastoma)
|
|
Renovascular
|
· Renal artery stenosis(fibromuscular dysplasia, Takayasu
disease)
· Multiple vascular
lesions(neurofibromatosis, panarterities, renal artery thrombrosis)
|
|
Endocrine
|
|
· Cushing syndrome
· Pheochromocytoma
· Primary hyperaldosteronism
|
|
Vascular
|
|
· Coarctation of aorta
· Angiodysplasia
|
|
Metabolic
|
|
· Hypercalcemia
· Porphyria
|
|
Exogenous
|
|
· Corticotherapy
· Vitamin D intoxication
· Cyclosporine
· Amphetamine
|
Sources:- National High Blood
Pressure Education Program Working Group on High Blood Pressure in Children and
Adolescents. The fourth report on the diagnosis, evaluation, and treatment of
high blood pressure in children and adolescents. Pediatrics. 2004 Aug; 114(2
Suppl 4th Report):555-76.
VI.1.5 RISK FACTORS
Hypertension is a multifactorial disease, influenced by
genetic, racial, geographic, cultural and dietary pattern[8].
Identifying and modifying the risk factors, reduces the incidence and
complications in adults[16].Studies have noted a strong
association between overweight, obesity and high BP. In particular, obesity
epidemic appears to be the major contributor of the increasing trends in
childhood HTN[16,35,41,49].
However, apart from obesity, other factors such as:
dietaryhabits, lack of physical activity, sedentary behaviour, as well as
increase dietary salt intake have been associated with increased BP in children
independent of body composition. These include[8]:
· Abnormal lipid profile
· Overweight and Obesity
· Insulin resistance
· Increased salt intake
· Family history of hypertension
· Low birth weight
· Sedentary lifestyle
VI.1.6 PATHOPHYSIOLOGY
Blood Pressure(BP) is determined by a balance between cardiac
output and vascular resistance.
Based on Franck Starling formula[51]:
BP = Cardiac output(CO) × Total
Peripheral Resistance(TPR)
A rise in either of these variables, in the absence of a
compensatory decrease in the other, increases mean BP, which is the driving
pressure[52]. The total peripheral resistance reflects the
vasomotor tone generated by the arteries (mostly those of small calibre) and
volemia to a lower extent[52,53].Contraction of smooth muscle
cells is thought to be related to a rise in intracellular calcium
concentration, which may explain the vasodilatory effect of drugs that block
the calcium channels. Prolonged smooth muscle constriction is thought to induce
structural changes with thickening of the arteriolar vessel walls possibly
mediated by angiotensin, leading to an irreversible rise in peripheral
resistance[53].The cardiac output is the product of
heart rate(HR) and stroke volume(SV):
CO = HR xSV
The stroke volume depends on the quantity of blood present in
the left ventricle at the end of diastole and the heart rate depends on the
equilibrium between the sympathetic and the parasympathetic
systems[52].
It has been postulated that in very early hypertension the
peripheral resistance is not raised and the elevation of the blood pressure is
caused by a raised cardiac output, which is related to sympathetic
over-activity. The subsequent rise in peripheral arteriolar resistance might
therefore develop in a compensatory manner to prevent the raised pressure being
transmitted to the capillary bed where it would substantially affect cell
homeostasis[53].
Figure 3:The heart, arteries
and arterioles in hypertension[53]
Source: Beevers G, Lip GYH,
O'Brien E. The pathophysiology of hypertension. BMJ. 2001 Apr
14;322(7291):912-6.
The reninangiotensin system may be the most important of the
endocrine systems that affect the control of blood pressure. Renin is secreted
from the juxtaglomerular apparatus of the kidney in response to glomerular
under perfusion or a reduced salt intake. It is also released in response to
stimulation from the sympathetic nervous system[53].
Renin is responsible for converting renin substrate
(angiotensinogen) to angiotensin I, a physiologically inactive substance which
is rapidly converted to angiotensin II in the lungs by angiotensin converting
enzyme (ACE). Angiotensin II is a potent vasoconstrictor and thus causes a rise
in blood pressure. In addition it stimulates the release of aldosterone from
the zona glomerulosa of the adrenal gland, which results in a further rise in
blood pressure related to sodium and water retention[53].
The circulating reninangiotensin system is not thought to be
directly responsible for the rise in blood pressure in essential hypertension.
In particular, many hypertensive patients have low levels of renin and
angiotensin II (especially elderly and black people), and drugs that block the
reninangiotensin system are not particularly effective[53].
There is, however, increasing evidence that there are
important noncirculating «local» reninangiotensin epicrine or
paracrine systems, which also control blood pressure.
Local renin systems have been reported in the kidney, the
heart, and the arterial tree. They may have important roles in regulating
regional blood flow[53].

Figure 4: Reninangiotensin
system and effects on blood pressure and aldosterone release[53]
Source: Beevers G, Lip GYH,
O'Brien E. The pathophysiology of hypertension. BMJ. 2001 Apr
14;322(7291):912-6.
Sympathetic nervous system stimulation can cause both
arteriolar constriction and arteriolar dilatation. Thus the autonomic nervous
system has an important role in maintaining a normal blood pressure. It is also
important in the mediation of short term changes in blood pressure in response
to stress and physical exercise.
There is, however, little evidence to suggest that
epinephrine(adrenaline) and norepinephrine (noradrenaline) have any clearrole
in the aetiology of hypertension.Nevertheless, their effects are important, not
least because drugs that block the sympathetic nervous system do lower blood
pressure and have a well-establishedtherapeutic role[53].
It is probable that hypertension is related to an interaction
between the autonomic nervous system and the reninangiotensin system, together
with other factors, including sodium, circulating volume, and some of the more
recently described hormones[53].

Figure 5: The autonomic
nervous system and its control of blood pressure[53]
Source: Beevers G, Lip GYH,
O'Brien E. The pathophysiology of hypertension. BMJ. 2001 Apr
14;322(7291):912-6.
Vascular endothelial cells play a key role in cardiovascular
regulation by producing a number of potent local vasoactive agents, including
the vasodilator molecule nitric oxide and the vasoconstrictor peptide
endothelin. Dysfunction of the endothelium has been implicated in human
essential hypertension[53].
Modulation of endothelial function is an attractive
therapeutic option in attempting to minimise some of the important
complications of hypertension. Clinically effective antihypertensive therapy
appears to restore impaired production of nitric oxide, but does not seem to
restore the impaired endothelium dependent vascular relaxation or vascular
response to endothelial agonists. This indicates that such endothelial
dysfunction is primary and becomes irreversible once the hypertensive process
has become established[53].
Many other vasoactive systems and mechanisms affecting sodium
transport and vascular tone are involved in the maintenance of a normal blood
pressure. It is not clear, however, what part these play in the development of
essential hypertension. Bradykinin is a potent vasodilator that is inactivated
by angiotensin converting enzyme. Consequently, the ACE inhibitors may exert
some of their effect by blocking bradykinin
inactivation[53].
Endothelin is a recently discovered, powerful, vascular,
endothelial vasoconstrictor, which may produce a salt sensitiverise in blood
pressure. It also activates local reninangiotensin systems. Endothelial derived
relaxant factor, now known to be nitric oxide, is produced by arterial and
venous endothelium and diffuses through the vessel wall into the smooth muscle
causing vasodilatation.
Atrial natriuretic peptide is a hormone secreted from the
atria of the heart in response to increased blood volume. Its effect is to
increase sodium and water excretion from the kidney as a sort of natural
diuretic. A defect in this system may cause fluid retention and
hypertension[53].
Sodium transport across vascular smooth muscle cell walls
is also thought to influence blood pressure via its interrelation with calcium
transport. Ouabain may be a naturally occurring steroidlike substance which is
thought to interfere with cell sodium and calcium transport, giving rise to
vasoconstriction.

Figure 6: The control of
peripheral arteriolar resistance[53]
Source: Beevers G, Lip GYH,
O'Brien E. The pathophysiology of hypertension. BMJ. 2001 Apr
14;322(7291):912-6.
Patients with hypertension demonstrate abnormalities of vessel
wall (endothelial dysfunction or damage), the blood constituents (abnormal
levels of haemostatic factors, platelet activation, and fibrinolysis), and
blood flow (rheology, viscosity, and flow reserve), suggesting that
hypertension confers a prothrombotic or hypercoagulable state. These components
appear to be related to target organ damage and long term prognosis, and some
may be altered by antihypertensive treatment[53].

Figure 7: Virchow's triad
and the prothrombotic state in hypertension[53]
Source: Beevers G, Lip GYH,
O'Brien E. The pathophysiology of hypertension. BMJ. 2001 Apr
14;322(7291):912-6.
Epidemiologically there is a clustering of several risk
factors, including obesity, hypertension, glucose intolerance, diabetes
mellitus, and hyperlipidaemia. In obese children, hyperinsulinemia may elevate
BP by increasing sodium reabsorption and sympathetic tone. The complexity of
the system explains the difficulties often encountered in identifying the
mechanism that accounts for HTN. These difficulties are the main reasons why
treatment is often designed to affect regulatory factors rather than the cause
of the disease[48,50].
Indeed some hypertensive patients who are not obese display
resistance to insulin. There are many objections to this hypothesis, but it may
explain why the hazards of cardiovascular risk are synergistic or
multiplicative rather than just additive.Although separate genes and genetic
factors have been linked to the development of essential hypertension, multiple
genes are most likely contribute to the development of the disorder in a
particular individual. It is therefore extremely difficult to determine
accurately the relative contributions of each of these genes.
Nevertheless, hypertension is about twice as common in
subjects who have one or two hypertensive parents, and many epidemiological
studies suggest that genetic factors account for approximately 30% of the
variation in blood pressure in various populations. This figure can be derived
from comparisons of parents with their monozygotic and dizygotic twin children,
as well as their other children, and with adopted children. Some familial
concordance is, however, due to shared lifestyle (chiefly dietary)
factors[53].
Some specific genetic mutations can rarely cause hypertension.
Experimental models of genetic hypertension have shown that the inherited
tendency to hypertension resides primarily in the kidney. For example, animal
and human studies show that a transplanted kidney from a hypertensive donor
raises the blood pressure and increases the need for antihypertensive drugs in
recipients coming from «normotensive» families. Conversely a kidney
from a normotensive donor does not raise the blood pressure in the recipient.
Increased plasma levels of angiotensinogen, the protein
substrate acted on by renin to generate angiotensin I, have also been reported
in hypertensive subjects and in children of hypertensive parents.
Hypertension is rarely found in rural or «tribal»
areas of Africa, but it is very common in African cities and in black
populations in Britain and the United States. Whereas the rural/urban
differences in Africa are clearly due to lifestyle and dietary factors, the
finding that hypertension is commoner in black people compared with white
people may have some genetic basis. There is some evidence from salt loading
studies in medical students that black Americans are more susceptible to a
given salt load than white Americans, and may be more sensitive to the
beneficial effects of salt restriction[53].
There is increasing evidence that fetal influences,
particularly birth weight, may be a determinant of blood pressure in adult
life. For example, babies who are small at birth are more likely to have higher
blood pressure during adolescence and to be hypertensive as adults. Babies who
are small for their age are also more likely to have metabolic abnormalities
that have been associated with the later development of hypertension and
cardiovascular disease, such as insulin resistance, diabetes mellitus,
hyperlipidaemia, and abdominal obesity (the «Barker hypothesis»).
Insulin resistance almost certainly contributes to the increased prevalence of
coronary disease seen in adults of low birth weight[53].
It is possible, however, that genetic factors influence the
Barker hypothesis. Mothers with above average blood pressure in pregnancy give
birth to smaller babies who subsequently develop above average blood pressure
themselves and eventually hypertension.
It is entirely likely that the similarity of blood pressures
in mother and child are genetic and, in a modern «healthy» society,
unrelated to intrauterine undernutrition[53].

Figure 8: Possible
mechanisms to explain why low birth weight babies are more likely to develop
hypertension in later life[53]
Source: Beevers G, Lip GYH,
O'Brien E. The pathophysiology of hypertension. BMJ. 2001 Apr
14;322(7291):912-6.
In hypertensive left ventricular hypertrophy, the ventricle
cannot relax normally in diastole. Thus, to produce the necessary increase in
ventricular input, especially during exercise, there is an increase in left
atrial pressure rather than the normal reduction in ventricular pressure, which
produces a suction effect as described above. This can lead to an increase in
pulmonary capillary pressure that is sufficient to induce pulmonary congestion.
The rise in atrial pressure can also lead to atrial fibrillation, and in
hypertrophied ventricles dependent on atrial systole the loss of atrial
transport can result in a significant reduction in stroke volume and pulmonary
oedema. Exercise induced subendocardial ischaemia can also produce an
exaggerated» impairment of diastolic relaxation of the hypertrophied
myocardium[53].
VI.1.7 DIAGNOSIS
VI.1.7.1Clinical Presentation
HTN is usually asymptomatic in children. This asymptomatic
characteristic justifies why 75% to 90% of prehypertension are not
diagnosed[54]. Children with mild to moderate elevation of
blood pressure are asymptomatic. Only severe hypertension is symptomatic,
causing headache, visual changes, epistaxis, or nausea. Retinal changes
observed in adults affected by hypertension are seen in less than 50 percent of
paediatric patients[55]. On following table we have the
possible physical findingsindicative of secondary cause of paediatric HTN:
Table IV: Physical findings
indicative of secondary cause of paediatric HTN[15]
|
PHYSICAL FINDINGS
|
POSSIBLE ETIOLOGY
|
|
Abdominal bruit
|
Renal artery stenosis
|
|
Abdominal mass
|
Polycystic kidney disease; hydonephrosis/obstructive renal
lesions; neuroblastoma; wilms' tumor
|
|
Acanthosis nigricans
|
Type 2 diabetes
|
|
Acne
|
Cushing's syndrome
|
|
Adenotonsillar hypertrophy
|
Sleep disorder associated with hypertension
|
|
Decreased perfusion of lower extremities
|
Coarctation of the aorta
|
|
Diaphoresis
|
Pheochromocytoma
|
|
Growth retardation
|
Chronic kidney failure
|
|
Hirsutism
|
Cushing's syndrome
|
|
Joint swelling
|
Systemic lupus erythematosus
|
|
Malar rash
|
Systemic lupus erythematosus
|
|
Moon facies
|
Cushing's syndrome
|
|
Murmur
|
Coarctation of the aorta
|
|
Muscle weakness
|
Hyperaldosteronism Association with primary hypertension
|
|
Obesity (general) Obesity (of the face, neck, or trunk)
|
Cushing's syndrome
|
|
Tachycardia
|
Hyperthyroidism; pheochromocytoma
|
|
Thyromegaly
|
Neuroblastoma
|
Source: Gregory L, Spiotta R.
Hypertension in children and adolescents. Am Fam Physician. 2006;73(9):1158-68.
VI.1.7.2 Blood Pressure Measurement in
children
The preferred method for BP measurement is the auscultatory
method using a mercury sphygmomanometer[19]. Other methods
include:
- The Oscillometric method
- Ultrasound method
- Finger cuff method of Penaz
i. The auscultatory method [19]
Children over the age of 3years who are seen in medical care
settings should have their BP measured at least once during every health care
episode. Those below 3years should have their BP measured in special
circumstances (Appendix IV)[19].
To confirm hypertension, the BP in children should be measured
with a standard mercury sphygmomanometer, using a paediatric stethoscope(it
should not be compressed by the cuff) placed over the brachial artery pulse,
proximal and medial to the cubital fossa, and below the bottom edge of the cuff
(i.e., about 2 cm above the cubital fossa).The use of the bell of the
stethoscope may allow softer Korotkoff sounds to be heard better.
Preparation of the child for standard measurement can affect
the BP level just as much as technique. Ideally, the child whose BP is to be
measured should have avoided stimulant drugs or foods, have been sitting
quietly for 5 minutes, and seated with his or her back supported, feet on the
floor and right arm supported, cubital fossa at heart
level[16,49]. The right arm is preferred in repeated measures
of BP for consistency and comparison to standard tables and because of the
possibility of coarctation of the aorta, which might lead to false (low)
readings in the left arm[15,19]. Correct measurement of BP in
children requires use of a cuff that is appropriate to the size of the child's
upper right arm. The equipment necessary to measure BP in children of ages 3
through adolescence, includes child cuffs of different sizes and must also
include a standard adult cuff, a large adult cuff, and a thigh cuff. The latter
two cuffs may be needed for use in adolescents[19].
By convention, an appropriate cuff size is a cuff with an
inflatable bladder width that is at least 40 percent of the arm circumference
at a point midway between the olecranon and the acromion. For such a cuff to be
optimal for an arm, the cuff bladder length should cover 80-100 percent of the
circumference of the arm. Such a requirement demands that the bladder
width-to-length ratio be at least 1:2[47].
Not all commercially available cuffs are manufactured with
this ratio. Additionally, cuffs labelled for certain age populations (eg,
infant or child cuffs) are constructed with widely disparate dimensions.
Accordingly, the working group recommends that standard cuff dimensions for
children be adopted (see Table V). BP measurements are overestimated to a
greater degree with a cuff that is too small than they are underestimated by a
cuff that is too large. If a cuff is too small, the next largest cuff should be
used, even if it appears large. If the appropriate cuffs are used, the
cuff-size effect is obviated[19].
SBP is determined by the onset of the «tapping»
Korotkoff sounds (K1). Population data in children and risk-associated
epidemiologic data in adults have established the fifth Korotkoff sound (K5),
or the disappearance of Korotkoff sounds, as the definition of DBP. In some
children, Korotkoff sounds can be heard to 0 mm Hg. Under these circumstances,
the BP measurement should be repeated with less pressure on the head of the
stethoscope. Only if the very low K5 persists should K4 (muffling of the
sounds) be recorded as the DBP[19,46].
The standard device for BP measurements has been the mercury
manometer. Because of its environmental toxicity, mercury has been increasingly
removed from health care settings. Aneroid manometers are quite accurate when
calibrated on a semi-annual basis and are recommended when mercury column
devices cannot be obtained[19].
Table V: Recommended
Dimensions for BP Cuff Bladders[19]
|
Age range
|
Width(cm)
|
Length(cm)
|
Maximum arm circumference(cm)
|
|
Newborn
|
4
|
8
|
10
|
|
Infant
|
6
|
12
|
15
|
|
Child
|
9
|
18
|
22
|
|
Small adult
|
10
|
24
|
26
|
|
Adult
|
13
|
30
|
34
|
|
Large adult
|
15
|
38
|
44
|
|
Thigh
|
20
|
42
|
52
|
Source:- National High Blood Pressure
Education Program Working Group on High Blood Pressure in Children and
Adolescents. The fourth report on the diagnosis, evaluation, and treatment of
high blood pressure in children and adolescents. Pediatrics. 2004 Aug; 114(2
Suppl 4th Report):555-76.
ii. Oscillometric method[46]
Its principle is based on BP calculation from pressure
oscillations detected in the arm cuff. This method determines mean BP directly
from the point of maximum oscillation. Neither SBP nor DBP is measured
directly, but is calculated using an algorithm based on a putative relationship
between the oscillations. Then, in cases in which the oscillation is shorter
than usual, as is common in children, the potential for erroneous measurement
increases. If an oscillometric method is applied, the monitor should have
passed the validation procedure recommended by the British Hypertension
Society, the AmericanAssociation for the Advancement of Medical
Instrumentationor the European Society of Hypertension International Protocol
which is very difficult.Therefore, if hypertension is detected by the
oscillometric methods, it must be con?rmed by the auscultatory
method[19,46].
iii. Ultrasound method [56]
Ultrasound transmitter and receiver is placed over brachial
artery under blood pressure cuff. Doppler shift due to movement of blood
beginning with systole up to diastole is recorded.In infants this technique is
used to record systolic blood pressure. Ankle brachial index uses this
technique, where in systolic pressure of brachial and posterior tibial artery
is compared.
iv. Finger cuff method of Penaz [56]
Developed by Penaz, work by principle of «unloaded
arterial wall». Arterial pressure is detected by photo-plethysmograph
under pressure cuff. Output of plethysmograph creates a servo loop, which
rapidly changes cuff pressure such that artery is maintained in open state.
Oscillatory pressure in cuff are measured.Cuff can be kept for 2 hours.
VI.1.8 MANAGEMENT
VI.1.8.1 Evaluation
Once HTN has been confirmed, an extensive history and physical
examination should be conducted to identify underlying causes and to detect any
end organ damage[15].
History : A careful history of family history
of HTN or CVD; sleep disordered breathing (snoring, obstructive sleep apnea);
illicit drugs (tobacco, cocaine) and other over the counter medications should
be obtained[12].
Physical examination: It should include BMI
calculation; lower and upper limb BP measurement to rule out coarctation of the
aorta; examination of the retina[12,15].
VI.1.8.2Laboratory and imaging tests
Laboratory and imaging tests should be conducted to screen for
identifiable causes, detect comorbid conditions and evaluate end organ damage.
This should proceed from simple tests that can be performed on an ambulatory
setting to complex non-invasive and finally to invasive tests.
Usually findings from physical examination dictate the
appropriate choice of tests(Appendix IV)[47]:
Table VI: Indicated
paraclinical work-ups in case of HTN[47]
|
INVESTIGATION
|
TYPE
|
TEST
|
|
Laboratory
|
Blood
|
- Full blood count
-Serum creatinine
-Serum electrolytes
-Uric acid
-glucose
-Triglyceride
-Cholesterol
-Renin, aldosterone
-Lipid profile
|
|
Urine
|
-Dipstick
-Culture
-Sodium
-Catecholamine
|
|
Imaging
|
|
-Echocardiography/ Abdominal ultrasound
-Doppler studies of renal arteries
-Angiography
-CT-scan, MRI
-Polysomnography
-Fundoscopy
-24 hour Blood pressure monitoring
|
Source:- Lurbe E, Cifkova R,
Cruickshank K, Dillon M. Management of high blood pressure in children and
adolescent...?: Journal of Hypertension. J Hypertens. 2009;27:1719-42.
VI.1.8.3 Management
Managing childhood hypertension is directed at the cause of
the elevated blood pressure and the alleviation of any symptoms. End-organ
damage, comorbid conditions, and associated risk factors also influence
decisions about therapy. Non pharmacologic and pharmacologic treatments are
recommended based on the age of the child, the stage of hypertension, and
response to treatment[16,44,47].
i. Non Pharmacologic Therapy
For children and adolescents with elevated BPlevel or stage 1
hypertension, therapeutic lifestyle changes are
recommended[47]. These include weight control, regular
exercise, a low-fat and low-sodium diet, smoking cessation, and abstinence from
alcohol use[15]. Obesity increases the occurrence of
hypertension threefold while favouring the development of insulin resistance,
hyperlipidaemia, and salt sensitivity[57]. Significant obesity
also increases the likelihood of LVH independent of blood pressure
level[5,58]. Exercise has been shown to lower blood pressure
in children but does not affect left ventricular function. Competitive sports
are permitted for children with prehypertension, stage 1 hypertension, or
controlled stage 2 hypertension in the absence of symptoms and end-organ
damage[47]. Nevertheless, the NHBPEP has taken an aggressive
stance on sodium restriction, recommending a sodium intake of 1,200 mg per day;
a no-salt-added diet with more fresh fruits and vegetables combined with
low-fat dairy and protein[19]. According to the DASH (Dietary
Approaches to Stop Hypertension) food plan may be successful in lowering blood
pressure in children. Increased intake of potassium and calcium also has been
suggested as nutritional strategies to lower blood pressure
[15]. Whatever lifestyle changes are recommended, a
family-centered rather than patient oriented approach usually is more
effective.
ii. Pharmacotherapy
Reasons to initiate antihypertensive medication in children
and adolescents include symptomatic hypertension, end-organ damage (e.g., LVH,
retinopathy, proteinuria), secondary hypertension, stage 1 hypertension that
does not respond to lifestyle changes, and stage 2 hypertensionwithout a
clearly modifiable factor (e.g, obesity)[44,47]. In the
absence of end-organ damage or comorbid conditions, the goal is to reduce blood
pressure to less than the 95th percentile for age, height, and sex. When
end-organ damage or coexisting illness is present, a blood pressure goal of
less than the 90th percentile is recommended[19].
Drug therapy is always an adjunct to non-pharmacologic
measures. According to the NHBPEP, pharmacotherapy should follow a step-up
plan, introducing one medication at a time at the lowest dose, then increasing
the dose until therapeutic effects are seen, side effects are seen, or the
maximal dose is reached[19,55]. Only then should a second
agent, preferably one with a complementary mechanism of action, be initiated.
Long-acting medication is useful in improving compliance[35].
Diuretics and beta blockers have documented safety and effectiveness in
children. Preferential use of specific classes of medications for certain
underlying or coexisting pathology has led to the prescribing of ACE inhibitors
or ARB in children with diabetes or CKD and beta-adrenergic or calcium channel
blockers for children with migraines[15]. As with any chronic
health issue, medical follow-up and appropriate monitoring are keys to
long-term success (Appendix IV).
A hypertensive crisis (emergency or urgency) is a life
threatening condition associated with severe hypertension. Hypertensive
emergency is de?ned as severe hypertension complicated with acute target organ
dysfunction (mainly neurological, renal or cardiac)[45].
Hypertensive urgency is de?ned as severe hypertension without acute target
organ dysfunction. Children with hypertensive emergencies should be treated in
an intensive care unit to ensure monitoring and support of the vital organs.The
treatment strategy must be directed toward the immediate reduction of BP to
reduce the hypertensive damage to the target organs, but not at a rate likely
to cause hypo perfusion of vital organs by an excessively rapid reduction of BP
(mainly cerebral hypo perfusion with neurological sequelae)
[47]. In such situations, the BP should be reduced by more
than 25% of the planned reduction over the first 8 hours, with the remainder of
the planned reduction over the next 12 to 24 hours. The ultimate short-term BP
goal in such patients should generally be around the 95th percentile. Appendix
IVlists suggested doses for oral and intravenous antihypertensive medications
that may treat patients with acute severe HTN[44].
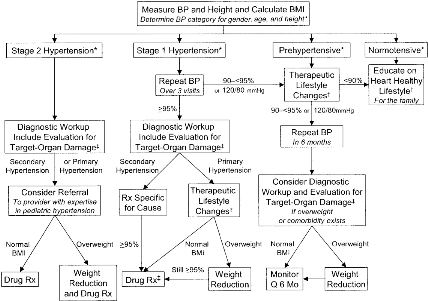
Figure 9: Management
algorithm[19]
Rx indicates prescription; Q, every; †, diet
modification and physical activity; ‡,especially if younger, very high BP,
little or no family history, diabetic, or other risk factors.
Source:- National High Blood Pressure
Education Program Working Group on High Blood Pressure in Children and
Adolescents. The fourth report on the diagnosis, evaluation, and treatment of
high blood pressure in children and adolescents. Pediatrics. 2004 Aug; 114(2
Suppl 4th Report):555-76.
VI.1.9COMPLICATIONS
i. Cardiac complications
A pulmonary oedema with asystolia can brutally
decompensate a moderate left ventricular overload in a newborn. It appears
sometimes that the blood could be within normal limits or low controlled,
rising after a reduction of the heart failure[43]. Signs and
symptoms of target organ damage are present only in the late stages of the
disease. Left ventricular hypertrophy (LVH) is the most common target organ
abnormality found in childhood[58]. LVH is present in 34 to
38% of children with mild, untreated hypertension[58,59].
Paediatric patients with established LVH is an indicator to initiate or
intensify antihypertensive therapy[41,58]
ii. Vascular complications
The vascular repercussion is potentially severe due to the
risk of vascular rupture: intracerebral rupture in case of cerebral
arteriovenous malformations, retinal haemorrhage (dramatic functionally)
oraortic dissecting aneurysm. There are otherwise certain vasomotor phenomena
which can aggravate a cerebral or renal ischemia[60].
iii. Neurologic complications
Seizures can be rebel to anticonvulsants if HTN
isn'tcontrolled. A cerebral haemorrhage sometimes massive, could be associated
to hemiplegia or a cortical blindness, an intra-ventricular haemorrhage in the
premature newborn, and a cerebral oedema responsible for an intracranial
hypertension complicated in severe cases by a hypertensive
encephalopathy[43].
iv. Renal complications
Every severe HTN leads to lesions of
nephro-angiosclerosis: necrosis of the afferent arteriole, glomerular
hyalinisation. These lesions could lead to a kidney failure, prone to
regression, at least a little, after control of HTN. Exceptionally in children,
certain malignant HTN with nephro-angiosclerosis lead to a haemolytic and
uremic syndrome with a rapidly irreversible kidney
failure[60].
v. Ocular complications
They are quite rare but severe: finite blindness
following retinal haemorrhage,retinal detachment or optic atrophy secondary to
a papillary oedema. The severity of lesions seen on fundoscopy is not linked to
the oldness of the HTN nor the existence of any other visceral
anomaly[61].
VI.2 REVIEW OF PUBLICATIONS ONHYPERTENSION IN
CHILDREN
Several studies have been carried out worldwide to determine
blood pressure profile and their risk factors in children.
v Out of Africa
· In 2004, Sorof et al screened 5102 children in the
U.S.A aged 13-17years in 4ethnic distributions(white 44%,Hispanic 25%, African
American 22%, and Asian 7%). The prevalence of HTN after the first, second and
third screenings was 19.4%, 9.5%, and 4.5%.Overall, overweight prevalence was
significantly associated, with significant variations between the ethnic
distributions.They however, noted that the ethnic differences in the prevalence
of hypertension were not significant after controlling for
overweight[62].
· In 2004, Moura et al used the cross sectional
methodology on 1253 children aged 7-17years in Brazil and observed a prevalence
of HTN of 9.4%. They noticed blood pressure was significantly associated with
overweight and obesity. However, no statistical differences were observed
between males and females with regards to the prevalence of elevated blood
pressure [63].
· In the U.S.A, Urrutia-Rojas et al in 2006 carried out a
school based cross sectional study to determine the prevalence and associated
factors of HTN on 1066 children aged 8-13years. They noted a 20.6% prevalence
of HTN and HTN was significantlyassociated with overweight and obesity as well
as African Americans which were more likely to have HTN than
Caucasians[8].
· In 2010, Sharma et al in India, carried out a cross
sectional study and screened 1085 school children aged 11-17years for HTN and
found a prevalence of 5.9% HTN and 12.3% Prehypertension after 2 evaluations.
In their study, prevalence of HTN in obese children was 46.5% and 17% in
non-obese; urban and rural children had comparable rate of elevated
BP-[64].
· In China, Xi Lu et al in 2013, carried out a
school-based cross sectional study on 78,114 children and adolescents. In their
study, both SBP and DBP were significantly increased in overweight and obese
groups; and the prevalence of high SBP, DBP and hypertension(ranges from 8 to
26%) were markedly higher among overweight and obese children than normal
weight groups[46].
· Flavio et al in 2016 in Brazil, conducted an
observational cross sectional study on a sample of 157 students from the city
of Petropolis aged from 10 to 19 selected randomly. In their study, the
prevalence of HTN was 10.8% and there was a significant association with
overweight and obesity as well as with the pressure of family history of
hypertension[65].
· Nihaz et al in 2016 in India, carried out a cross
sectional study on 1610 school children aged 5-10years from 6 schools of rural
urban regions; and found a prevalence of HTN of 4.5% and pre-HTN of 5.8%. In
their study, urban school children with hypertension were 7.52% against rural
were 1-2%, pre hypertension in urban school children were 9.4% ,rural 1.84%
Hypertension in males were 4.31% and in females were 4.65%. They also noted, a
strong association between childhood obesity, family history of diabetes
mellitus, ischemic heart disease and cerebrovascular accident; and
childhoodhypertension[66].
· In 2017, Yide Yang et al in China, carriedout a
national cross sectional survey on 62, 168 participants aged 6- 17years with
complete data of body weight, height, and blood pressure; and found a
prevalence of HTN of 10.2% and 8.9% for boys and girls, respectively. In their
study, isolated systolic high blood pressure is the dominant high blood
pressure subtype among Chinese boys aged 6-17 years and girls aged 12-17 years,
while isolated diastolic high blood pressure was the most common high blood
pressure subtype in girls aged 6-11 years; and boys with adiposity showed a
higher risk of high blood pressure than their female
counterpart[67].
· Espinosa et al in 2017 in Spain conducted a cross
sectional study including a sample of 1,604 schoolchildren aged 4- 6 years
belonging to 21schools from the provinces of Ciudad Real and Cuenca, Spain. The
results show estimates of prevalence of HTN and prehypertension being 18.2% and
12.3% respectively, and was significantly associated to high levels of
adiposity-[68].
v In Africa
· In South Africa in 2005, Monyeki et al carried out a
longitudinal study to assess association of fat patterning with blood pressure
in children aged 6-13years. They noted that the prevalence of HTN ranged from 1
to 5.8% and 3.1 to 11.4% for girls. A significant association between high
diastolic BP and high BMI was noted, while children with low BMIs were less
likely to be hypertensive[38].
· Harrabi et al in 2006, carried out a cross sectional
study on 1559 children aged 5-15years in Tunisia. They noted 9.6% prevalence of
HTN with no significant difference in prevalence between boys (9.2%) and girls
(9.9%). Boys had higher mean SBP compared to girls. In both boys and girls,
systolic pressure had a highly significant positive correlation with the
height, weight, and triglyceride
concentration-'''''''''''''''-[11].
· In Nigeria, Okoh et al in 2012, conducted a cross
sectional study to evaluate the prevalence and severity of HTN in 1302 school
children aged 6-12years. The prevalence of HTN was 4.7% and prehypertension was
4.6%. Prevalence of HTN was higher on females and a high BMI was significantly
associated with HTN[23].
· In Congo, Ellenga et al in 2014 conducted a cross
sectional study to determine the prevalence and associated risk factors of
pre-HTN and HTN in school children at Brazzaville in Congo, where they screened
603 children and noted a prevalence of 10.1% during the first screening and
3.3% in the second screening for HTN;and 20.7% for prehypertension.Obesity and
overweight as well the high economic level are greatly associated with HTN in
this population'-[6].
· In 2015, Juliana et al in South Africa, conducted a
study which utilized data from the Birth to Twenty cohort, which comprised a
sample of 3273 children born in Soweto, Johannesburg in 1990.In this study, the
overall point prevalence ranged from 9.2 to 16.4% for prehypertension and 8.4
to 24.4% for hypertension which showed a high prevalence of HTN which tracks
from early childhood into
adolescence - - [69].
· In 2017, Umar et al in Nigeria, carried out a
multistage sampling technique which was used to select 2000 pupils from 66
primary schools in Kano aged 6-14years. This study showed a prevalence of HTN
of 3%, higher in females as compared to males with a positive significant
correlation with the body mass index-[70].
v In Cameroon
· Fotso in 2012, conducted a cross sectional study on 628
school children aged 7-19years in Yaounde. She noted that BP was high in 1 out
of every 6 children with a prevalence of HTN of 2.2%. The mean SBP and DBP were
112#177;14mmHg and 69.7#177;10mmHg
respectively'''''''''''''''''''''''`'''''''''''''[25].
· In 2014, Bissohong carried out a
prospective-descriptive study from Sept 2014 to May 2015 on 769 school children
aged 4-18years in Bertoua. The prevalence of HTN was 2.9% and was more
prevalent in males than in females. Mean SBP and DBP were 106.8mmHg and
68.4mmHg respectively'''''''''''''''''''''''''''''''[24].
· Samain in 2015,carried out a community-based cross
sectional study on 1313 primary school children aged 5-15years in Buea. The
prevalence of hypertension was 3.2% and that of prehypertension was 7.6%. 3.5%
of males and 2.9% of females were hypertensive. Hypertension was significantly
associated with obesity. There was no significant association between
hypertension and family history of hypertension and hypertension was of
systolic predominance[26].
CHAPTER
Vii: MATERIALS AND METHODS
VII.1 STUDY DESIGN
The study is a school-based cross-sectional analytic study.
VII.2 STUDY AREA
The study was carried out in public and private primary
schools in the Mbankomo subdivision, in the Centre Region of Cameroon. Cameroon
is divided into 10regions: Far North, North, Adamawa, Centre, Littoral, East,
West, South, South West and North West Regions. The Centre which is our region
of interest has Yaounde as capital. Mefou and Akono whichis one of its
divisions covers an area of 1,329km2 and had a population of
57,051inhabitants in 2001(according to the 2004 Cameroon statistical annual).
It is made of 4subdivions: Akono, Bikok, Ngoumou and Mbankomo, with the latter
being our area of interest. Mbankomo has a population of 20,305inhabitants and
a surface area of 1,300 km2.
The Mbankomo subdivision has a total of 71 primary schools(31
public schools and 40 private schools) with a total of 10,308 pupils in all her
primary schools: 6,006 in public schools and 4,302 in private schools. A sample
was thereby derived from these schools using a cluster sampling method.
VII.3 STUDY PERIOD
The study was carried out over a period of six months
(21thNovember 2017 - 22thMay 2018).
VII.3.1 STUDY POPULATION
a) Target population
Primary school children inMbankomo subdivision found in
theMefou and Akono division, Centre Region.
b) Sample Size Calculation
The sample size was calculated using the Cochran's formula for
sample size for one proportion of a finite population. For that we
used[71];
Sample size(n) = 
Where;
n= Minimum sample size required
p= Prevalence of hypertension in primary
school children.
d= Error margin of 1-5%
(Z1-á/2)2
=95% confidence interval (value type=1.96)
Considering;
p= Prevalence of hypertension in primary
school children of 3.2% in the study of Samain Nkendo (in primary school
children in Buea) [26].
d= 2% error margin
Arithmetic calculation;
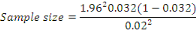
N=298pupils
Considering;
Imponderables (filling errors, absences..etc) n'=10% n= 0.1 x
298= 29.8
Total Minimum sample sizeN= 298 + 30 = 328 pupils
Using this approach, the minimum sample size was 298 pupils.
Considering 10% missing data, 328 pupils were initially targeted.
c) Sampling Method
A two staged cluster sampling technique wasused to select
participants.
The first stage consisted of conveniently selecting 13 primary
schools or clusters (18% of 71 primary schools in the study area) by
probability proportionate to size.
We used this method because the subdivision does not have the
same number of primary schools in the rural and semi-urban settings. It was
therefore, appropriate to consider the use of a random selection process where
the probability of inclusion of each cluster in the sample, tend to be
proportional to the size of the cluster.
This was done by listing all the schools (both public and
private) in the 2 settings(rural and semi urban) irrespective of the method
used for ordering them and, we sampled systematically as follows: The first
school was selected randomly by balloting and thereafter every 7th
school (Kth = 71/13) was selected until 13primary schools were
obtained, as seen below:
Table VII: Selected
primary schools for the study
|
School Setting
|
Type of school
|
Name of school
|
|
Rural
|
Public(8)
|
Ebeba Government primary school(266)
|
|
Zouatoupsi Government primary school (133)
|
|
Angon II Government primary school (79)
|
|
Nkolngok Government primary school (287)
|
|
Nomayos Government primary school (197)
|
|
Binguela Government primary school (179)
|
|
Eloumden II Government primary school (69)
Oveng Government primary school (187)
|
|
Private(0)
|
|
|
Semi urban
|
Public(2)
|
Mbalngong Government Bilingual primary school (358)
Mbankomo Government Bilingual primary school (501)
|
|
Private(3)
|
Parcours Des Doués Private Bilingual primary school
(154)
|
|
Prodige Plus Private Bilingual primary school (111)
|
|
Pfister Private Bilingual primary school (23)
|
In the second stage, our clusters were the 13 selected primary
schools. Since the number of pupils enrolled in each of the 13 schools selected
above were different, we used probability proportional to size to select
participants by randomly selecting (13%) pupils in each class enrolled in each
of the schools. This was done so that the final sample will proportionally
represent each of the classes, each primary school, as well as each school
setting.
|
Minimal sample size + expected loss (328) x 100
|
|
Total No of pupils enrolled in the 11 selected schools
(2,544)
|
Proportion of pupils in each school to be included in the study
(13%)
=
=
This was done as follows: The study was explained to the
pupils in each class (class 1-6) and verbal assent obtained. Thereafter a
minimum of 13%of the pupils in that class were selected by balloting.
d) Selection criteria
Inclusion Criteria
· Children enrolled in a primary school.
· Children present in school on days of recruitment.
· Children with signed consent form by parents or tutors
and who acceptedto participate in the study.
Exclusion Criteria
· Any child who because of a disability not permitting
weight, height, or blood pressure takings as recommended by the WHO.
· Children taking medication known to lower blood
pressure in whom a diagnosis of HTN has not been made.
VII.4 DATA COLLECTION
The self-administered section of the questionnaire was filled
by parents/guardians while the interviewer-administered section was filled by
the investigator.
The data collected consisted of:
- The socio-demographic characteristics of the child (age,
sex,type of school, class,school setting, milieu, profession and telephone
number of legal tutor)
- Socio economic status[which is an adapted classification
from therevisedKuppuswamy's socio-economic status scale- January
2015-[72](see APPENDIX IV)]where the projected family income
was estimated from the Gross National Income (GNI) per capital.
- Lifestyle(feeding habits, physical activities and
sedentarity)
- Medical record of the child (birth weight,term, chronic
illness)
- Medical record of Parents and other family members(family
history of hypertension, obesity or overweight,diabetes)
- Anthropometric measurements(height, weight, BMI)
- Blood pressure measurement
- Urine dipstick test
VII.5 STUDY PROCEDURE
Administrative and ethical approvals
A prior ethical clearance from the Ethical Committee of the
Faculty of Medicine and Biomedical Sciences of the University of Yaounde I was
obtained, as well as authorizations from the Divisional Delegation of Basic
Education at Ngoumou and the Sub Divisional Inspectorate of Basic Education at
Mbankomo. An informed note was addressed to the respective school authorities
to the chosen schools in order to obtain their authorizations.
A meeting was organized to prepare the investigators made up
of; a student nurse and a 7th year student to plan data collection,
as well as training sessions for anthropometric measurements.
Approach of Participants
The study involvedprimary school children and as such legally
could not give consent. After explanation of the study in each class, a verbal
and a written signed assent were obtainedfrom parents/guardians before
inclusion in the study. Among the pupils who accepted to be part of the study,
participants were selected by simple random sampling. Each of them was given a
consent form and a questionnaire (English or French) to take home for their
parents/guardian to fill and sign if they accepted that their children should
participate in the study. Information was collected only from those who
returned with signed consent form, correctly filled questionnaire and who also
gave verbal assent.
Blood Pressure Measurement
Blood pressure was measured and classified according to the
AAP (American Academy of Pediatrics) recommendations [44]. Before blood
pressure measurements, pupils were familiarized to the instrument and the
nature of the procedure was explained.
Blood pressure was measured in the sitting position on the
right arm using the auscultatory method with a pediatric stethoscope, and a
standard aneroid sphygmomanometer with appropriate cuff size covering at least
2/3rd (80%) of the upper arm and encircling it completely (at least
40%). The child's right arm was supported at the level of the heart during
measurements. This was the preferred arm because of consistency and comparison
to standard tables and also because of the probability of decreased BP on the
left arm caused by coarctation of the aorta.
The stethoscope was placed lightly over the brachial artery(if
pressed too firmly against the artery, it might cause turbulence and the
disappearance of sound, thus artificially reducing the diastolic pressure). The
cuff was inflated to a pressure of 30mmHg above the level at which the radial
pulse was no longer palpable. While slowly deflating the cuff (approximately
2-3mmHg per heartbeat), the Korotkoff phase I was listened while watching the
blood pressure gauge. Korotkoff phase I was identified by the first pulse
auscultated. The measurement was then recorded from the sphygmomanometer at
which the sound first appeared; representing the participant's systolic blood
pressure. While watching the sphygmomanometer, the cuff was continuously slowly
deflated till an abrupt soft, indistinct, muffling sound was heard (Korotkoff
phase IV). This sound was then continuously listened until it disappeared
completely (Korotkoff phase V) and recorded; this represented the participant's
diastolic blood pressure. The cuff was completely deflated and the child was
allowed to rest.
For each participant, BP was measured twice in the same visit
with a minimum of 30 seconds rest interval and the mean BP calculated. We
waited for another 1-2minutes and repeated the blood pressure measurement
procedure on the participant's opposite arm and if a measurement discrepancy
existed between the 2arms, then arm the highest measurement was noted. BP
readings were taken to the nearest 2mmhg. BP readings were classified according
to the recommendations of AAP as follows:
· Elevated BP if SBP and/or DBP were between
90th and 95th percentile for age, height and sex or if
SBP>120mmhg or DBP>80mmhg.
· Hypertensive if SBP and/or DBP were equal to or greater
than the 95th percentile for height, age and sex.
Participants who were hypertensive on the first visit were
rechecked (had a repeated BP measurement) 2 times at intervals of 1 week to
ensure persistent hypertension.The pupils diagnosed of hypertension underwent a
urine dipstick test for proteinuria.
Eachhypertensive pupil was referred to the Mbankomo district
hospital and a Pediatric Cardiologist for management and follow-up. At the end
of the study, a list of all the hypertensive pupils diagnosed and their
respective schools were sent to the Delegate of Basic Educationof the Mefou and
Akono division in Ngoumou as well as the findings from our study.
Anthropometric Measurements
Participants were weighed barefoot, standing still, without
support and wearing light clothes(removed shoes and heavy clothing, such as
sweaters) using a manual weighing scale and recorded in the nearest 0.1kg.
Height was measured using a wooden stadiometer calibrated in
centimeters (cm) and recorded in the nearest 0.1cm. Each participant stood
erect with no shoes on and with the occiput, shoulder, buttocks and calf
touching the vertical position of the stadiometer.
The readings were recorded on a corresponding data collection
sheet of each participant before going to the next. Weight and height were used
to determine BMI. Pupils were categorized by age and sex using WHO BMI growth
tables and charts(Appendix III).Pupils' heights were categorized to height
percentile using WHO height for age and sex standard tables and charts
(Appendix III).
Data was collected on a daily basis and recorded in a computer
progressively.
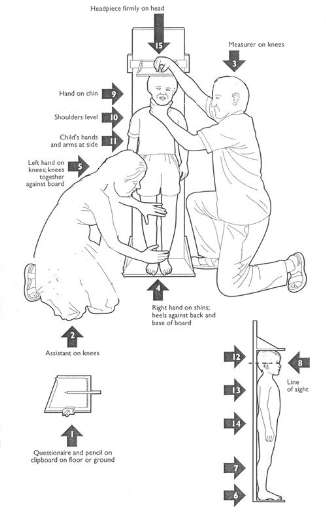
Figure 10: Measurement of the
height[73]
Source :The Mother and Child
Health and Education Trust. Taking the Weight-for-Height/Length -
Anthropometric Measurements Techniques - Diagnosis of Acute Malnutrition -
Mother, Infant and Young Child Nutrition & Malnutrition - Feeding practices
including micronutrient deficiencies prevention, control of wasting, stunting
and underweight [Internet]. 2017 [Cited 29 October 2017]. Available from:
http://motherchildnutrition.org/malnutrition-management/integrated-management/taking-the-weight-for-height-length.html
VII.6 MATERIALS
The materials for the study included:
· A data entry form with two sections (section one for
the parents' and child's medical records and section two for blood pressure and
anthropometric parameters).
· A paediatric stethoscope and paediatric aneroid
sphygmomanometer (GIMA*) with various cuff sizes appropriate for mid upper arm
circumference (< 8cm, 8-14cm, 14-21cm, >21cm).
· A measuring scale (Seca*).
· A wooden portable stadiometer (UNICEF) (calibrated in
centimeters).
· A laptop
· Microsoft® Office Excel 2013, SPSS standard
version(20.0) for windows, WHO Anthro Plus version 1.0.4and
Epi-infoTM version 3.5.4 software for data analysis and
Microsoft® Office Word 2013 as the input software
· A 4 GB flash disk
· Office equipments
VII.7 HUMAN RESOURCES
· Director: Professor OBAMA Marie
Therese
· Co-directors:Associate Professor CHELO
David,Associate Professor MAH Evelyn Mungyeh
· Investigator:CHIABI Edmond Ngong
· Collaborators: Trained personnel
· A statistician
VII.8 DATA ANALYSIS
The investigator was to note the collected data of each
patient on the pre-established work sheet(Appendix I) and typed it down in Epi
info 3.5.4, by making a view. Then, it was analysed using the Epi info 3.5.4and
anthropometric data was analysed using WHO Anthro version 3.2.2. The graphs
were produced with the use of Microsoft Excel 2013.
The quantitative variables were described using mean and
standard deviation while the qualitative variables were described using
frequencies and proportions.
Analysis were carried out to assess associations between each
variable.Correlation between quantitative variables was described using
Pearson's correlation coefficient (r).
Associations between qualitative variables weredescribed by
comparing proportions using Chi-Square test(when an expected value is >5)
and Fisher's exact test (when an expected value is <5). The force of
association wasevaluated using the Odd's ratio and statistical significance was
considered at P-value < 0.05.
VII.9 DATA MANAGEMENT
§ Definition of Variables
Ø Quantitative variables: Age, Number
of meals per day, fruit and vegetable consumption per week, sport practice
duration per week, weight, height, level of education of legal tutor, birth
weight.
· Television and/or computer
:<1hour,1-2hours, >2hours
· Sleeping time :<6hours, 6-8hours,
>8hours
· Blood pressure: The American form of
blood pressure presentation was adopted as follows:
- Normal blood pressure: BP< 90th percentile for
age, gender and height.
- Prehypertension: BP =90th and <95th
percentile
- Hypertension: BP =95th percentile
· BMI (according to WHO classification for
assessment of nutritional status)'-[6]
- Underweight: BMI <5th percentile
- Normal weight: BMI =5th and <85th
percentile
- Overweight: BMI =85th and <95th
percentile
- Obesity: BMI =95th percentile
· Proteinuria
- Trace (<30mg/dl)
- +1 (=30 - <100mg/dl)
- +2(=100-<300mg/dl)
- +3 (=300 - <1000mg/dl)
- +4 (=1000mg/dl)
· Adapted socio-economic status scale(Part
1)
- Monthly family income(FCFA) : =15,072 ;
15,073 - 45,217 ; 45,218 - 75,363 ; 75,364-113,045 ; 113,046 -
150,727 ; 150,728 - 301,454 ; =301,455
- Class : Low (<5), Middle (5-10),
High(>10)
Ø Qualitative variables
· Gender: Male and Female
· Type of school: public and private
· School setting: rural and semi
urban
· Profession of legal guardian: Student,
civil servant, private worker, informal, unemployed.
· Adding salt at table: Yes or No
· Fruit juice consumption: Occasionally
and Regularly
· Means of locomotion: by foot, by
vehicle
· School sports: Yes or No
· Extracurricular sports: Yes or No
· Term: At term and premature
· Family history of HTN/diabetes/Overweight or
obesity: Yes or No
· Urine dipstick test-blood: Yes or
No
· Adapted socio-economic status scale(Part
2)
- Profession of legal tutor :Skilled worker,
Unskilled worker, Unemployed
- Level of education of legal tutor:Higher
education, Secondary (2nd cycle), Secondary (1st cycle),
Primary, Illiterate
CHAPTER
VIII: RESULTS
VIII.1 STUDY FLOW PROFILE
For this study, 1,754 consent forms and questionnaires were
distributed to all the pupils enrolled in the 13 selected primary schools
(private and public) in Mbankomo subdivision.422 (34%) pupils were excluded
because of absence, poorly filled questionnaires and loss of follow up. Only
822 (66%) pupils were finally included in the study. The figure below
represents the flow diagram of the sample population.
1,754 consent forms and work sheets distributed
510(29%) pupils non-included
510 (29%) parents did not give their consent
1244(71%) consent given
199 (16%) poorlyfilledquestionnaires
186 (15%) pupils who failed to return form
422(34%) pupilsexcluded
37 (3%) pupils who were absent from school
822(66%) pupilsincluded in the study
Figure 11: Flow diagram of
the study
VIII.2 SOCIO-DEMOGRAPHIC CHARACTERISTICS OF STUDY
POPULATION
VIII.2.1 Pupil
VIII.2.1.iGender
Table VIII: Distribution of
pupils by gender
|
Gender
|
Frequency(n)
|
Percentage(%)
|
|
Male
|
353
|
42.9
|
|
Female
|
469
|
57.1
|
|
Total
|
822
|
100
|
Of the 822 pupils recruited, 469 (57.1%) were femalesand353
(42.9%) were males, giving a sex ratio of 1.3.
VIII.2.1.ii Age
Table IX: Distribution of
pupils by age
|
Age(in years)
|
Frequency(n)
|
Percentage (%)
|
|
[5-8[
|
268
|
32.6
|
|
[8-11[
|
338
|
41.1
|
|
[11-14[
|
193
|
23.5
|
|
[14-18[
|
23
|
2.8
|
|
Total
|
822
|
100
|
The mean age was 9 #177; 2.5 years (with extremes from 5 to
17years). The most represented age range was 8-10 years (41.1%), and was
followed by those aged 5-7 years (32.6%).
VIII.2.1.iii Type of school and school
setting
Table X: Distribution of
pupils by type of school and school setting
|
Frequency(n)
|
Percentage(%)
|
|
Type of school
|
|
Public
|
681
|
82.8
|
|
Private
|
141
|
17.2
|
|
School setting
|
|
Rural
|
356
|
43.3
|
|
Semi urban
|
466
|
56.7
|
In this study, 681 (82.8%) pupils were from public schools and
141 (17.2%) pupils were from private schools.
A total of 466 (56.7%) pupils were from a semi urban setting
and 356 (43.3%) pupils were from a rural setting.
VIII.2.1.iv Class
Table XI: Distribution of
pupils by class
|
Class
|
Frequency(n)
|
Percentage(%)
|
|
Class 1/Sil
|
126
|
15.3
|
|
Class 2/ CP
|
114
|
13.9
|
|
Class3/ CE1
|
125
|
15.2
|
|
Class4/ CE2
|
121
|
14.7
|
|
Class5/ CM1
|
150
|
18.3
|
|
Class6/ CM2
|
186
|
22.6
|
|
Total
|
822
|
100
|
The most represented classes were class 6 and class 5 in
respectively 22.6% and 18.2%.
VIII.2.2 Legal tutors
VIII.2.2.i Profession of legal tutors
Table XII: Distribution by
profession of legal tutor
|
Profession of legal tutor
|
Frequency(n)
|
Percentage(%)
|
|
Non liberal*
|
139
|
16.9
|
|
Liberal**
|
409
|
49.8
|
|
Unemployed
|
274
|
33.3
|
|
Total
|
822
|
100
|
*Civil servants
**Lawyers, traders, technicians, private sector, student,
retired
Most of the legal tutors were on liberal professions
(49.8%).
VIII.2.2.i Socio-economic status
Table XIII: Distribution by
socio-economic status (N=96)
|
Socio-economic status
|
Frequency(n)
|
Percentage(%)
|
|
Low
|
8
|
8.3
|
|
Middle
|
84
|
87.5
|
|
High
|
4
|
4.2
|
|
Total
|
96
|
100
|
Out of the 822 legal tutors who took part in the study, only
96 correctly filled the section of the socio-economic status and 84 (87.5%)
homes had the middle socio- economic status.
VIII.3 ANTHROPOMETRIC PARAMETERS OF STUDY
POPULATION
VIII.3.1 BMI classification of the study
population
Table XIV: BMI classification
ofthe study subjects
|
BMI
|
Frequency (n)
|
Percentage (%)
|
|
Normal weight
|
757
|
92.1
|
|
Underweight
|
5
|
0.6
|
|
Overweight
|
55
|
6.7
|
|
Obesity
|
5
|
0.6
|
|
Total
|
822
|
100.0
|
Out of the 822 pupils enrolled, 757 (92.1%) pupils had a normal
BMI; 55 (6.7%) pupils were overweight; and 5 (0.6%) pupils were obese.
VIII.3.2 Excess weight and age
Table XV: Distribution of
overweight/obesity by age range (N=60)
|
Age(years)\BMI
|
Overweight n(%)
|
Obesity n(%)
|
Total n(%)
|
|
[5-8[
|
25 (96.2)
|
1 (3.8)
|
26 (100)
|
|
[8-11[
|
17 (89.5)
|
2 (10.5)
|
19 (100)
|
|
[11-14[
|
12 (85.7)
|
2 (14.3)
|
14 (100)
|
|
[14-18[
|
1 (100)
|
0 (0)
|
1 (100)
|
Out of the 60 pupils who were overweight/obese, 45 were highly
represented in the age range of 5-10 years.
VIII.3.3 Excess weight and gender
Table XVI: Distribution of
overweight/obesity by gender (N=60)
|
Gender\BMI
|
Overweight n(%)
|
Obesityn(%)
|
Total n(%)
|
|
Male
|
23 (100)
|
0 (0)
|
23 (100)
|
|
Female
|
32 (86.5)
|
5 (13.5)
|
37 (100)
|
Out of the 60 pupils who had overweight/obesity, 37 were
female out of which 5 were obese.
VIII.4 PREVALENCE OF ELEVATED BP AND
HYPERTENSION

VIII.4.1Prevalence of Elevated BP and Hypertension
based on the AAP
Figure 12: Prevalence of
hypertension and Elevated BP on all 3 screenings
On the first screening, 55 (6.6%) pupils had an elevated BP
level and 67 (8.0%) pupils were found to be hypertensive. On the second
screening, one week after the first screening, 60 (7.3%) pupils had an elevated
BP level and 29 (3.5%) were hypertensive. On the third screening, one week
after the second screening, 67 (8.1%)pupils had an elevated BP level and 13
(1.6%) hypertensive.
VIII.4.2 Prevalence of Elevated BP and hypertension at
third screening
Table XVII: Prevalence of
Elevated BP and HTN(at third screening) (N=822)
|
Blood pressure status
|
Frequency(n)
|
Percentage(%)
|
|
Normal
|
742
|
90.3
|
|
Elevated BP
|
67
|
8.1
|
|
Hypertension
|
13
|
1.6
|
|
Stage 1
|
12
|
1.5
|
|
Stage 2
|
1
|
0.1
|
Out of the 13(1.6%) hypertensive pupils, 12 (1.5%) had stage one
hypertension and 1 (0.1%) had stage two hypertension.
VIII.4.3 Prevalence of Elevated BP and hypertension with
respect to systolic blood pressure (SBP) and diastolic blood
pressure(DBP)
Table XVIII: Prevalence of
elevated SBP and DBP
|
Blood pressurestatus
|
SBP n (%)
|
DBP n (%)
|
SBP +DBPn (%)
|
|
Normal
|
741 (90.1)
|
792 (96.4)
|
701
|
|
Elevated BP
|
68 (8.3)
|
26 (3.2)
|
3
|
|
Hypertension
|
13 (1.6)
|
4 (0.4)
|
8
|
The prevalence of elevated BP and HTN was
predominantlysystolic in 68 (1.6%) pupils and in 13 (1.6%) pupils
respectively.
VIII.4.4Distribution of Elevated BP and hypertension with
respect to socio-demographic characteristics and anthropometric
parameters
Table XIX: Prevalence of
Elevated BP and hypertension with respect socio-demographic characteristics and
anthropometric parameters
|
Characteristics
|
Normal n(%)
|
Elevated BP n(%)
|
Hypertension n(%)
|
Total n(%)
|
|
|
Age(years)
|
|
[5-8[
|
258(96.2)
|
10(3.7)
|
0(0)
|
268(100)
|
|
|
[8-11[
|
317(93.7)
|
18(5.3)
|
3(0.8)
|
338(100)
|
|
[11-14[
|
155(80.3)
|
31(16.0)
|
7(3.6)
|
193(100)
|
|
[14-18[
|
12(52.1)
|
8(34.7)
|
3(13.0)
|
23(100)
|
|
Gender
|
|
Male
|
323(91.5)
|
27(7.6)
|
3(0.8)
|
353(100)
|
|
|
Female
|
419(89.3)
|
40(8.5)
|
10(2.1)
|
469(100)
|
|
Type of school
|
|
Public
|
615(90.3)
|
54(7.9)
|
12(1.7)
|
681(100)
|
|
|
Private
|
127(90.0)
|
13(9.2)
|
1(0.7)
|
141(100)
|
|
School setting
|
|
Rural
|
321(90.1)
|
30(8.4)
|
5(1.4)
|
356(100)
|
|
|
Semi urban
|
421(90.3)
|
37(7.9)
|
8(1.7)
|
466(100)
|
|
BMI Status
|
|
Underweight
|
5(100)
|
0(0)
|
0(0)
|
5(100)
|
|
|
Normal weight
|
695(91.8)
|
55(7.2)
|
7(0.9)
|
757(100)
|
|
Overweight
|
41(74.5)
|
9(16.3)
|
5(9.0)
|
55(100)
|
|
Obesity
|
1(20)
|
3(60)
|
1(20)
|
5(100)
|
Hypertension was predominant in the age range 14-17 years in
13.0%, in females in 2.1%, in public schools in 1.7%, in semi urban in 1.7%,
and in obese in 20%.
VIII.4.5Correlation of systolic and diastolic blood
pressure withanthropometric parameters
Table XX: Correlation between
blood pressure and, age and BMI
|
Variables
|
SBP
|
DBP
|
|
Correlation
coefficient (r)
|
p-value
|
Correlation
coefficient (r)
|
p-value
|
|
Age
|
0.17**
|
0.000
|
0.07**
|
0.000
|
|
BMI
|
0.18**
|
0.000
|
0.11**
|
0.000
|
|
p-value from Pearson's correlation test
**Correlation is significant at the 0.01 level (2
tailed)
|
SBP(r=0.17; p=0.000) and DBP (r=0.07; p=0.000) statistically
increased with age (figures13 and 14 respectively).
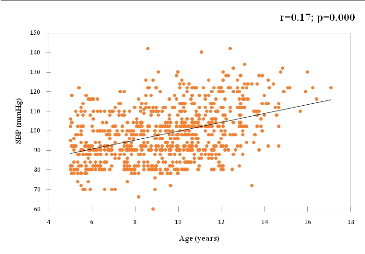
Also, the SBP (r=0.18; p=0.000) and DBP (r=0.11; p=0.000)
statistically increased withBMI (figures 14 and 15 respectively).
Figure 13 : Correlation
between SBP and age
Scattered plot diagram showing a positive correlation of SBP and
age (r=0.17; p=0.000).
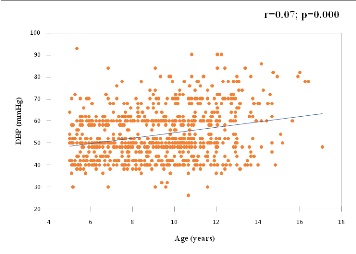
Figure 14: Correlation
between DBP and age
Scattered plot diagram showing a positive correlation of DBP with
age (r=0.07; p=0.000).
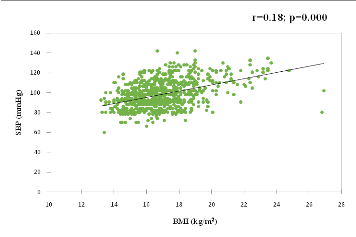
Figure 15: Correlation
between SBP and BMI
Scattered plot diagram showing a positive correlation of SBP with
BMI (r=0.18; p=0.000)
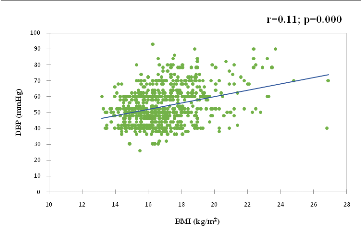
Figure 16: Correlation
between DBP and BMI
Scattered plot diagram showing a positive correlation of SBP with
BMI (r=0.11; p=0.000).
VIII.5URINE
VIII.5.1 Proteinuria
Out of the 13 hypertensive pupils who underwent the dipstick
urine test for proteinuria, 12 (92.3%) pupils had protein traces in urine and 1
(7.7%) pupil had a high protein count in urine.
VIII.5.2 Blood
Out of the 13 hypertensive pupils who underwent the dipstick
urine test for blood, none had blood found in the urine.
VIII.6 BIVARIATE ANALYSIS OF FACTORS ASSOCIATED TO
HYPERTENSION
VIII.6.1Socio-demographic status
Table XXI: Socio-demographic
status and hypertension
|
Hypertensive
n(%)
|
Non hypertensive
n(%)
|
Total
N
|
OR (CI 95%)
|
P-value*
|
|
Age(years)
|
|
=10
|
2 (0.4)
|
488 (99.6)
|
490
|
|
|
|
>10
|
11 (3.3)
|
321 (96.7)
|
332
|
8.36 (2.06-55.73)
|
0.000
|
|
Gender
|
|
Female
|
10 (2.1)
|
459 (97.9)
|
469
|
2.54 (0.73-11.54)
|
0.120
|
|
Male
|
3 (0.8)
|
350 (99.2)
|
353
|
|
|
|
School type
|
|
Public
|
5 (1.4)
|
351 (98.6)
|
356
|
0.82 (0.24-2.55)
|
0.480
|
|
Private
|
8 (1.7)
|
458 (98.3)
|
466
|
|
|
|
School setting
|
|
Rural
|
5 (1.4)
|
351 (98.6)
|
356
|
0.82 (0.24-2.55)
|
0.480
|
|
Semi urban
|
8 (1.7)
|
458 (98.3)
|
466
|
|
|
|
*p-value from Chi-square test
|
Among the socio demographic characteristics of the pupils
analysed, only the age (above10 years old) was a significantly associated
factor of hypertension (OR=8.36; CI95=2.06-55.73;
p=0.000). Gender had some association although not significant
(p=0.120).
VIII.6.2Socio-economic status
Table XXII: Socio-economic
status (N=96) and HTN
|
Hypertensive
n(%)
|
Non hypertensive
n(%)
|
Total
N
|
OR (CI 95%)
|
P-value*
|
|
Low
|
0 (0)
|
8 (100)
|
8
|
0 (0-30.62)
|
0.880
|
|
Middle/High
|
2 (2.3)
|
86 (97.7)
|
88
|
|
|
|
*p-value from Chi-square test
|
Out of 96 legal tutors who filled this section, the economic
status was not an associated factor of hypertension (OR=0;
CI95=0-30.62; p=0.880).
VIII.6.3Feeding habits
Table XXIII:Feeding habits
and HTN
|
Hypertensive
n(%)
|
Non hypertensive
n(%)
|
Total
N
|
OR (CI 95%)
|
P-value*
|
|
Salting
|
|
Yes
|
5 (2.4)
|
203 (97.6)
|
208
|
1.87 (0.55-5.83)
|
0.210
|
|
No
|
8 (1.3)
|
606 (98.7)
|
614
|
|
|
|
Fruit consumption
|
|
0
|
0 (0)
|
111 (100)
|
111
|
0 (0-1.65)
|
0.150
|
|
=1
|
13 (1.8)
|
698 (98.2)
|
711
|
|
|
|
Vegetable consumption
|
|
0
|
0 (0)
|
90 (100)
|
90
|
0 (0-2.11)
|
0.220
|
|
=1
|
13 (1.8)
|
719 (98.2)
|
732
|
|
|
|
Water consumption
|
|
=1liter Yes
|
10 (2.3)
|
428 (97.7)
|
438
|
2.97 (0.85-13.47)
|
0.070
|
|
No
|
3 (0.8)
|
381 (99.2)
|
384
|
|
|
|
>1liter Yes
|
3 (0.8)
|
366 (99.2)
|
369
|
0.36 (0.08-1.26)
|
0.090
|
|
No
|
10 (2.2)
|
443 (97.8)
|
453
|
|
|
|
Sweetened soft drinks (brewed juice)
consumption
|
|
Occasionally**
|
6 (1)
|
572 (99)
|
578
|
0.36 (0.11-1.11)
|
0.060
|
|
Regularly***
|
7 (2.9)
|
237 (97.1)
|
244
|
|
|
|
*p-value from Chi-square test
**<3days/week
*** =3days/week
|
Adding salt carried twice the risk but the association was not
significant (p=0.210) same as not drinking enough water carried 3times more
risk (p=0.070).
VIII.6.4Physical exercise and sedentarity
Table XXIV: Physical exercise
and sedentarity and HTN
|
Hypertensive
n(%)
|
Non hypertensive
n(%)
|
Total
N
|
OR(CI95%)
|
P-value*
|
|
Means of locomotion
|
|
On foot
|
10 (1.3)
|
746 (98.7)
|
756
|
|
|
|
By vehicle
|
3 (4.5)
|
63 (95.5)
|
66
|
3.55 (0.77-12.58)
|
0.080
|
|
Television/video games
|
|
None Yes
|
1 (2.1)
|
46 (97.9)
|
47
|
1.38 (0.06-8.25)
|
0.540
|
|
No
|
12 (1.5)
|
763 (98.5)
|
775
|
|
|
|
Watched =2hours
/played
|
9 (1.6)
|
548 (98.4)
|
557
|
1.07 (0.33-4.04)
|
0.590
|
|
>2hours
|
3 (1.4)
|
215 (98.6)
|
218
|
|
Sports
|
|
Yes
|
11 (1.5)
|
732 (98.5)
|
743
|
0.58 (0.14-3.91)
|
0.360
|
|
No
|
2 (2.5)
|
77 (97.5)
|
79
|
|
|
|
Sleeping period
|
|
=8hours
|
10 (1.9)
|
506 (98.1)
|
516
|
2 (0.57-9.07)
|
0.220
|
|
>8hours
|
3 (1)
|
301 (99)
|
304
|
|
|
|
*p-value from Chi-square test
|
Of all the elements of physical exercise and sedentarity
analysed, sports wasn't protective against HTN although not significant
(p=0.360), while moving in a car and sleeping for =8hours carry relative risks
although not significant (p=0.080 and p=0.220, respectively).
VIII.6.5Past history
Table XXV: Past history and
HTN
|
Hypertensive
n(%)
|
Non hypertensive
n(%)
|
Total
N
|
OR (CI 95%)
|
P-value*
|
|
Birth weight(grams)
|
|
<2500
|
3 (13)
|
20 (87)
|
23
|
11.84 (2.43-44.13)
|
0.000
|
|
=2500
|
10 (1.3)
|
789 (98.7)
|
799
|
|
|
|
Maturity at birth
|
|
At term Yes
|
10 (1.3)
|
789 (98.7)
|
799
|
0.08 (0.02-0.41)
|
0.000
|
|
No
|
3 (13)
|
20 (87)
|
23
|
|
|
|
Prematurity Yes
|
3 (13)
|
20 (87)
|
23
|
11.84 (2.43-44.13)
|
0.000
|
|
No
|
10 (1.3)
|
789 (98.7)
|
799
|
|
|
|
Medical past history
|
|
Recurrent UTI Yes
|
2 (10)
|
18 (90)
|
20
|
7.99 (1.12-35)
|
0.040
|
|
No
|
11 (1.4)
|
791 (98.6)
|
802
|
|
|
|
Family past history
|
|
HTN in family Yes
|
8 (3.6)
|
212 (96.4)
|
220
|
4.51 (1.44-15.26)
|
0.010
|
|
No
|
5 (0.8)
|
597 (99.2)
|
602
|
|
|
|
Diabetes in family Yes
|
0 (0)
|
165 (100)
|
165
|
0 (0-1.02)
|
0.050
|
|
No
|
13 (2)
|
644 (98)
|
657
|
|
|
|
Overweight inYes
|
10 (4.9)
|
193 (95.1)
|
203
|
10.64 (3.04-48.29)
|
0.000
|
|
family No
|
3 (0.5)
|
616 (99.5)
|
619
|
|
|
|
*p-value from Chi-square test
|
Of all the variables of the pupil's past history analysed, the
birth weight <2500(OR=11.84; CI95=2.43-44.13;
p=0.000), the preterm delivery (OR=11.84;
CI95=2.43-44.13; p=0.000), the recurrent UTI
(OR=7.99; CI95=1.12-35; p=0.040), HTN in family
(OR=4.51; CI95=1.44-15.26; p=0.010) and overweight
in family (OR=10.64; CI95=3.04-48.29; p=0.000)were
risk factors of hypertension. Meanwhile, born at term(OR=0.08;
CI95=0.02-0.41; p=0.000)was a protecting factor.
VIII.6.6BMI status
Table XXVI: BMI status and
HTN
|
Hypertensive
n(%)
|
Non hypertensive
n(%)
|
Total
N
|
OR (CI 95%)
|
P-value*
|
|
Normal weight
|
7 (0.9)
|
750 (99.1)
|
757
|
|
|
|
Excess weight**
|
6 (10)
|
54 (90)
|
60
|
11.98 (3.64-37.96)
|
0.000
|
|
*p-value from Chi-square test
**Overweight and obesity
|
Excess weight (overweight and obesity) was an associated
factor of hypertension (OR=11.98; CI95=3.64-37.96;
p=0.000).
VIII.7MULTIVARIATE ANALYSIS OF FACTORS ASSOCIATED OF
HYPERTENSION
Table XXVII: Multivariate
analysis with logistic regression
|
Variables
|
Odds Ratio
|
C.I 95%
|
P-Value
|
|
Age >10 years
|
6.4614
|
1.2581 - 33.1841
|
0.0254
|
|
Birth weight <2500grams
|
4.1894
|
0.0575 - 305.4815
|
0.5127
|
|
At term
|
0.0845
|
0.0216 - 0.3307
|
0.0004
|
|
Prematurity
|
1.578
|
0.0216 - 115.3462
|
0.835
|
|
Recurrent urinary tract infection
|
3.7988
|
0.4371 - 33.0119
|
0.2263
|
|
HTN in family
|
1.1318
|
0.2845 - 4.5025
|
0.8605
|
|
Overweight in family
|
7.4624
|
1.6906 - 32.9401
|
0.008
|
|
Excess weight*
|
10.1069
|
2.5094 - 40.7063
|
0.0011
|
*Overweight and obesity
Out of the factors that were significant in bivariate
analysis, the pupil's age>10 years old(OR=6.4614;
CI95=1.2581 - 33.1841; p=0.0254), overweight in
family (OR=7.4624; CI95=1.6906 - 32.9401; p=0.008)
and excess weight (OR=10.1069; CI95=2.5094 -
40.7063; p=0.0011)persisted as risk factors of hypertension after
multivariate analysis with logistic regression; and born at
term(OR=0.0845; CI95=0.0216 - 0.3307; p=0.0004)
persisted asa protecting factor.
CHAPTER
IX: Discussion
The study was a school-based cross-sectional analytic study
carried out in 13 primary schools in Mbankomo subdivision found in theMefou and
Akono division, Centre Region. A total of 822 children were enrolled using a
two stage cluster sampling method. The study was carried out to determine the
prevalence hypertension and its associated factors in primary school children
in Mbankomo subdivision.
DIFFICULTIES OF THE STUDY
Even though the analysis carried out permitted us to
determine the prevalence of hypertension, as well as the associated factors, we
were confronted with some difficulties in the field. They include: refusal to
participate in the study, poorly filled questionnaires, and absence from school
on the days the BP and anthropometric measurements were to be taken.
LIMITS OF THE STUDY
The fact that we did not carry out urine dipstick test on all
the pupils limited analysis on renal involvement in HTN.
The majority of legal tutors (88%) refused to give elements of
their socioeconomic status, limiting its association with HTN in study.
IX .1CHARACTERISTICS OF THE STUDY POPULATION
There was a female predominance (57.1%) with a sex ratio of
1.3. This female predominance was equally described by Bissohong (54%) in
Bertoua'''''''''''''''''''''''''''''''[24], Fotso(52%) in
Yaounde '''''''''''''''''''''''`'''''''''''''[25]and Sadoh et
al in Nigeria in 2014 (51.1%) -[74]. This predominance
reflects that of the general population [75]. On the other
hand, Samain in Buea (50.9%)[26], and Maj et al in India (56%)
[76] found a male predominance.
The mean age of the pupils was 9 years with extremes of 5 and
17 years, and the most represented age group was 8-10 years. This age group is
similar to that found by Samain[26], which corresponds to
primary school age.
We found that, 82.8% of the pupils were from public schools,
and 17.2% from private schools. This could be attributed to the fact that there
are fewer private schools compared to public schools in the study area. This
finding was equally noted by Bissohong in
Bertoua'''''''''''''''''''''''''''''''[24](61% public vs 39%
private), and Sadoh et al 2014 (54.9% public vs 45.1% private)
-[74]. This was not the case in the study carried out by
Samain in Buea (46.1% public vs 53.9% private) [26].
In this study, the pupils were predominantly from the semi
urban setting (56.7%). This could be explained by the high number of parents
from the rural setting who refused to participate in the study due to their low
level of comprehension on its necessity, and the absence of many pupils from
school during data collection. This predominance was likewise in Nihaz et al's
study 2016 in India [66].
Considering the socioeconomic status, only 12% of the study
populationresponded with 87.5% being from a middle class household. It could be
that the few who responded were those who understood the importance of the
study.Our findings are in sharp contrast toBadawi et al in 2012 in
Egypt-[77] with 48% of pupils from a middle class homeswhile
Sadoh et al -[74] in Nigeria, noted more children from lower
class homes.
IX .2ANTHROPOMETRIC PARAMETERS
The BMI as recommended by the WHO was used to classify the
nutritional status in our study population, with excess weight known to be an
associated risk factor to cardiovascular diseases '-[6].Excess
weight was noted in 7.3% of the pupils (6.7% overweight and 0.6% obese). This
occurred predominantly within the 5- 7 years age group. This figure is lower
compared to findings made by other authors in Cameroon: 32.9%, 20.4% and 31% by
Mekone, Bissohong and Samain respectively[24, 26, 78]. This
figure is still lower compared to findings made by other African and chinese
authors -[49,70,79]. The gap of the prevalence of excess
weight between this study and other studies could be explained principally by
the fact that, our study was carried out mainly in rural and semi urban setting
where as the others carried out in urban settings: probably because of reduced
physical activity and overconsumption of processed and energy-dense foods.
IX .3PREVALENCE OF HYPERTENSION
The classification of BP levels in this study was done
according to the Guidelines of the American Academy of Pediatrics in 2017:
Following these guidelines, 90.3% of the pupils had a normal BP level, 8.1%
ofpupils had an elevated BP level and 1.6% hypertensive.This prevalence of HTN
was lower than the levels reported by Fotso in
2013'''''''''''''''''''''''`'''''''''''''[25], Bissohong in
2015'''''''''''''''''''''''''''''''[24], and Samain in 2016
[26]. Higher prevalences have equally been reported in other
African studies ranging from 3.5% to 10.8% (reported byFarah et al in 2014 in
Uganda, Frances et al in 2017 in Nigeria andMuhihi et al in 2018 in Tanzania
respectively) -[81-83]. Again, higher prevalences have also
been described by some authors around the world [8,84,85].
Kishorkumar et al carried out a study aimed at determining the prevalence of
HTN among 310 school children in a rural area of Tamil Nadu in India, and
showed a prevalence of HTN of 10% and preHTN of 14.2%[86]. The
difference between these prevalences and ours, could be attributed to the fact
that the sample sizes were lower than ours, the studies were carried out in
urban settings and the authors used the United States-based 2004 Task Force
Report Update and French Reference Criteria which all tend to overestimate the
BP.In the same light, genetic predisposition and sedentarity marked by more
obese children in other studies mightequally contribute to this prevalence
gap.However, a lower prevalence of 1% and 0.6% was determined by Adrogue et al
in 2001 and Goon et al in 2013 respectively -[87,88], which
could be due to the use of either an automated BP device which underestimates
DBP by about 2.1mmHg or the use of a different reference critera: Second Task
Force recommendation which underestimates BP.
In our study, HTN was predominantly systolic in a proportion
of 1.6% compared to 0.4% that was diastolic. Similar results were noted in
other studies[26,85,89]. This difference could be due to the
increase in the activation of the sympathetic nervous system due to stress
which elevated SBP of pupils in our study[80].This finding was
contrary to that observed by Bissohongwho reported diastolic predominance in a
proportion of 2.6% for elevated DBP and 0.9% for
elevatedSBP'''''''''''''''''''''''''''''''[24].
In our study population, the prevalence of HTN was higher
within the age range 14 - 17 years. Bhuvaneswar et al[90]and
many other studies noted high BP levels at preadolescence and adolescence
[8,85,89,91].This could be attributed to an increase in body
mass and gonadal hormones (testosterone, oestrogene and progesterone) in
pubertal period.
The prevalence of hypertension was slightly higher in females
10 (2.1%) than in males 3 (0.8%) in our study. A similar finding was noted by
Okoh et al in Nigeria in 2012 [23],Samain in 2016
[26].
The difference prevalences between the male and the female
gender could be due to the fact that, there is an increase in large artery
stiffness with age, and an onset of body fat mass deposition which starts
earlier in girls than in boys during prepuberty and puberty. However, the
changes over time in artery stiffness and fat deposition are such that no
gender differences are observed in postpuberty [92]. Whereas
Goon et al in 2013 [88],and Bissohong in 2015
'''''''''''''''''''''''''''''''[24],noted higher prevalences
in males.
The prevalence of HTN was higher among pupils attending public
schools with a proportion of 1.7% compared to 0.7% in those attending private
schools in our study. Samain in 2016[26]in Buea, equally
reported a high prevalence in public schools. This could be explained by public
schools authorities who less encouraged physical activities in our study.
However, some other studies found a higher prevalence in private
schools'''''''''''''''''''''''''''''''[24,84,86]. According to
Sarala et al [84], the high prevalence of hypertension in
private school children could be attributed to decreased physical
activity,change in nutritional habits and life style change.
In our study, HTN was reported to be more present in pupils
attending schools in a semi urban setting(1.7%) compared to those attending in
a rural setting(1.4%).Nihaz et al in 2016 in a study whose objective wasto
determine the prevalence of hypertension and risk factors amongschool children
in Kerala, India, demonstrated that the prevalence of combined hypertension and
pre-hypertension (BP>90th percentile) was high in the urban areas
(16.2%)compared to the rural areas (2.89%) [66]. This was
explained by the fact that, a middle to high economic status mostly found in
urban homes has got major effect on the nutritional status of pupils. The
decreased physical activity in children and adolescents have been related
mainly to, computer games, video games, internet gazing, television and movie
viewing, overemphasis on academic excellence, and increasing automated
transport [66,93].
Out of 13 pupils who were hypertensive, 20% were obese, and
9.0% were overweight. Muhihi et al in Tanzania[83] found that,
52.2% of the children were obese and 27.3% were overweight. It has been shown
that excess weight during childhood is a risk factor for systolic hypertension,
dyslipidemia, and insulin resistance, suggesting that reduction of the
excessive rate of weight gain may exert beneficial effects on blood
pressure[66,94,95].
We noted in this study that, SBP and DBP significantly
increased with age. Previous reports confirmed this relationship
-[26,74]. Age-related increase in blood pressure is partly
attributable to increasing weight with age[83]. This positive
correlation could also be due to a progressively increased risk of occurring
secondary risk factors of elevated BP with age.
The SBP and DBP also,significantly increased with BMI in our
study. Other studies observed a similar finding with a significant
correlationof BMI with SBP and
DBP-'''''''''''''''''''''''`''''''''''''''''''''''''''''''''''''''''''''-[24-26,74,96].
The correlation between BP and BMI in children may highlight the development of
metabolic syndrome[83].
IX .4FACTORS ASSOCIATED TO HTN
On bivariate analysis, the characteristics which had a
statistically significant influence on HTN were; the age, the birth weight, the
term, the past medical history of recurrent UTI, family history of HTN and
overweight, and excess weight.
In multivariate analysis, the independent factors associated
with HTN were; the pupil's age>10 years old,family history of overweight,
andexcess weight. On the other hand,being born at termwas protective.
In our study, pupils older than 10 years were strongly
associated to hypertension (p=0.0254). This result is similar
to that reported by certain authors notably Bissohong in 2015 in
Bertoua'''''''''''''''''''''''''''''''[24]. Juliana et al in
2015 reported that the majority of hypertensive cases were preadolescents and
adolescents
(p<0.001) - - [69].
In Muhihi et al's study in 2018 in Tanzania, the prevalence of elevated BP was
higher among children aged more than 10 years compared to those aged 10 years
or less (p = 0.0029)[83]. This can be explained by the
observed trend of increasing blood pressure with increase in body size,probable
secondary risk factors, weight and sexual maturity which tends to occur with
increasing age'''''''''''''''''''''''''''''''[82].
The family history of overweight was strongly associated to
HTN in our study(p=0.008). This was not the case in Bissohong's study, which
showed no statistically significant association
'''''''''''''''''''''''''''''''[24]. According to Kanciruk et
al, family history of obesity can be considered to be both environmental and
biological in nature[97]. In terms of environmental risk,
parents, in particular mothers, tend to ingrain their personal eating habits as
well as their perceptions of weight to their children and, in terms of its
biological nature, the genetic influence of overweight/obesity may predispose
children to developing this condition. This condition is known to be a
precursor of cardiovascular diseases and particularly in HTN.
The present study observed that, the pupils who had excess
weight (overweight and obesity) had a higher prevalence of HTN compared to
those who didn't have (10% vs 0.9% respectively). We also noted a statistically
significant association between excess weight and HTN (p=0.0011). This finding
was consistent with that of Samain(p=0.000)[26], Bissohong
(p=0.02) '''''''''''''''''''''''''''''''[24], and Arun et al
(p=0.001) [91]. This association could be attributable to over
activation of the renin-angiotensin and sympathetic nervous systems; insulin
resistance; and abnormality in vascular structure and function observed in
obese children [94].
Pupils born at term were less likely to be
hypertensive. In fact, delivery at term was protective of HTN
(p=0.0004). Most studies indicated prematurity as a risk factor of HTN
[98,99].The mechanisms by which BP levels appear to be
elevated in children and young adults who were preterm are not fully
understood. The possible contributing factors include impaired morphological
development of glomeruli and fewer nephrons on the basis of interrupted kidney
development resulting in small kidneys, microvascular growth arrest and
rarefaction building up peripheral vascular resistance [99].
We want to note the subjective nature of reporting of term and preterm delivery
because we did not have access to the hospital delivery notes of the pupils
from their legal tutors. We could not find any study associating birth at term
with HTN.
CHAPTER
X: conclusion and recommendations
X.1 CONCLUSION
At the end of our study, we can say that our different objectives
have been attained. We can then draw the following conclusions:
· The mean age of the pupils enrolled in the study was
9years (extremes from 5-17years) and the most represented age range was 8-10
years (41.1%). Females were mostly represented in 57.1% giving a sex ratio of
1.3. Pupils mostly attended public schools in 82.8% and were mostly from a semi
urban setting in 56.7%. The most represented class was class 6 in 22.6%. Most
legal tutors carried out liberal professions (49.8%) and the most represented
socio economic status was that of the middle class in 87.5%.
· The prevalence of hypertension was 1.6% (with 1.5% in
stage I and 0.1% in stage II) and that of elevated BP was 8.1%. Hypertension
was predominantly systolic in 1.6% anddiastolic in 0.4%. There was a positive
correlation between age, BMI, and blood pressure.
· After multivariate analysis with logistic regression,
only the age> 10years, family history of overweight,excess weight persisted
as risk factors of HTN and born at term a protecting factor.
X.2 RECOMMENDATIONS
We will therefore make the following recommendations:
Ø School Authorities
· Reinforce nutrition and physical education in the
school curricular.
Ø Medical Staff
· Integrate blood pressure monitoring in children as part
of routine examination during routine health/sick medical visits.
Ø Parents
· Encourage healthy eating habits, manual labour and
ensure physical activity at home.
CHAPTER
XI: REFERENCES
1. World Health Organization. Global brief on hypertension
[Internet]. 2013 [Cited 2017 July 24]. Available from: www.who.int
2. Giacomo DS, Bucher BS, Tschumi S. Hypertension chez
l'enfant et l'adolescent. Rev Méd Suisse.2011; 7: 1041-2.
3. Tej KM, Stapleton FB, Kim SM. Definition and diagnosis of
hypertension in children and adolescents [Internet]. Uptodate. 2011 [Cited 2017
March 24]. Available from:
http://cursoenarm.net/UPTODATE/contents/mobipreview.html
4. Rahimi K, Emdin CA, MacMahonS. The Epidemiology of Blood
Pressure and Its Worldwide Management. Circ Res. 2015 Mar 13; 116(6):925-36
5. Verma M, Chhatwal J, George SM.Obesity and hypertension in
children. Indian Pediatrics. 1994 Sep; 31(9):1065-9.
6. Ellenga MBF, Okoko AR, Mabiala Babela JR, Ekouya Bowassa
G, Gombet TR, Kimbally-Kaky SG. Prehypertension and Hypertension among
Schoolchildren in Brazzaville, Congo. Int J Hypertens. 2014; 2014: 803690.
7. Feber J, Ahmed M. Hypertension in children: new trends and
challenges. Clin Sci. 2010;119(4):151-61.
8. Urrutia-Rojas X, Egbuchunam CU, Bae S, Menchaca J, Bayona
M, Rivers PA, et al. High blood pressure in school children: prevalence and
risk factors. BMC Pediatrics. 2006; 6(1):32.
9. World Health Organization. Causes of death 2008: data sources
and methods [Internet]. 2011 [Cited 2017 March 13]. Available from:
www.who.int/healthinfo/global_burden_disease/cod_2008_sources_methods.pdf
10. Lim SS, Theo V, Flaxman AD, Goodarz D, Shibuya K,
Adair-Rohani H, et al . A comparative risk assessment of burden of disease and
injury attributable to 67 risk factors and risk factor clusters in 21 regions,
1990-2010: a systematic analysis for the Global Burden of Disease Study 2010.
Lancet. 2012 Dec 15; 380(9859): 2224-60.
11. Harrabi I, Belarbia A, Gaha R, Essoussi AS, Ghannem H.
Epidemiology of hypertension among a population of school children in Sousse,
Tunisia. Can J Cardiol. 2006Mar;22(3):212-6.
12. Pinto A, Roldan R, Sollecito TP. Hypertension in
Children: An Overview. J Dent Educ. 2006 Jan;70(4):434-40.
13. Lo JC, Sinaiko A, Chandra M, Daley MF, Greenspan LC, Parker
ED, et al. Prehypertension and Hypertension in Community-Based Pediatric
Practice. Pediatrics. 2013 Feb;131(2):415.
14. Gupta-Malhotra M, Banker A, Shete S, Hashmi SS, Tyson JE,
Barratt MS, et al. Essential Hypertension vs. Secondary Hypertension Among
Children. Am J Hypertens.2015Jan;28(1):73.
15. Luma GB, Roseann TS. Hypertension in Children and
Adolescents - Am Fam Physician. Am Fam Physician. 2006 May;73(9):1558-68.
16. Riley M, Bluhm B. High Blood Pressure in Children and
Adolescents. Am Fam Physician. 2012Apr;85(7):693-700.
17. Patel N, Walker N. Clinical assessment of hypertension in
children. Clinical Hypertension. 2016; 22:15
18. Singh D, Akingbola O, Yosypiv I, El-Dahr S. Emergency
Management of Hypertension in Children. Int J Nephrol. 2012; 2012:1-15.
19. National High Blood Pressure Education Program Working
Group on High Blood Pressure in Children and Adolescents. The fourth report on
the diagnosis, evaluation, and treatment of high blood pressure in children and
adolescents. Pediatrics. 2004 Aug; 114(2 Suppl 4th Report):555-76.
20. Amritanshu K, Kumar A, Pathak A, Neha G, Banerjee DP.
Prevalence and risk factors associated with hypertension in children and
adolescents. Pediatric Oncall Journal. Apr-Jun 2015; 12: 2.
21. Salman Z, Kirk GD, DeBoer MD. High Rate of
Obesity-Associated Hypertension among Primary Schoolchildren in Sudan. Int J
Hypertens. 2010 Dec; 2011:629492.
22. Ugwuja EI, Ezenkwa US, Nwibo AN, Ogbanshi M, Idoko O,
Nnabu R. Prevalence and determinants of hypertension in an agrarian rural
community in Southeast Nigeria. Ann Med Health Sci Res. 2015Jan;5(1):45.
23. Okoh BA, Alikor EA, Akani N. Prevalence of hypertension
in primary school-children in Port Harcourt, Nigeria. Paediatr Int Child
Health. 2012 Nov;32(4):208-12.
24. Bissohong K. Profil Tensionnel des Enfants et Adolescents
en milieu Scolaire dans la Ville de Bertoua[Memoire]. Universite de Yaounde I;
2014.
25. Fotso T. Etude de la Relation entre le Profil Ponderal et
le Profil tensionnel dans une population scolaire de la vile de Yaounde
[Thesis]. Universite Des Montagnes; 2012.
26. Samain NC. Prevalence and Risk Factors of Hypertension in
Primary School Children in Buea Health District[Thesis]. University Of Buea;
2015.
27. WHO/ISH. 1993 guidelines for the management of mild
hypertension: memorandum from a WHO/ISH meeting. Bull World Health Organ.
1993;71(5):503-17.
28. Inter-Agency and, Expert Group on SDG Indicators
(IAEG-SDGs). SDG Indicators -- SDG Indicators [Internet]. 2017 [Cited 2017 June
01]. Available from: https://unstats.un.org/sdgs/iaeg-sdgs/
29. WHO. WHO | WORLD HEALTH REPORT 2002 [Internet]. 2002
[Cited 2017 June 01]. Available from:
http://www.who.int/whr/2002/en/whr02_en.pdf
30. WHO. HEALTH FOR THE WORLD'S ADOLSCENTS-A second chance in
the second decade [Internet]. 2014 [Cited 2017 November 08]. Available from:
http://www.who.int/maternal_child_adolescent/documents/second-decade/en/
31. UNICEF. UNICEF - The State of the World's Children:
Special Edition Celebrating 20 Years of the Convention on the Rights of the
Child [Internet].2009 [Cited 2017 June 01]. Available from:
https://www.unicef.org/rightsite/sowc/fullreport.php
32. McNiece KL, Poffenbarger TS, Turner JL, Franco KD, Sorof JM,
Portman RJ. Prevalence of Hypertension and Pre-Hypertension among Adolescents.
J Pediatr. 2007Jun;150(6):640-644.e1.
33. Hansen ML, Gunn PW, Kaelber DC. Underdiagnosis of
Hypertension in Children and Adolescents. JAMA. 2007Aug;298(8):874.
34. Fallah Z, Djalalinia S, Qorbani M, Farzadfar F, Kelishadi
R. A Systematic Review of Studies on Blood Pressure in Iranian Pediatric
Population: First Report From the Middle East and North Africa. Iran J Pediatr.
2016 Apr; 26(2): e4496.
35. Din-Dzietham R, Liu Y, Bielo M-V, Shamsa F. High blood
pressure trends in children and adolescents in national surveys, 1963 to 2002.
Circulation. 2007Sep;116(13):1488-96.
36. Basiratnia M, Derakhshan D, Ajdari S, Saki F. Prevalence
of childhood obesity and hypertension in south of Iran. Iran J Kidney Dis.
2013Jul;7(4):282-9.
37. Buch N, Goyal JP, Kumar N, Parmar I, Shah VB, Charan J.
Prevalence of hypertension in school going children of Surat city, Western
India. J Cardiovasc Dis Res. 2011;2(4):228-32.
38. Monyeki KD, Kemper HCG, Makgae PJ. The association of fat
patterning with blood pressure in rural South African children: the Ellisras
Longitudinal Growth and Health Study. Int J Epidemiol. 2006Feb;35(1):114-20.
39. Muntner P, He J, Cutler JA, Wildman RP, Whelton PK.
Trends in Blood Pressure Among Children and Adolescents. JAMA.
2004May;291(17):2107-13.
40. Flynn J. The changing face of pediatric hypertension in
the era of the childhood obesity epidemic. Pediatr Nephrol.
2013Jul;28(7):1059-66.
41. Rosner B, Prineas R, Daniels SR, Loggie J. Blood pressure
differences between blacks and whites in relation to body size among US
children and adolescents. Am J Epidemiol. 2000May;151(10):1007-19.
42. Chirag B, Chavda J, Kakkad MK, Damor P. A Study of
Prevalence of Hypertension in School Children. Gujarat Medical Journal.
2013Dec; 68: 2.
43. André J-L. Hypertension artérielle chez
l'enfant et l'adolescent. EMC - Cardiol-Angéiologie.
2005Nov;2(4):478-90.
44. Flynn JT, Kaelber DC, Baker-Smith CM, Blowey D, Carroll
AE, Daniels SR, et al. Clinical Practice Guideline for Screening and Management
of High Blood Pressure in Children and Adolescents. Pediatrics.
2017;140(3):e20171904.
45. Ashish B, Cynthia B, Monesha GM, Joshua S. Blood pressure
percentile charts to identify high or low blood pressure in children. BMC
Pediatrics. (2016);16:98.
46. Chiolero A, Bovet P, Paradis G, Paccaud F. Has blood
pressure increased in children in response to the obesity epidemic. Pediatrics.
2007Mar;119(3):544-53.
47. Lurbe E, Cifkova R, Cruickshank K, Dillon M, Ferreira I,
Kuznetsova T, et al . Management of high blood pressure in children and
adolescents: Recommendations of the European Society of Hypertension. J
Hypertens. 2010Jul; 27:1719-42.
48. Calhoun DA, Harding SM. Sleep and hypertension. Chest.
2010 Aug;138(2):434-43.
49. Lu X, Shi P, Luo C-Y, Zhou Y-F, Guo CY, Wu F. Prevalence
of hypertension in overweight and obese children from a large school-based
population in Shanghai, China. BMC Public Health. 2013 Jan; 13:24.
50. Falkner B, Gidding SS, Portman R, Rosner B. Blood
pressure variability and classification of prehypertension and hypertension in
adolescence. Pediatrics. 2008 Aug;122(2):238-42.
51. Silbernagl S, Lang F. Atlas de Poche -
Physiopathologie.13th edition. Lavoisier; 2015.
52. Guyton AC, Hall JE. Textbook of Medical Physiology. 9th
ed. Philadelphia?: W.B. Saunders; 1996.
53. Beevers G, Lip GYH, O'Brien E. The pathophysiology of
hypertension. BMJ. 2001Apr;322(7291):912-6.
54. Rahman AJ, Qamar FN, Ashraf S, Khowaja ZA, Tariq SB,
Naeem H. Prevalence of hypertension in healthy school children in Pakistan and
its relationship with body mass index, proteinuria and hematuria. Saudi J
Kidney Dis Transpl. 2013 Mar;24(2):408-12.
55. Kollias A. Hypertension in children and adolescents.
World J Hypertens. 2011;1(1):15.
56. Bilagi DU. Techniques of blood pressure measurement.
(Auscultatory, Oscillometric, Ultrasound, finger cuff method of Penaz) and
Auscultatory gap [Internet]. Heart And Teeth. 2012 [Cited 23 October 2017].
Disponible sur:
http://bilagi.org/blog/2012/07/03/techniques-of-blood-pressure-measurement-auscultatory-oscillometric-ultrasound-finger-cuff-method-of-penaz-and-auscultatory-gap/
57. Genovesi S, Brambilla P, Giussani M, Galbiati S,
Mastriani S, Pieruzzi F, et al. Insulin resistance, prehypertension,
hypertension and blood pressure values in paediatric age. J Hypertens.
2012Feb;30(2):327-35.
58. Kavey RE. Left ventricular hypertrophy in hypertensive
children and adolescents: predictors and prevalence. Curr Hypertens Rep.
2013Oct;15(5):453-7.
59. Franks PW, Hanson RL, Knowler WC, Sievers ML, Bennett PH,
Looker HC. Childhood Obesity, Other Cardiovascular Risk Factors, and Premature
Death. N Engl J Med. 2010Feb;362(6):485-93.
60. Van Itallie TB. Health implications of overweight and
obesity in the United States. Ann Intern Med. 1985Déc;103(6 ( Pt
2)):983-8.
61. Sebire G, Husson B, Lasser C, Tardieu M, Dommergues JP,
Landrieu P. Encéphalopathie induite par l'hypertension
artérielle: aspects cliniques, radiologiques et thérapeutiques.
Arch Pédiatr. 1995;2(6):513-8.
62. Sorof JM, Lai D, Turner J, Poffenbarger T, Portman RJ.
Overweight, ethnicity, and the prevalence of hypertension in school-aged
children. Pediatrics. 2004 Mar;113(3 Pt 1):475-82.
63. Moura AA, Silva MAM, Ferraz MRMT, Rivera IR.
Prevalência de pressão arterial elevada em escolares e
adolescentes de Maceió. J Pediatr (Rio J). 2004Feb;80(1):35-40.
64. Sharma A, Grover N, Kaushik S, Bhardwaj R, Sankhyan N.
Prevalence of hypertension among schoolchildren in Shimla. Indian Pediatr.
2010Oct;47(10):873-6.
65. Figueirinha F, Gesmar VHH. High Blood Pressure in
Pre-Adolescents and Adolescents in Petrópolis: Prevalence and
Correlation with Overweight and Obesity . Int. J. Cardiovasc. Sci. 2017; 30(3):
243-50.
66. Naha NK, John M, Cherian V. Prevalence of hypertension
and risk factors among school children in Kerala, India. Int J Contemp Pediatr.
2016;3(3)931-8.
67. Yang Y, Dong B, Wang S, Dong Y, Zou Z, Fu L, et al.
Prevalence of high blood pressure subtypes and its associations with BMI in
Chinese children: a national cross-sectional survey. BMC Public Health.
2017Jun; 17:598.
68. Martín-Espinosa N, Díez-Fernández A,
Sánchez-López M, Rivero-Merino I, Lucas-De La Cruz L,
Solera-Martínez M, et al. Prevalence of high blood pressure and
association with obesity in Spanish schoolchildren aged 4-6 years old. PLoS
ONE.2017Jan;12(1): e0170926.
69. Kagura J, Adair LS, Musa MG, Pettifor JM, Norris SA.
Blood pressure tracking in urban black South African children: birth to twenty
cohort. BMC Pediatr. 2015 Jul;15:78.
70. Umar Also, Asani M, Muuta I. Prevalence of elevated blood
pressure among primary school children in Kano Metropolis, Nigeria. Nig J
Cardiol. 2016; 13(1): 57-61.
71. Charan J, Biswas T. How to Calculate Sample Size for
Different Study Designs in Medical Research. Indian J Psychol Med.
2013;35(2):121-6.
72. Guru Raj MS, Shilpa S, Maheshwaran R. Revised
socio-economic status scale for urban and rural india - revision for 2015.
Socioeconomica. 2015; 4(7): 167-74.
73. The Mother and Child Health and Education Trust. Taking
the Weight-for-Height/Length - Anthropometric Measurements Techniques -
Diagnosis of Acute Malnutrition - Mother, Infant and Young Child Nutrition
& Malnutrition - Feeding practices including micronutrient deficiencies
prevention, control of wasting, stunting and underweight [Internet]. 2017
[Cited 29 October 2017]. Available from:
http://motherchildnutrition.org/malnutrition-management/integrated-management/taking-the-weight-for-height-length.html
74. Sadoh WE, Omuemu VO, Sadoh AE, Iduoriyekemwen NJ,
Adigweme IN, Owobo AC, et al. Blood pressure percentiles in a group of
Nigerian school age children. Niger J Paed.2014; 41 (3):223 -8.
75. Live Cameroon population [Internet]. 2018 [Cited 15 May
2018]. Available from: htttp://countrymeters.info/en/Cameroon
76. Maj DR, Kushwaha AS, Kotwal A, Basannar DR, Mahen ACA.
Study of blood pressure pro?le of school children 6-15 years in a rural setting
of Maharashtra. Med JArmed Forces India. 2012; 68:222-5.
77. Badawi NES, Barakat AA, Sherbini SAE, Fawzy HM.
Prevalence of overweight and obesity in primary school children in Port Said
city. Gaz Egypt Paediatr Assoc . 2013; 61:31-36.
78. Mekone N. Facteurs de risque de la surcharge
pondérale chez les adolescents âgés de 10 à 15 ans
scolarisés dans les établissements secondaires de Yaoundé
[Memoire]. Universite de Yaounde I; 2014.
79. Pangani IN, Kiplamai FK, Kamau JW, Onywera VO. Prevalence
of Overweight and Obesity among Primary School Children Aged 8-13 Years in Dar
es Salaam City, Tanzania. AdvPrev Med. 2016;2016: 1345017.
80. Souza CB, Dourado CS, Mill JG, Salaroli LB, Molina MDCB.
Prevalence of Hypertension in Children from Public Schools. Int J Cardiovasc
Sci. 2017; 30(1):42-51.
81. Kidy F, Rutebarika D, Lule SA, Kizza M, Odiit A, Webb EL,
et al. Blood pressure in primary school children in Uganda: a cross-sectional
survey. BMC Public Health. 2014; 14:1223.
82. Okpokowuruk FS, Akpan MU, Ikpeme EE. Prevalence of
hypertension and prehypertension among children and adolescents in a
semi-urban area of Uyo Metropolis, Nigeria. Pan Afr Med J. 2017; 28:303.
83. Muhihi AJ, Njelekela MA, Mpembeni RNM, Muhihi BG, Anaeli
A, Chillo O. Elevated blood pressure among primary school children in Dar es
salaam, Tanzania: prevalence and risk factors. BMC Pediatrics. 2018; 18:54.
84. Sabapathy S, Nagaraju BA, Bhanuprakash CN. Prevalence of
childhood hypertension and pre-hypertension in school going children of
Bangalore rural district: a cross sectional study. Int J Contemp Pediatr. 2017
Sep; 4(5):1701-4.
85. Manoja KD, Bhatia V, Anupam S. Prevalence of hypertension
in urban school children aged 5 to 10 years in North India. Int J Contemp
Pediatr. 2017 Nov; 4(6):2055-9.
86. Kishorkumar D, Stalin P, Prasad RV, Singh Z. Prevalence
of Hypertension Among School Children in a Rural Area of Tamil Nadu. Indian
Pediatr. 2016 Feb; 53(2):165-6.
87. Adrogue HE, Sinaiko AR. Prevalence of Hypertension in
Junior High School-Aged Children: Effect of New Recommendations in the 1996
Updated Task Force Report. Am JHypertens. 2001 May; 14(5 Pt 1):412-4.
88. Goon D, Amusa L, Mhlongo D, Khoza L, Anyanwu F. Elevated
Blood Pressure among Rural South African Children in Thohoyandou, South
Africa. Iranian J Publ Health.2013May; 42(5):489?96.
89. Veena KG, Prasanna MP, Pattanshetty S, Asha K,
Balakrishnan A, Mishra T, et al. Prevalence of hypertension in the paediatric
population in Coastal South India. Australas Med J. 2010; 3(11): 695?8.
90. Bhuvaneswari M, Ramaprasad GS. Biophysical profile of
blood pressure in urban healthy school children- a cross sectional study. J
Evid Based Med Healthc. 2018; 5(9): 749-52.
91. Arun DJ, Kavinilavu R. A study of risk factors associated
with hypertension among the school going children in Puducherry. Int J
Community Med Public Health. 2018 Feb; 5(2):764-8.
92. Gianvincenzo B, Carmela C, Russo MD, Russo P, Nappo A,
Fabio L, et al. Gender-Related Differences in the Relationships Between Blood
Pressure, Age, and Body Size in Prepubertal Children. Am J Hypertens. 2008
Sep; 21(9):1007-10.
93. Agyemang C, Redekop WK, Owusu-Dabo E, Bruijnzeels MA.
Blood pressure patterns in rural, semi-urban and urban children in the Ashanti
region of Ghana, West Africa. BMC Public Health. 2005; 5:114.
94. Sorof J, Daniels S. Obesity Hypertension in Children A
Problem of Epidemic Proportions. Hypertension [Internet]. 2002 [cited 20
February 2018]. Available from: http://www.hypertensionaha.org
95. Brady TM. Obesity-Related Hypertension in Children.
Front Pediatr. 2017Sep; 5:197.
96. Goel M, Pankaj P, Agrawal A, Ashok C. Relationship of
body mass index and other life style factors with hypertension in adolescents.
Ann Pediatr Card. 2016; 9:29-34.
97. Kanciruk M, Andrews JW, Donnon T. Family history of
obesity and risk of childhood overweight and obesity: A meta-analysis.
International Journal of Psychological and Behavioural Sciences. 2014;
8(5).waset.org/abstracts/4316.
98. Poplawska K, Dudek K, Koziarz M, Cieniawski D, Drozdz T,
Smiaek S, et al. Prematurity-Related Hypertension in Children and Adolescents.
Int J Pediatr.2012; 2012:537936.
99. Bonamy AKE, Mohlkert LA, Hallberg J, Liuba P, Fellman V,
Domellof M, et al. Blood Pressure in 6-Year-Old Children Born Extremely
Preterm. J Am Heart Assoc. 2017; 6:e005858.
CHAPTER
XIi: APPENDIX
APPENDIX I
FICHE D'ENQUETE
TITRE: PREVALENCE ET LES FACTEURS ASSOCIES DE
L'HYPERTENSION ARTERIELLE CHEZ LES ELEVES DE L'ECOLE PRIMAIRE DANS
L'ARRONDISSEMENT DE MBANKOMO
N° du questionnaire
:...........................................
Date de collecte:...........................................
Numéro de Téléphone du tuteur
légal:...................................................
Section A
Partie I: Données Socio-Démographiques
de votre enfant
1. Nom de l'enfant
:............................................
2. Date de naissance:.................................
3. Age:.........................................
4. Sexe: [1] Masculin [2] Féminin
5. Type d'école : [1] Publique [2]
Privé
6. Classe : [1] Sil/Class1[2] CP/ Class2[3]CE1/
Class3[4]CE2/ Class 4 [5]CM1/Class 5 [6]CM2/Class 6
7. Quartier :
................................................................
8. Milieu scolaire: [1] Rural [2] Semi-urbain
9. Profession du tuteur légal : [1] Etudiant(e)/
élève [2]Secteur publique[3]Secteur privé [4] Secteur
informel [5] Sans emploi [6] Autres...............................
Partie II: Données
Socio-Economiques
10. Niveau d'éducation du tuteur
légal :..........................................................
11. Profession du tuteur
legal :.....................................................
12. PartieV: Antécédents
a. Personnels
1. Quel était son poids de naissance (en grammes) :
....................................
2. Quel était son terme : [1]
prématuré(e) [2] A terme
3. A-t-il(elle) déjà été
diagnostiqué(e) d'un des problèmes suivant ?
- Problème rénal ou infection urinaire
récurrente : [1] Oui [2] Non
- Problème de coeur : [1] Oui [2] Non
- Drépanocytose : [1] Oui [2] Non
4. A-t-il(elle) déjà été
diagnostiqué(e) d'une hypertension ? [1] Oui [2] Non
5. Si oui, où est-ce que le diagnostic a été
fait? [1] A l'hôpital [2] Hors de l'hôpital.
6. Est-il(elle) sous une médication ? [1] Oui [2] Non
7. Si oui, quel(s) est(sont) le(les) nom(s) de cette(s)
médication(s)? [1] Benazepril [2] Fosinopril [3] Enalapril
[4]Lisinopril [5] Irbesartan [6]Losartan [7] Propanolol [8] Amlodipine[9]
Hydrochlorothiazide [10] Médicament traditionnel [11] Autre(s),
précisez........................................
b. Familiaux
8. Y'a-t-il dans la famille l'hypertension artérielle
?[1] Oui [2] Non
9. Si oui, chez lequel des membres? [1] Père [2]
Mère [3] Grandparent[4] Oncle /tante [5] Frère
/soeur
10. Y'a-t-il dans la famille le diabète? [A] Oui
[B] Non
11. Si oui, chez lequel des membres? [1] Père [2]
Mère [3] Grandparent[4] Oncle /tante [5] Frère
/soeur
12. Y'a-t-il dans la famille une personne en surpoids ? [1] Oui
[2] Non
13. Si oui, chez lequel des membres? [1] Père [2]
Mère [3] Grandparent[4] Oncle /tante [5] Frère
/soeur
PartieV: Antécédents
b. Personnels
14. Quel était son poids de naissance (en grammes) :
....................................
15. Quel était son terme : [1]
prématuré(e) [2] A terme
16. A-t-il(elle) déjà été
diagnostiqué(e) d'un des problèmes suivant ?
- Problème rénal ou infection urinaire
récurrente : [1] Oui [2] Non
- Problème de coeur : [1] Oui [2] Non
- Drépanocytose : [1] Oui [2] Non
17. A-t-il(elle) déjà été
diagnostiqué(e) d'une hypertension ? [1] Oui [2] Non
18. Si oui, où est-ce que le diagnostic a
été fait? [1] A l'hôpital [2] Hors de
l'hôpital.
19. Est-il(elle) sous une médication ? [1] Oui [2]
Non
20. Si oui, quel(s) est(sont) le(les) nom(s) de cette(s)
médication(s)? [1] Benazepril [2] Fosinopril [3] Enalapril
[4]Lisinopril [5] Irbesartan [6]Losartan [7] Propanolol [8] Amlodipine[9]
Hydrochlorothiazide [10] Médicament traditionnel [11] Autre(s),
précisez........................................
b. Familiaux
21. Y'a-t-il dans la famille l'hypertension artérielle
?[1] Oui [2] Non
22. Si oui, chez lequel des membres? [1] Père [2]
Mère [3] Grandparent[4] Oncle /tante [5] Frère
/soeur
23. Y'a-t-il dans la famille le diabète? [A] Oui
[B] Non
24. Si oui, chez lequel des membres? [1] Père [2]
Mère [3] Grandparent[4] Oncle /tante [5] Frère
/soeur
25. Y'a-t-il dans la famille une personne en surpoids ? [1] Oui
[2] Non
26. Si oui, chez lequel des membres? [1] Père [2]
Mère [3] Grandparent[4] Oncle /tante [5] Frère
/soeur
PartieV: Antécédents
c. Personnels
27. Quel était son poids de naissance (en grammes) :
....................................
28. Quel était son terme : [1]
prématuré(e) [2] A terme
29. A-t-il(elle) déjà été
diagnostiqué(e) d'un des problèmes suivant ?
- Problème rénal ou infection urinaire
récurrente : [1] Oui [2] Non
- Problème de coeur : [1] Oui [2] Non
- Drépanocytose : [1] Oui [2] Non
30. A-t-il(elle) déjà été
diagnostiqué(e) d'une hypertension ? [1] Oui [2] Non
31. Si oui, où est-ce que le diagnostic a
été fait? [1] A l'hôpital [2] Hors de
l'hôpital.
32. Est-il(elle) sous une médication ? [1] Oui [2]
Non
33. Si oui, quel(s) est(sont) le(les) nom(s) de cette(s)
médication(s)? [1] Benazepril [2] Fosinopril [3] Enalapril
[4]Lisinopril [5] Irbesartan [6]Losartan [7] Propanolol [8] Amlodipine[9]
Hydrochlorothiazide [10] Médicament traditionnel [11] Autre(s),
précisez........................................
b. Familiaux
34. Y'a-t-il dans la famille l'hypertension artérielle
?[1] Oui [2] Non
35. Si oui, chez lequel des membres? [1] Père [2]
Mère [3] Grandparent[4] Oncle /tante [5] Frère
/soeur
36. Y'a-t-il dans la famille le diabète? [A] Oui
[B] Non
37. Si oui, chez lequel des membres? [1] Père [2]
Mère [3] Grandparent[4] Oncle /tante [5] Frère
/soeur
38. Y'a-t-il dans la famille une personne en surpoids ? [1] Oui
[2] Non
39. Si oui, chez lequel des membres? [1] Père [2]
Mère [3] Grandparent[4] Oncle /tante [5] Frère
/soeur
Revenue mensuel de la famille par mois (FCFA) : [1]
=15.072[2] 15073 -45217 [3] 45.218 - 75.363 [4] 75.364-113.045 [5]
113.046-150.727 [6]150.728-301.454 [7] =301.455
Partie III: Antécédents
a. Personnels
13. Quel était son poids de naissance (en grammes) :
....................................
14. Quel était son terme : [1]
Prématuré(e) [2] A terme
15. A-t-il(elle) déjà été
diagnostiqué(e) d'un des problèmes suivant ?
- Problème rénal ou infection urinaire
récurrente : [1] Oui [2] Non
- Problème de coeur : [1] Oui [2] Non
- Drépanocytose : [1] Oui
[2] Non
16. A-t-il(elle) déjà été
diagnostiqué(e) d'une hypertension ? [1] Oui [2] Non
17. Si oui, où est-ce que le diagnostic a
été fait? [1] A l'hôpital [2] Hors de
l'hôpital.
18. Est-il(elle) sous une médication ? [1] Oui
[2] Non
19. Si oui, quel(s) est(sont) le(les) nom(s) de cette(s)
médication(s)? [1] Benazepril [2] Fosinopril [3] Enalapril
[4]Lisinopril [5] Irbesartan [6]Losartan [7] Propanolol [8] Amlodipine [9]
Hydrochlorothiazide [10] Médicament
traditionnel [11] Autre(s),
précisez.....................................
b. Familiaux
20. Y'a-t-il dans la famille l'hypertension artérielle
?[1] Oui [2] Non
21. Si oui, chez lequel des membres? [1] Père
[2] Mère [3] Grandparent [4] Oncle /tante
[5] Frère /soeur
22. Y'a-t-il dans la famille le diabète? [A] Oui
[B] Non
23. Si oui, chez lequel des membres? [1] Père
[2] Mère [3] Grandparent [4] Oncle /tante
[5] Frère /soeur
24. Y'a-t-il dans la famille une personne en surpoids ? [1] Oui
[2] Non
25. Si oui, chez lequel des membres? [1] Père
[2] Mère [3] Grandparent [4] Oncle /tante
[5] Frère /soeur
Partie IV: Habitudes alimentaires
26. Nombre de repas par jour:
...........................................
27. Une fois à table, ajoutez-vous?
- Du sel de cuisine : [1] Oui [2] Non - Du cube ou
arome : [1] Oui [2] Non
28. Combien de fois consomme t-il/elleen moyenne des fruits
par semaine: .....................
29. Combien de fois consomme t-il/elleen moyenne des
légumes par semaine: ..................
30. Vous consommez des boissons gazeuses sucrées (jus
brassés) ? [1] Occasionnellement [2]
Régulièrement
31. Quelle quantité d'eaubuvez-vous en moyenne par
jour? [1] Moins d'un demi-litre d'eau[2] Entre 0.5 litre et 1litre
d'eau [3] Plus d'un litre d'eau
Partie V: Activité physique et
sédentarité
32. Principal moyen de locomotion pour aller à
l'école: [1] A pieds [2] En vehicule
33. Si par vehicule, combien de temps de marche tu mets pour le
prendre? ...............minutes
34. Si à pieds, combien de temps tu mets pour arriver
à l'école? ...........................minutes
35. Pratiquez-vous le sport scolaire? [1] Oui
[2] Non
36. Si oui, combien d'heures en moyenne par
semaine? ...................................heures.
37. Est-ce que tu fais du sport en dehors de l'école ? [1]
Oui [2] Non
38. Si oui, combien de fois par semaine?
..............................................
39. Combien d'heures par jour passes-tu devant
la télévision ou les jeux ou l'ordinateur?
[1] Moins d'une heure [2] 1-2 heures
[3] Plus de 2 heures
40. Temps de sommeil en heure par jour? [1]
moins de 6 heures [2] 6-8 heures [3] Plus de 8 heures
Section B: Paramètres (RESERVE UNIQUEMENT A
L'ENQUETEUR)
41. Poids: ......................kg Taille
:...................cm
42. Date de mesure :
...................................................
43. Taille percentile ( à partir des courbes de
référence)................................
44.
IMC(Calculée):.................................................kg/m2
45. IMC Percentile ( à partir des courbes de
référence):[1] <5eme[2] entre =5eme et
<85eme [3] entre =85eme et <95eme[4]
=95eme
Premier passage
46. Pression artérielle: TAS........................
TAD...................
47. TAS percentile pour l'âge, le sexe et la taille : [1]
< 90eme[2] = 90eme- <95eme[3] =
95eme - <99eme[4] =99eme +5mmHg
48. TAD percentile: [1] < 90eme[2] =
90eme- <95eme[3] = 95eme -
<99eme[4] =99eme +5mmHg
Deuxième passage
49. Pression artérielle: TAS........................
TAD...................
50. TAS percentile pour l'âge, le sexe et la taille : [1]
< 90eme[2] = 90eme- <95eme[3] =
95eme - <99eme[4] =99eme +5mmHg
51. TAD percentile: [1] < 90eme[2] =
90eme- <95eme[3] = 95eme -
<99eme[4] =99eme +5mmHg
Troisième passage
52. Pression artérielle: TAS........................
TAD...................
53. TAS percentile pour l'âge, le sexe et la taille : [1]
< 90eme[2] = 90eme- <95eme[3] =
95eme - <99eme[4] =99eme +5mmHg
54. TAD percentile: [1] < 90eme[2] =
90eme- <95eme[3] = 95eme -
<99eme[4] =99eme +5mmHg
55. Bandelette urinaire-Proteinurie :[1] Trace(<30mg/dl)
[2] +1(=30-<100mg/dl) [3] +2(=100-<300mg/dl) [4] +3(=300 -
<1000mg/dl) [5]+4(=1000mg/dl)
56. Bandelette urinaire-Sang : [1] Oui [2] Non
WORK SHEET
TITLE: PREVALENCE AND ASSOCIATED FACTORS OF
HYPERTENSION IN PRIMARY SCHOOL CHILDREN IN THE MBANKOMO SUBDIVISION
Code of the questionnaire:
...........................................
Date of recruitment:
...........................................
Telephone number of legal tutor:
...................................................
Section A
Part I: Socio-demographic data of your
child
1. Name of the child:
............................................
2. Date of birth: .......................................
3. Age: .....................................................
4. Gender: [1] Male [2] Female
5. School type: [1] Public [2] Private
6. Class: [1] Sil/Class1[2] CP/ Class2[3]CE1/ Class3[4]CE2/ Class
4 [5]CM1/Class 5 [6]CM2/Class 6
7. Quarter:
................................................................
8. School setting: [1] Rural [2] Semi-urban
9. Legal tutor's Occupation: [1] Student [2] Public
Sector [3] Private Sector [4] Informal sector
[5] Unemployed [6]
Other,precise........................................
Part II: Socio-Economic
Characteristics
10. Level of education of the legal tutor
:....................................................
11. Profession of legal tutor
:.............................................................
12. Monthly family income (FCFA) : [1] =15,072
[2] 15,073 - 45,217 [3] 45,218 - 75,363
[4] 75,364-113,045 [5] 113,046 - 150,727
[6]150,728 - 301,454 [7] =301,455
Part III: Past History
a. Personal
13. What was his birth weight (in grams):
....................................
14. What was his/her term ? [1] Premature
[2] At term
15. Has he (she) ever been diagnosed with any of the following
problems?
- Renal problem or recurrent urinary tract infection: [1] Yes
[2] No
- Heart problem: [1] Yes [2] No
- Sickle cell disease: [1] Yes [2] No
16. Has he / she ever been diagnosed with hypertension? [1] Yes
[2] No
17. If yes, where was the diagnosis made? [1] In the hospital [2]
Out of the hospital.
18. Is he (she) under a medication? [1] Yes [2]
No
19. If yes, which one (s) is (are) the name (s) of this
medication (s)? [1] Benazepril [2] Fosinopril [3] Enalapril [4] Lisinopril [5]
Irbesartan [6] Losartan [7] Propanolol [8] Amlodipine
[9] Hydrochlorothiazide [10] Traditional medicine
[11] Other (s), please specify ........................................
b. Family
20. Is there any one with hypertension in the family? [1] Yes [2]
No
21. If yes, which members? [1] Father [2] Mother [3] Grandparent
[4] Uncle / aunt [5] Brother / sister
22. Is there diabetes in the family? [1] Yes [2]
No
23. If yes, which members? [1] Father [2] Mother [3] Grandparent
[4] Uncle / aunt [5] Brother / sister
24. Is there in the family any fat person? [1] Yes [2] No
25. ??If yes, which members? [1] Father [2] Mother [3]
Grandparent [4] Uncle / aunt [5] Brother / sister
Part IV: Feeding habits
26. Number of meals per day:
...........................................
27. Once at the table, do you add?
-
Tablesalt :[1] Yes [2] No - Cube or aroma: [1]
Yes [2] No
28. How many times does he / she eat fruit on average per
week: ..............................................
29. How many times does he / she consume vegetables on average
per week: ............................
30. Do you eat sweetened soft drinks (brewed juice)? [1]
Occasionally [2] Regularly
31. What quantity of water do you drink on average per
day? [1] Less than half a liter of water [2] Between 0.5 liter and 1
liter of water [3] More than one liter of water.
Part V: Physical activity and
lifestyle
32. Primary means of transportation to school: [1] On foot
[2] By vehicle
33. If by vehicle, how long do you take to take it?
.....................minutes
34. If on foot, how long do you take to get to school?
..............................minutes
35. Do you practice school sport? [1] Yes [2] No
36. If yes, how many hours on average per week?
................................... hours.
37. Do you practise sports outside of school? [1] Yes [2] No
38. If yes, how many times a week?
..............................................
39. How many hours a day do you spend watching
television and/or games and/or computer?[1] Less than an hour [2] 1-2 hours [3]
More than 2 hours
40. Sleep time in hours per day? [1] less than 6
hours [2] 6-8 hours [3] More than 8 hours
Section B: Parameters (ONLY FOR THE
INVESTIGATOR)
41. Weight: ..................... .kgHeight: ..................
.cm
42. Date of measurement:
...................................................
43. Height Percentile (from the reference curves)
................................
44. BMI (Calculated):
................................................ .kg / m2
45. BMI Percentile (from the reference curves): [1]
<5th [2] between =5th and
<85th[3] between =85thand <95th[4]
=95th
First passage
46. Blood pressure: SBP ...............................
DBP................................... ....
47. SBP percentile for age, sex and height: [1]
<90th [2] = 90th -
<95th[3] = 95th - <99th[4]
=99th + 5mmHg
48. DBP Percentile : [1] <90th[2] =
90th - <95th[3] = 95th -
<99th[4] =99th + 5mmHg
Second passage
49. Blood pressure: SBP ...............................
DBP................................... ....
50. SBP percentile for age, sex and height: [1]
<90th [2] = 90th -
<95th[3] = 95th - <99th[4]
=99th + 5mmHg
51. DBP Percentile : [1] <90th[2] =
90th - <95th[3] = 95th -
<99th[4] =99th + 5mmHg
Third passage
52. Blood pressure: SBP ...............................
DBP................................... ....
53. SBP percentile for age, sex and height: [1]
<90th [2] = 90th -
<95th[3] = 95th - <99th[4]
=99th + 5mmHg
54. DBP Percentile : [1] <90th[2] =
90th - <95th[3] = 95th -
<99th[4] =99th + 5mmHg
55. Urine dipstick-Proteinuria: [1] Trace (<30mg / dl) [2] +1
(=30 - <100mg / dl) [3] +2 (=100- <300mg / dl) [4] +3
(=300 - <1000mg / dl) [5] +4 (=1000mg / dl)
56. Urine dipstick-Blood : [1] Yes [2] No
APPENDIX II
INFORMED CONSENT FORM
Section I: Information Section
Dear Sir / Madame,
1. Introduction
I am CHIABI EDMOND NGONG,a
7th year medical student of the Faculty of Medicine and Biomedical
Sciences of the University of Yaounde I. I am carrying out a study
titled «Prevalence and associated Factorsof Hypertension in Primary School
Children in theMbankomo subdivision, Centre Region of Cameroon.»
2. Aim of the study
The main aim of this study is to generate data and increase
awareness on High blood pressure in children in the rural environment.
3. Invitation & Voluntary Participation
You are kindly invited to enroll your child in this study. We
would like you to know that the participation of your child in this study is
strictly voluntary. If you decide not enroll your child in this study, your
decision will be respected without further questioning. If along the course of
the study you decide not to participate any further, you are free to withdraw
your child from the studywithout pre- notification, such a decision will be
respected without any further questioning.
4. Procedure
During the process, you will be sent a questionnaire to be
filled. The investigator will also examine your child by taking his/her blood
pressure, the weight,the height and the collected urine. NO
BLOOD will be collected throughout the study and NO INVASIVE
TESTwill be done.
5. Risks
The study is almost free from risk apart from the fact that a
few minutes will be taken off your child's study period to conduct the
study.
6. Reimbursements and Benefits
Your child will NOT BE PAID for participating
in this study. However he / she might benefit from early diagnosis of childhood
and adolescent hypertension and referral to the doctor for follow up.
7. Confidentiality
This will be ensured by not collecting your child's name and
other sensitive information. By keeping filled questionnaires in a save where
only the investigators have access. The information will be entered into a
computer software using codes.
8. Contact in case of Questions
Please if you have any doubts concerning this study; feel free
to ask the investigator. Questions can also be directed to the supervisors
using the addresses below:
Tel: 693089876
Email: edmondchiabi@gmail.com
Section II: Consent
I....................................................................................
having understood the study, after having the study/consent form thoroughly
explained to me, having been given the opportunity to ask questions and time to
consider my participation in the study, I do hereby agree to enroll my child to
participate in this study.
Yaounde,
............................................
Signature of the participant
NOTICE D'INFORMATION ET DE CONSENTEMENT
ÉCLAIRÉ
Cher parents,
Je me nomme CHIABI Edmond NGONG, étudiant en
7e année de Médecine Générale à
la Faculté de Médecine et des Sciences Biomédicales de
l'Université de Yaoundé I (ex CUSS). Je sollicite votre
participation ainsi que celle de votre enfant à l'étude
intitulée : ·Prévalence et les facteurs
associés de l'hypertension artérielle chez les enfants de
l'école primaire dans l'arrondissement de
Mbankomo·.
But
Le but de cette étude est de connaître le niveau
de tension artérielle de base de l'enfant « sain » afin de
déterminer la prévalence et les facteurs de risque de
l'hypertension artérielle en milieu scolaire dans un milieu rural.
Méthodes et procédures
Si vous acceptez de participer à cette étude
(vous et votre enfant), vous répondrez au questionnaire qui vous est
adressé ; et l'investigateuràl'école, examinera
l'enfant par la prise de sa tension artérielle, son poids, sa taille et
l'urine collectée. Aucune prise de sang sera faite ni autre examen
invasif.
Les risques, effets secondaires ou
inconvénients
Nous ne prévoyons pas de risques, des effets
secondaires ou inconvénients quant à la participation à
cette étude. Aucun revenu financier n'est engagé en participant
à l'étude.
La confidentialité et l'Éthique
Toutes les informations recueillies dans le cadre de cette
étude seront anonymes et confidentielles. L'étude sera
effectuée selon les principes et directives nationales et
internationales applicables en matière d'Éthique.
Communication des résultats
Pour plus ample information vous pourrez directement nous
contacter personnellement au :
Tel: 693089876
Email: edmondchiabi@gmail.com
FORMULAIRE DE CONSENTEMENT DES
PARENTS
(Renvoyez nous ce consentement après signature et
le questionnaire dûment remplis)
Je soussigné Mme /Mr
.................................................................
..................................................................................................
Parent de l'enfant
....................................................... Atteste avoir
reçu toutes les informations relatives à
l'étude : « Prévalence et les facteurs
associés de l'hypertension artérielle chez les enfants de
l'école primaire dans l'arrondissement de
Mbankomo »
J'accepte librement de participer à l'étude
ainsi que mon enfant, en répondant à toutes les questions qui me
seront posées et en soumettant mon enfant à la réalisation
de la procédure de l'étude qui m'a été clairement
expliquée.
J'ai lu cette fiche de consentement éclairée
et en ai reçu une copie ; je ne demande aucune
rémunération aux investigateurs de ce travail.
J'ai compris le but de l'étude, ses avantages sur la
prise en charge et la prévention de l'hypertension artérielle en
milieu scolaire ; j'accepte que les données recueillies puissent
être exploitées pour la recherche scientifique.
Lu et approuvé.
Date:...................................
Signature du participant
APPENDIX III
SECTION 1: BLOOD PRESSURE TABLES
BP Levels for Boys by Age and Height
Percentile
|
Age (y)
|
BP Percentile
|
SBP (mm?Hg)
|
DBP (mm?Hg)
|
|
Height Percentile or Measured Height
|
Height Percentile or Measured Height
|
|
5%
|
10%
|
25%
|
50%
|
75%
|
90%
|
95%
|
5%
|
10%
|
25%
|
50%
|
75%
|
90%
|
95%
|
|
1
|
Height (in)
|
30.4
|
30.8
|
31.6
|
32.4
|
33.3
|
34.1
|
34.6
|
30.4
|
30.8
|
31.6
|
32.4
|
33.3
|
34.1
|
34.6
|
|
Height (cm)
|
77.2
|
78.3
|
80.2
|
82.4
|
84.6
|
86.7
|
87.9
|
77.2
|
78.3
|
80.2
|
82.4
|
84.6
|
86.7
|
87.9
|
|
50th
|
85
|
85
|
86
|
86
|
87
|
88
|
88
|
40
|
40
|
40
|
41
|
41
|
42
|
42
|
|
90th
|
98
|
99
|
99
|
100
|
100
|
101
|
101
|
52
|
52
|
53
|
53
|
54
|
54
|
54
|
|
95th
|
102
|
102
|
103
|
103
|
104
|
105
|
105
|
54
|
54
|
55
|
55
|
56
|
57
|
57
|
|
95th + 12 mm?Hg
|
114
|
114
|
115
|
115
|
116
|
117
|
117
|
66
|
66
|
67
|
67
|
68
|
69
|
69
|
|
2
|
Height (in)
|
33.9
|
34.4
|
35.3
|
36.3
|
37.3
|
38.2
|
38.8
|
33.9
|
34.4
|
35.3
|
36.3
|
37.3
|
38.2
|
38.8
|
|
Height (cm)
|
86.1
|
87.4
|
89.6
|
92.1
|
94.7
|
97.1
|
98.5
|
86.1
|
87.4
|
89.6
|
92.1
|
94.7
|
97.1
|
98.5
|
|
50th
|
87
|
87
|
88
|
89
|
89
|
90
|
91
|
43
|
43
|
44
|
44
|
45
|
46
|
46
|
|
90th
|
100
|
100
|
101
|
102
|
103
|
103
|
104
|
55
|
55
|
56
|
56
|
57
|
58
|
58
|
|
95th
|
104
|
105
|
105
|
106
|
107
|
107
|
108
|
57
|
58
|
58
|
59
|
60
|
61
|
61
|
|
95th + 12 mm?Hg
|
116
|
117
|
117
|
118
|
119
|
119
|
120
|
69
|
70
|
70
|
71
|
72
|
73
|
73
|
|
3
|
Height (in)
|
36.4
|
37
|
37.9
|
39
|
40.1
|
41.1
|
41.7
|
36.4
|
37
|
37.9
|
39
|
40.1
|
41.1
|
41.7
|
|
Height (cm)
|
92.5
|
93.9
|
96.3
|
99
|
101.8
|
104.3
|
105.8
|
92.5
|
93.9
|
96.3
|
99
|
101.8
|
104.3
|
105.8
|
|
50th
|
88
|
89
|
89
|
90
|
91
|
92
|
92
|
45
|
46
|
46
|
47
|
48
|
49
|
49
|
|
90th
|
101
|
102
|
102
|
103
|
104
|
105
|
105
|
58
|
58
|
59
|
59
|
60
|
61
|
61
|
|
95th
|
106
|
106
|
107
|
107
|
108
|
109
|
109
|
60
|
61
|
61
|
62
|
63
|
64
|
64
|
|
95th + 12 mm?Hg
|
118
|
118
|
119
|
119
|
120
|
121
|
121
|
72
|
73
|
73
|
74
|
75
|
76
|
76
|
|
4
|
Height (in)
|
38.8
|
39.4
|
40.5
|
41.7
|
42.9
|
43.9
|
44.5
|
38.8
|
39.4
|
40.5
|
41.7
|
42.9
|
43.9
|
44.5
|
|
Height (cm)
|
98.5
|
100.2
|
102.9
|
105.9
|
108.9
|
111.5
|
113.2
|
98.5
|
100.2
|
102.9
|
105.9
|
108.9
|
111.5
|
113.2
|
|
50th
|
90
|
90
|
91
|
92
|
93
|
94
|
94
|
48
|
49
|
49
|
50
|
51
|
52
|
52
|
|
90th
|
102
|
103
|
104
|
105
|
105
|
106
|
107
|
60
|
61
|
62
|
62
|
63
|
64
|
64
|
|
95th
|
107
|
107
|
108
|
108
|
109
|
110
|
110
|
63
|
64
|
65
|
66
|
67
|
67
|
68
|
|
95th + 12 mm?Hg
|
119
|
119
|
120
|
120
|
121
|
122
|
122
|
75
|
76
|
77
|
78
|
79
|
79
|
80
|
|
5
|
Height (in)
|
41.1
|
41.8
|
43.0
|
44.3
|
45.5
|
46.7
|
47.4
|
41.1
|
41.8
|
43.0
|
44.3
|
45.5
|
46.7
|
47.4
|
|
Height (cm)
|
104.4
|
106.2
|
109.1
|
112.4
|
115.7
|
118.6
|
120.3
|
104.4
|
106.2
|
109.1
|
112.4
|
115.7
|
118.6
|
120.3
|
|
50th
|
91
|
92
|
93
|
94
|
95
|
96
|
96
|
51
|
51
|
52
|
53
|
54
|
55
|
55
|
|
90th
|
103
|
104
|
105
|
106
|
107
|
108
|
108
|
63
|
64
|
65
|
65
|
66
|
67
|
67
|
|
95th
|
107
|
108
|
109
|
109
|
110
|
111
|
112
|
66
|
67
|
68
|
69
|
70
|
70
|
71
|
|
95th + 12 mm?Hg
|
119
|
120
|
121
|
121
|
122
|
123
|
124
|
78
|
79
|
80
|
81
|
82
|
82
|
83
|
|
6
|
Height (in)
|
43.4
|
44.2
|
45.4
|
46.8
|
48.2
|
49.4
|
50.2
|
43.4
|
44.2
|
45.4
|
46.8
|
48.2
|
49.4
|
50.2
|
|
Height (cm)
|
110.3
|
112.2
|
115.3
|
118.9
|
122.4
|
125.6
|
127.5
|
110.3
|
112.2
|
115.3
|
118.9
|
122.4
|
125.6
|
127.5
|
|
50th
|
93
|
93
|
94
|
95
|
96
|
97
|
98
|
54
|
54
|
55
|
56
|
57
|
57
|
58
|
|
90th
|
105
|
105
|
106
|
107
|
109
|
110
|
110
|
66
|
66
|
67
|
68
|
68
|
69
|
69
|
|
95th
|
108
|
109
|
110
|
111
|
112
|
113
|
114
|
69
|
70
|
70
|
71
|
72
|
72
|
73
|
|
95th + 12 mm?Hg
|
120
|
121
|
122
|
123
|
124
|
125
|
126
|
81
|
82
|
82
|
83
|
84
|
84
|
85
|
|
7
|
Height (in)
|
45.7
|
46.5
|
47.8
|
49.3
|
50.8
|
52.1
|
52.9
|
45.7
|
46.5
|
47.8
|
49.3
|
50.8
|
52.1
|
52.9
|
|
Height (cm)
|
116.1
|
118
|
121.4
|
125.1
|
128.9
|
132.4
|
134.5
|
116.1
|
118
|
121.4
|
125.1
|
128.9
|
132.4
|
134.5
|
|
50th
|
94
|
94
|
95
|
97
|
98
|
98
|
99
|
56
|
56
|
57
|
58
|
58
|
59
|
59
|
|
90th
|
106
|
107
|
108
|
109
|
110
|
111
|
111
|
68
|
68
|
69
|
70
|
70
|
71
|
71
|
|
95th
|
110
|
110
|
111
|
112
|
114
|
115
|
116
|
71
|
71
|
72
|
73
|
73
|
74
|
74
|
|
95th + 12 mm?Hg
|
122
|
122
|
123
|
124
|
126
|
127
|
128
|
83
|
83
|
84
|
85
|
85
|
86
|
86
|
|
8
|
Height (in)
|
47.8
|
48.6
|
50
|
51.6
|
53.2
|
54.6
|
55.5
|
47.8
|
48.6
|
50
|
51.6
|
53.2
|
54.6
|
55.5
|
|
Height (cm)
|
121.4
|
123.5
|
127
|
131
|
135.1
|
138.8
|
141
|
121.4
|
123.5
|
127
|
131
|
135.1
|
138.8
|
141
|
|
50th
|
95
|
96
|
97
|
98
|
99
|
99
|
100
|
57
|
57
|
58
|
59
|
59
|
60
|
60
|
|
90th
|
107
|
108
|
109
|
110
|
111
|
112
|
112
|
69
|
70
|
70
|
71
|
72
|
72
|
73
|
|
95th
|
111
|
112
|
112
|
114
|
115
|
116
|
117
|
72
|
73
|
73
|
74
|
75
|
75
|
75
|
|
95th + 12 mm?Hg
|
123
|
124
|
124
|
126
|
127
|
128
|
129
|
84
|
85
|
85
|
86
|
87
|
87
|
87
|
|
9
|
Height (in)
|
49.6
|
50.5
|
52
|
53.7
|
55.4
|
56.9
|
57.9
|
49.6
|
50.5
|
52
|
53.7
|
55.4
|
56.9
|
57.9
|
|
Height (cm)
|
126
|
128.3
|
132.1
|
136.3
|
140.7
|
144.7
|
147.1
|
126
|
128.3
|
132.1
|
136.3
|
140.7
|
144.7
|
147.1
|
|
50th
|
96
|
97
|
98
|
99
|
100
|
101
|
101
|
57
|
58
|
59
|
60
|
61
|
62
|
62
|
|
90th
|
107
|
108
|
109
|
110
|
112
|
113
|
114
|
70
|
71
|
72
|
73
|
74
|
74
|
74
|
|
95th
|
112
|
112
|
113
|
115
|
116
|
118
|
119
|
74
|
74
|
75
|
76
|
76
|
77
|
77
|
|
95th + 12 mm?Hg
|
124
|
124
|
125
|
127
|
128
|
130
|
131
|
86
|
86
|
87
|
88
|
88
|
89
|
89
|
|
10
|
Height (in)
|
51.3
|
52.2
|
53.8
|
55.6
|
57.4
|
59.1
|
60.1
|
51.3
|
52.2
|
53.8
|
55.6
|
57.4
|
59.1
|
60.1
|
|
Height (cm)
|
130.2
|
132.7
|
136.7
|
141.3
|
145.9
|
150.1
|
152.7
|
130.2
|
132.7
|
136.7
|
141.3
|
145.9
|
150.1
|
152.7
|
|
50th
|
97
|
98
|
99
|
100
|
101
|
102
|
103
|
59
|
60
|
61
|
62
|
63
|
63
|
64
|
|
90th
|
108
|
109
|
111
|
112
|
113
|
115
|
116
|
72
|
73
|
74
|
74
|
75
|
75
|
76
|
|
95th
|
112
|
113
|
114
|
116
|
118
|
120
|
121
|
76
|
76
|
77
|
77
|
78
|
78
|
78
|
|
95th + 12 mm?Hg
|
124
|
125
|
126
|
128
|
130
|
132
|
133
|
88
|
88
|
89
|
89
|
90
|
90
|
90
|
|
11
|
Height (in)
|
53
|
54
|
55.7
|
57.6
|
59.6
|
61.3
|
62.4
|
53
|
54
|
55.7
|
57.6
|
59.6
|
61.3
|
62.4
|
|
Height (cm)
|
134.7
|
137.3
|
141.5
|
146.4
|
151.3
|
155.8
|
158.6
|
134.7
|
137.3
|
141.5
|
146.4
|
151.3
|
155.8
|
158.6
|
|
50th
|
99
|
99
|
101
|
102
|
103
|
104
|
106
|
61
|
61
|
62
|
63
|
63
|
63
|
63
|
|
90th
|
110
|
111
|
112
|
114
|
116
|
117
|
118
|
74
|
74
|
75
|
75
|
75
|
76
|
76
|
|
95th
|
114
|
114
|
116
|
118
|
120
|
123
|
124
|
77
|
78
|
78
|
78
|
78
|
78
|
78
|
|
95th + 12 mm?Hg
|
126
|
126
|
128
|
130
|
132
|
135
|
136
|
89
|
90
|
90
|
90
|
90
|
90
|
90
|
|
12
|
Height (in)
|
55.2
|
56.3
|
58.1
|
60.1
|
62.2
|
64
|
65.2
|
55.2
|
56.3
|
58.1
|
60.1
|
62.2
|
64
|
65.2
|
|
Height (cm)
|
140.3
|
143
|
147.5
|
152.7
|
157.9
|
162.6
|
165.5
|
140.3
|
143
|
147.5
|
152.7
|
157.9
|
162.6
|
165.5
|
|
50th
|
101
|
101
|
102
|
104
|
106
|
108
|
109
|
61
|
62
|
62
|
62
|
62
|
63
|
63
|
|
90th
|
113
|
114
|
115
|
117
|
119
|
121
|
122
|
75
|
75
|
75
|
75
|
75
|
76
|
76
|
|
95th
|
116
|
117
|
118
|
121
|
124
|
126
|
128
|
78
|
78
|
78
|
78
|
78
|
79
|
79
|
|
95th + 12 mm?Hg
|
128
|
129
|
130
|
133
|
136
|
138
|
140
|
90
|
90
|
90
|
90
|
90
|
91
|
91
|
|
13
|
Height (in)
|
57.9
|
59.1
|
61
|
63.1
|
65.2
|
67.1
|
68.3
|
57.9
|
59.1
|
61
|
63.1
|
65.2
|
67.1
|
68.3
|
|
Height (cm)
|
147
|
150
|
154.9
|
160.3
|
165.7
|
170.5
|
173.4
|
147
|
150
|
154.9
|
160.3
|
165.7
|
170.5
|
173.4
|
|
50th
|
103
|
104
|
105
|
108
|
110
|
111
|
112
|
61
|
60
|
61
|
62
|
63
|
64
|
65
|
|
90th
|
115
|
116
|
118
|
121
|
124
|
126
|
126
|
74
|
74
|
74
|
75
|
76
|
77
|
77
|
|
95th
|
119
|
120
|
122
|
125
|
128
|
130
|
131
|
78
|
78
|
78
|
78
|
80
|
81
|
81
|
|
95th and 12 mm?Hg
|
131
|
132
|
134
|
137
|
140
|
142
|
143
|
90
|
90
|
90
|
90
|
92
|
93
|
93
|
|
14
|
Height (in)
|
60.6
|
61.8
|
63.8
|
65.9
|
68.0
|
69.8
|
70.9
|
60.6
|
61.8
|
63.8
|
65.9
|
68.0
|
69.8
|
70.9
|
|
Height (cm)
|
153.8
|
156.9
|
162
|
167.5
|
172.7
|
177.4
|
180.1
|
153.8
|
156.9
|
162
|
167.5
|
172.7
|
177.4
|
180.1
|
|
50th
|
105
|
106
|
109
|
111
|
112
|
113
|
113
|
60
|
60
|
62
|
64
|
65
|
66
|
67
|
|
90th
|
119
|
120
|
123
|
126
|
127
|
128
|
129
|
74
|
74
|
75
|
77
|
78
|
79
|
80
|
|
95th
|
123
|
125
|
127
|
130
|
132
|
133
|
134
|
77
|
78
|
79
|
81
|
82
|
83
|
84
|
|
95th and 12 mm?Hg
|
135
|
137
|
139
|
142
|
144
|
145
|
146
|
89
|
90
|
91
|
93
|
94
|
95
|
96
|
|
15
|
Height (in)
|
62.6
|
63.8
|
65.7
|
67.8
|
69.8
|
71.5
|
72.5
|
62.6
|
63.8
|
65.7
|
67.8
|
69.8
|
71.5
|
72.5
|
|
Height (cm)
|
159
|
162
|
166.9
|
172.2
|
177.2
|
181.6
|
184.2
|
159
|
162
|
166.9
|
172.2
|
177.2
|
181.6
|
184.2
|
|
50th
|
108
|
110
|
112
|
113
|
114
|
114
|
114
|
61
|
62
|
64
|
65
|
66
|
67
|
68
|
|
90th
|
123
|
124
|
126
|
128
|
129
|
130
|
130
|
75
|
76
|
78
|
79
|
80
|
81
|
81
|
|
95th
|
127
|
129
|
131
|
132
|
134
|
135
|
135
|
78
|
79
|
81
|
83
|
84
|
85
|
85
|
|
95th and 12 mm?Hg
|
139
|
141
|
143
|
144
|
146
|
147
|
147
|
90
|
91
|
93
|
95
|
96
|
97
|
97
|
|
16
|
Height (in)
|
63.8
|
64.9
|
66.8
|
68.8
|
70.7
|
72.4
|
73.4
|
63.8
|
64.9
|
66.8
|
68.8
|
70.7
|
72.4
|
73.4
|
|
Height (cm)
|
162.1
|
165
|
169.6
|
174.6
|
179.5
|
183.8
|
186.4
|
162.1
|
165
|
169.6
|
174.6
|
179.5
|
183.8
|
186.4
|
|
50th
|
111
|
112
|
114
|
115
|
115
|
116
|
116
|
63
|
64
|
66
|
67
|
68
|
69
|
69
|
|
90th
|
126
|
127
|
128
|
129
|
131
|
131
|
132
|
77
|
78
|
79
|
80
|
81
|
82
|
82
|
|
95th
|
130
|
131
|
133
|
134
|
135
|
136
|
137
|
80
|
81
|
83
|
84
|
85
|
86
|
86
|
|
95th and 12 mm?Hg
|
142
|
143
|
145
|
146
|
147
|
148
|
149
|
92
|
93
|
95
|
96
|
97
|
98
|
98
|
|
17
|
Height (in)
|
64.5
|
65.5
|
67.3
|
69.2
|
71.1
|
72.8
|
73.8
|
64.5
|
65.5
|
67.3
|
69.2
|
71.1
|
72.8
|
73.8
|
|
Height (cm)
|
163.8
|
166.5
|
170.9
|
175.8
|
180.7
|
184.9
|
187.5
|
163.8
|
166.5
|
170.9
|
175.8
|
180.7
|
184.9
|
187.5
|
|
50th
|
114
|
115
|
116
|
117
|
117
|
118
|
118
|
65
|
66
|
67
|
68
|
69
|
70
|
70
|
|
90th
|
128
|
129
|
130
|
131
|
132
|
133
|
134
|
78
|
79
|
80
|
81
|
82
|
82
|
83
|
|
95th
|
132
|
133
|
134
|
135
|
137
|
138
|
138
|
81
|
82
|
84
|
85
|
86
|
86
|
87
|
|
95th and 12 mm?Hg
|
144
|
145
|
146
|
147
|
149
|
150
|
150
|
93
|
94
|
96
|
97
|
98
|
98
|
99
|
BP Levels for Girls by Age and Height
Percentile
|
Age (y)
|
BP Percentile
|
SBP (mm?Hg)
|
DBP (mm?Hg)
|
|
Height Percentile or Measured Height
|
Height Percentile or Measured Height
|
|
5%
|
10%
|
25%
|
50%
|
75%
|
90%
|
95%
|
5%
|
10%
|
25%
|
50%
|
75%
|
90%
|
95%
|
|
1
|
Height (in)
|
29.7
|
30.2
|
30.9
|
31.8
|
32.7
|
33.4
|
33.9
|
29.7
|
30.2
|
30.9
|
31.8
|
32.7
|
33.4
|
33.9
|
|
Height (cm)
|
75.4
|
76.6
|
78.6
|
80.8
|
83
|
84.9
|
86.1
|
75.4
|
76.6
|
78.6
|
80.8
|
83
|
84.9
|
86.1
|
|
50th
|
84
|
85
|
86
|
86
|
87
|
88
|
88
|
41
|
42
|
42
|
43
|
44
|
45
|
46
|
|
90th
|
98
|
99
|
99
|
100
|
101
|
102
|
102
|
54
|
55
|
56
|
56
|
57
|
58
|
58
|
|
95th
|
101
|
102
|
102
|
103
|
104
|
105
|
105
|
59
|
59
|
60
|
60
|
61
|
62
|
62
|
|
95th + 12 mm?Hg
|
113
|
114
|
114
|
115
|
116
|
117
|
117
|
71
|
71
|
72
|
72
|
73
|
74
|
74
|
|
2
|
Height (in)
|
33.4
|
34
|
34.9
|
35.9
|
36.9
|
37.8
|
38.4
|
33.4
|
34
|
34.9
|
35.9
|
36.9
|
37.8
|
38.4
|
|
Height (cm)
|
84.9
|
86.3
|
88.6
|
91.1
|
93.7
|
96
|
97.4
|
84.9
|
86.3
|
88.6
|
91.1
|
93.7
|
96
|
97.4
|
|
50th
|
87
|
87
|
88
|
89
|
90
|
91
|
91
|
45
|
46
|
47
|
48
|
49
|
50
|
51
|
|
90th
|
101
|
101
|
102
|
103
|
104
|
105
|
106
|
58
|
58
|
59
|
60
|
61
|
62
|
62
|
|
95th
|
104
|
105
|
106
|
106
|
107
|
108
|
109
|
62
|
63
|
63
|
64
|
65
|
66
|
66
|
|
95th + 12 mm?Hg
|
116
|
117
|
118
|
118
|
119
|
120
|
121
|
74
|
75
|
75
|
76
|
77
|
78
|
78
|
|
3
|
Height (in)
|
35.8
|
36.4
|
37.3
|
38.4
|
39.6
|
40.6
|
41.2
|
35.8
|
36.4
|
37.3
|
38.4
|
39.6
|
40.6
|
41.2
|
|
Height (cm)
|
91
|
92.4
|
94.9
|
97.6
|
100.5
|
103.1
|
104.6
|
91
|
92.4
|
94.9
|
97.6
|
100.5
|
103.1
|
104.6
|
|
50th
|
88
|
89
|
89
|
90
|
91
|
92
|
93
|
48
|
48
|
49
|
50
|
51
|
53
|
53
|
|
90th
|
102
|
103
|
104
|
104
|
105
|
106
|
107
|
60
|
61
|
61
|
62
|
63
|
64
|
65
|
|
95th
|
106
|
106
|
107
|
108
|
109
|
110
|
110
|
64
|
65
|
65
|
66
|
67
|
68
|
69
|
|
95th + 12 mm?Hg
|
118
|
118
|
119
|
120
|
121
|
122
|
122
|
76
|
77
|
77
|
78
|
79
|
80
|
81
|
|
4
|
Height (in)
|
38.3
|
38.9
|
39.9
|
41.1
|
42.4
|
43.5
|
44.2
|
38.3
|
38.9
|
39.9
|
41.1
|
42.4
|
43.5
|
44.2
|
|
Height (cm)
|
97.2
|
98.8
|
101.4
|
104.5
|
107.6
|
110.5
|
112.2
|
97.2
|
98.8
|
101.4
|
104.5
|
107.6
|
110.5
|
112.2
|
|
50th
|
89
|
90
|
91
|
92
|
93
|
94
|
94
|
50
|
51
|
51
|
53
|
54
|
55
|
55
|
|
90th
|
103
|
104
|
105
|
106
|
107
|
108
|
108
|
62
|
63
|
64
|
65
|
66
|
67
|
67
|
|
95th
|
107
|
108
|
109
|
109
|
110
|
111
|
112
|
66
|
67
|
68
|
69
|
70
|
70
|
71
|
|
95th + 12 mm?Hg
|
119
|
120
|
121
|
121
|
122
|
123
|
124
|
78
|
79
|
80
|
81
|
82
|
82
|
83
|
|
5
|
Height (in)
|
40.8
|
41.5
|
42.6
|
43.9
|
45.2
|
46.5
|
47.3
|
40.8
|
41.5
|
42.6
|
43.9
|
45.2
|
46.5
|
47.3
|
|
Height (cm)
|
103.6
|
105.3
|
108.2
|
111.5
|
114.9
|
118.1
|
120
|
103.6
|
105.3
|
108.2
|
111.5
|
114.9
|
118.1
|
120
|
|
50th
|
90
|
91
|
92
|
93
|
94
|
95
|
96
|
52
|
52
|
53
|
55
|
56
|
57
|
57
|
|
90th
|
104
|
105
|
106
|
107
|
108
|
109
|
110
|
64
|
65
|
66
|
67
|
68
|
69
|
70
|
|
95th
|
108
|
109
|
109
|
110
|
111
|
112
|
113
|
68
|
69
|
70
|
71
|
72
|
73
|
73
|
|
95th + 12 mm?Hg
|
120
|
121
|
121
|
122
|
123
|
124
|
125
|
80
|
81
|
82
|
83
|
84
|
85
|
85
|
|
6
|
Height (in)
|
43.3
|
44
|
45.2
|
46.6
|
48.1
|
49.4
|
50.3
|
43.3
|
44
|
45.2
|
46.6
|
48.1
|
49.4
|
50.3
|
|
Height (cm)
|
110
|
111.8
|
114.9
|
118.4
|
122.1
|
125.6
|
127.7
|
110
|
111.8
|
114.9
|
118.4
|
122.1
|
125.6
|
127.7
|
|
50th
|
92
|
92
|
93
|
94
|
96
|
97
|
97
|
54
|
54
|
55
|
56
|
57
|
58
|
59
|
|
90th
|
105
|
106
|
107
|
108
|
109
|
110
|
111
|
67
|
67
|
68
|
69
|
70
|
71
|
71
|
|
95th
|
109
|
109
|
110
|
111
|
112
|
113
|
114
|
70
|
71
|
72
|
72
|
73
|
74
|
74
|
|
95th + 12 mm?Hg
|
121
|
121
|
122
|
123
|
124
|
125
|
126
|
82
|
83
|
84
|
84
|
85
|
86
|
86
|
|
7
|
Height (in)
|
45.6
|
46.4
|
47.7
|
49.2
|
50.7
|
52.1
|
53
|
45.6
|
46.4
|
47.7
|
49.2
|
50.7
|
52.1
|
53
|
|
Height (cm)
|
115.9
|
117.8
|
121.1
|
124.9
|
128.8
|
132.5
|
134.7
|
115.9
|
117.8
|
121.1
|
124.9
|
128.8
|
132.5
|
134.7
|
|
50th
|
92
|
93
|
94
|
95
|
97
|
98
|
99
|
55
|
55
|
56
|
57
|
58
|
59
|
60
|
|
90th
|
106
|
106
|
107
|
109
|
110
|
111
|
112
|
68
|
68
|
69
|
70
|
71
|
72
|
72
|
|
95th
|
109
|
110
|
111
|
112
|
113
|
114
|
115
|
72
|
72
|
73
|
73
|
74
|
74
|
75
|
|
95th + 12 mm?Hg
|
121
|
122
|
123
|
124
|
125
|
126
|
127
|
84
|
84
|
85
|
85
|
86
|
86
|
87
|
|
8
|
Height (in)
|
47.6
|
48.4
|
49.8
|
51.4
|
53
|
54.5
|
55.5
|
47.6
|
48.4
|
49.8
|
51.4
|
53
|
54.5
|
55.5
|
|
Height (cm)
|
121
|
123
|
126.5
|
130.6
|
134.7
|
138.5
|
140.9
|
121
|
123
|
126.5
|
130.6
|
134.7
|
138.5
|
140.9
|
|
50th
|
93
|
94
|
95
|
97
|
98
|
99
|
100
|
56
|
56
|
57
|
59
|
60
|
61
|
61
|
|
90th
|
107
|
107
|
108
|
110
|
111
|
112
|
113
|
69
|
70
|
71
|
72
|
72
|
73
|
73
|
|
95th
|
110
|
111
|
112
|
113
|
115
|
116
|
117
|
72
|
73
|
74
|
74
|
75
|
75
|
75
|
|
95th + 12 mm?Hg
|
122
|
123
|
124
|
125
|
127
|
128
|
129
|
84
|
85
|
86
|
86
|
87
|
87
|
87
|
|
9
|
Height (in)
|
49.3
|
50.2
|
51.7
|
53.4
|
55.1
|
56.7
|
57.7
|
49.3
|
50.2
|
51.7
|
53.4
|
55.1
|
56.7
|
57.7
|
|
Height (cm)
|
125.3
|
127.6
|
131.3
|
135.6
|
140.1
|
144.1
|
146.6
|
125.3
|
127.6
|
131.3
|
135.6
|
140.1
|
144.1
|
146.6
|
|
50th
|
95
|
95
|
97
|
98
|
99
|
100
|
101
|
57
|
58
|
59
|
60
|
60
|
61
|
61
|
|
90th
|
108
|
108
|
109
|
111
|
112
|
113
|
114
|
71
|
71
|
72
|
73
|
73
|
73
|
73
|
|
95th
|
112
|
112
|
113
|
114
|
116
|
117
|
118
|
74
|
74
|
75
|
75
|
75
|
75
|
75
|
|
95th + 12 mm?Hg
|
124
|
124
|
125
|
126
|
128
|
129
|
130
|
86
|
86
|
87
|
87
|
87
|
87
|
87
|
|
10
|
Height (in)
|
51.1
|
52
|
53.7
|
55.5
|
57.4
|
59.1
|
60.2
|
51.1
|
52
|
53.7
|
55.5
|
57.4
|
59.1
|
60.2
|
|
Height (cm)
|
129.7
|
132.2
|
136.3
|
141
|
145.8
|
150.2
|
152.8
|
129.7
|
132.2
|
136.3
|
141
|
145.8
|
150.2
|
152.8
|
|
50th
|
96
|
97
|
98
|
99
|
101
|
102
|
103
|
58
|
59
|
59
|
60
|
61
|
61
|
62
|
|
90th
|
109
|
110
|
111
|
112
|
113
|
115
|
116
|
72
|
73
|
73
|
73
|
73
|
73
|
73
|
|
95th
|
113
|
114
|
114
|
116
|
117
|
119
|
120
|
75
|
75
|
76
|
76
|
76
|
76
|
76
|
|
95th + 12 mm?Hg
|
125
|
126
|
126
|
128
|
129
|
131
|
132
|
87
|
87
|
88
|
88
|
88
|
88
|
88
|
|
11
|
Height (in)
|
53.4
|
54.5
|
56.2
|
58.2
|
60.2
|
61.9
|
63
|
53.4
|
54.5
|
56.2
|
58.2
|
60.2
|
61.9
|
63
|
|
Height (cm)
|
135.6
|
138.3
|
142.8
|
147.8
|
152.8
|
157.3
|
160
|
135.6
|
138.3
|
142.8
|
147.8
|
152.8
|
157.3
|
160
|
|
50th
|
98
|
99
|
101
|
102
|
104
|
105
|
106
|
60
|
60
|
60
|
61
|
62
|
63
|
64
|
|
90th
|
111
|
112
|
113
|
114
|
116
|
118
|
120
|
74
|
74
|
74
|
74
|
74
|
75
|
75
|
|
95th
|
115
|
116
|
117
|
118
|
120
|
123
|
124
|
76
|
77
|
77
|
77
|
77
|
77
|
77
|
|
95th + 12 mm?Hg
|
127
|
128
|
129
|
130
|
132
|
135
|
136
|
88
|
89
|
89
|
89
|
89
|
89
|
89
|
|
12
|
Height (in)
|
56.2
|
57.3
|
59
|
60.9
|
62.8
|
64.5
|
65.5
|
56.2
|
57.3
|
59
|
60.9
|
62.8
|
64.5
|
65.5
|
|
Height (cm)
|
142.8
|
145.5
|
149.9
|
154.8
|
159.6
|
163.8
|
166.4
|
142.8
|
145.5
|
149.9
|
154.8
|
159.6
|
163.8
|
166.4
|
|
50th
|
102
|
102
|
104
|
105
|
107
|
108
|
108
|
61
|
61
|
61
|
62
|
64
|
65
|
65
|
|
90th
|
114
|
115
|
116
|
118
|
120
|
122
|
122
|
75
|
75
|
75
|
75
|
76
|
76
|
76
|
|
95th
|
118
|
119
|
120
|
122
|
124
|
125
|
126
|
78
|
78
|
78
|
78
|
79
|
79
|
79
|
|
95th and 12 mm?Hg
|
130
|
131
|
132
|
134
|
136
|
137
|
138
|
90
|
90
|
90
|
90
|
91
|
91
|
91
|
|
13
|
Height (in)
|
58.3
|
59.3
|
60.9
|
62.7
|
64.5
|
66.1
|
67
|
58.3
|
59.3
|
60.9
|
62.7
|
64.5
|
66.1
|
67
|
|
Height (cm)
|
148.1
|
150.6
|
154.7
|
159.2
|
163.7
|
167.8
|
170.2
|
148.1
|
150.6
|
154.7
|
159.2
|
163.7
|
167.8
|
170.2
|
|
50th
|
104
|
105
|
106
|
107
|
108
|
108
|
109
|
62
|
62
|
63
|
64
|
65
|
65
|
66
|
|
90th
|
116
|
117
|
119
|
121
|
122
|
123
|
123
|
75
|
75
|
75
|
76
|
76
|
76
|
76
|
|
95th
|
121
|
122
|
123
|
124
|
126
|
126
|
127
|
79
|
79
|
79
|
79
|
80
|
80
|
81
|
|
95th + 12 mm?Hg
|
133
|
134
|
135
|
136
|
138
|
138
|
139
|
91
|
91
|
91
|
91
|
92
|
92
|
93
|
|
14
|
Height (in)
|
59.3
|
60.2
|
61.8
|
63.5
|
65.2
|
66.8
|
67.7
|
59.3
|
60.2
|
61.8
|
63.5
|
65.2
|
66.8
|
67.7
|
|
Height (cm)
|
150.6
|
153
|
156.9
|
161.3
|
165.7
|
169.7
|
172.1
|
150.6
|
153
|
156.9
|
161.3
|
165.7
|
169.7
|
172.1
|
|
50th
|
105
|
106
|
107
|
108
|
109
|
109
|
109
|
63
|
63
|
64
|
65
|
66
|
66
|
66
|
|
90th
|
118
|
118
|
120
|
122
|
123
|
123
|
123
|
76
|
76
|
76
|
76
|
77
|
77
|
77
|
|
95th
|
123
|
123
|
124
|
125
|
126
|
127
|
127
|
80
|
80
|
80
|
80
|
81
|
81
|
82
|
|
95th + 12 mm?Hg
|
135
|
135
|
136
|
137
|
138
|
139
|
139
|
92
|
92
|
92
|
92
|
93
|
93
|
94
|
|
15
|
Height (in)
|
59.7
|
60.6
|
62.2
|
63.9
|
65.6
|
67.2
|
68.1
|
59.7
|
60.6
|
62.2
|
63.9
|
65.6
|
67.2
|
68.1
|
|
Height (cm)
|
151.7
|
154
|
157.9
|
162.3
|
166.7
|
170.6
|
173
|
151.7
|
154
|
157.9
|
162.3
|
166.7
|
170.6
|
173
|
|
50th
|
105
|
106
|
107
|
108
|
109
|
109
|
109
|
64
|
64
|
64
|
65
|
66
|
67
|
67
|
|
90th
|
118
|
119
|
121
|
122
|
123
|
123
|
124
|
76
|
76
|
76
|
77
|
77
|
78
|
78
|
|
95th
|
124
|
124
|
125
|
126
|
127
|
127
|
128
|
80
|
80
|
80
|
81
|
82
|
82
|
82
|
|
95th + 12 mm?Hg
|
136
|
136
|
137
|
138
|
139
|
139
|
140
|
92
|
92
|
92
|
93
|
94
|
94
|
94
|
|
16
|
Height (in)
|
59.9
|
60.8
|
62.4
|
64.1
|
65.8
|
67.3
|
68.3
|
59.9
|
60.8
|
62.4
|
64.1
|
65.8
|
67.3
|
68.3
|
|
Height (cm)
|
152.1
|
154.5
|
158.4
|
162.8
|
167.1
|
171.1
|
173.4
|
152.1
|
154.5
|
158.4
|
162.8
|
167.1
|
171.1
|
173.4
|
|
50th
|
106
|
107
|
108
|
109
|
109
|
110
|
110
|
64
|
64
|
65
|
66
|
66
|
67
|
67
|
|
90th
|
119
|
120
|
122
|
123
|
124
|
124
|
124
|
76
|
76
|
76
|
77
|
78
|
78
|
78
|
|
95th
|
124
|
125
|
125
|
127
|
127
|
128
|
128
|
80
|
80
|
80
|
81
|
82
|
82
|
82
|
|
95th + 12 mm?Hg
|
136
|
137
|
137
|
139
|
139
|
140
|
140
|
92
|
92
|
92
|
93
|
94
|
94
|
94
|
|
17
|
Height (in)
|
60.0
|
60.9
|
62.5
|
64.2
|
65.9
|
67.4
|
68.4
|
60.0
|
60.9
|
62.5
|
64.2
|
65.9
|
67.4
|
68.4
|
|
Height (cm)
|
152.4
|
154.7
|
158.7
|
163.0
|
167.4
|
171.3
|
173.7
|
152.4
|
154.7
|
158.7
|
163.0
|
167.4
|
171.3
|
173.7
|
|
50th
|
107
|
108
|
109
|
110
|
110
|
110
|
111
|
64
|
64
|
65
|
66
|
66
|
66
|
67
|
|
90th
|
120
|
121
|
123
|
124
|
124
|
125
|
125
|
76
|
76
|
77
|
77
|
78
|
78
|
78
|
|
95th
|
125
|
125
|
126
|
127
|
128
|
128
|
128
|
80
|
80
|
80
|
81
|
82
|
82
|
82
|
|
95th + 12 mm?Hg
|
137
|
137
|
138
|
139
|
140
|
140
|
140
|
92
|
92
|
92
|
93
|
94
|
94
|
94
|
SECTION 2: WHO GROWTH CHARTS FOR CHILDREN
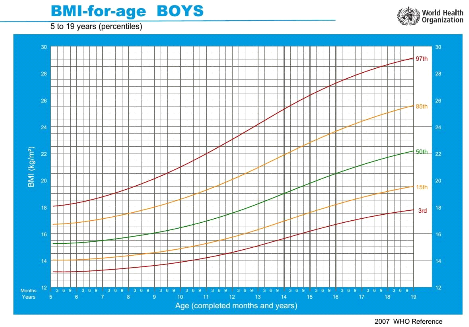
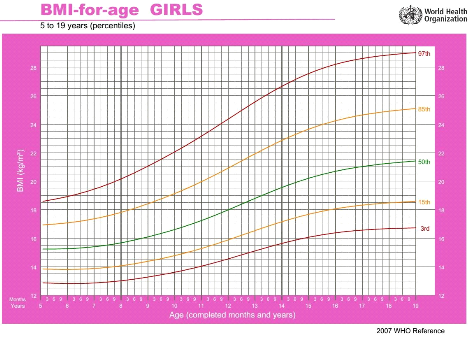
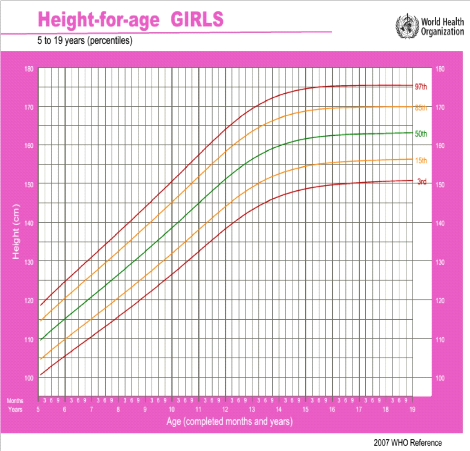
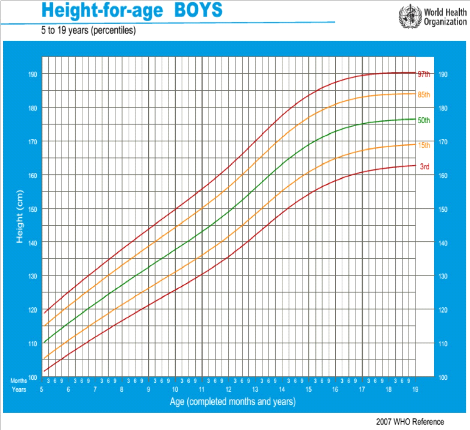
APPENDIX IV
MISCELLANEOUS
Indications for Blood Pressure Monitoring in Children
< 3years
· History of prematurity, very low birth weight, or other
neonatal complication requiring intensive care
· Congenital heart disease (repaired or not)
· Recurrent urinary tract infections, hematuria, or
proteinuria
· Known renal disease or urologic malformations
· Family history of congenital renal disease
· Solid organ transplant
· Malignancy or bone marrow transplant
· Treatment with drugs known to raise BP
· Other systemic illnesses associated with hypertension
(neurofibromatosis, tuberous sclerosis, etc.)
· Evidence of elevated intracranial pressure
Table I: Laboratory Tests for the Child with
Hypertension
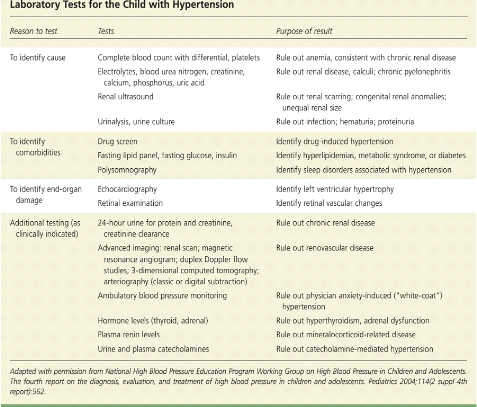
Table II: Antihypertensive medications with FDA approval
for use in children
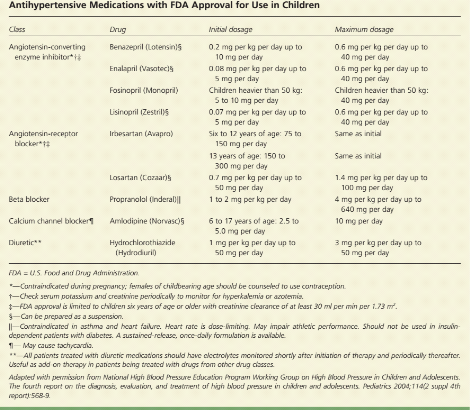
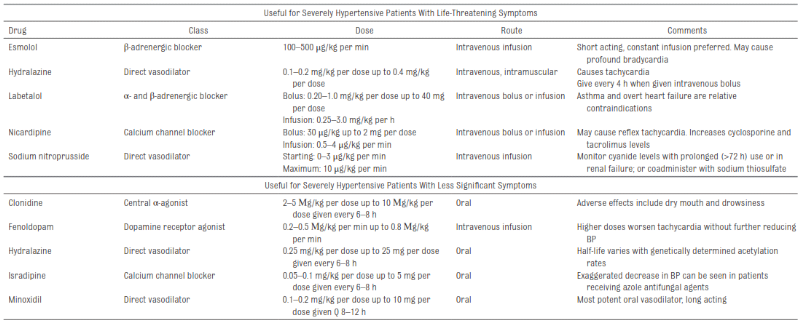
Table III: Oral and Intravenous Antihypertensive
Medications for Acute Severe HTN
Table IV: Kuppuswamy's socio-economic status scale
-revision for 2015
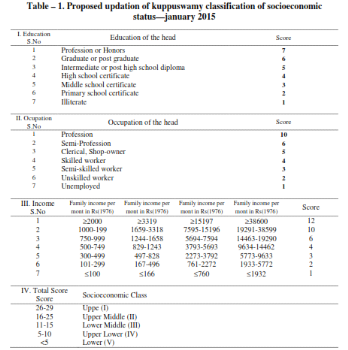
APPENDIX V
AUTHORIZATIONS

| 
