4.2 Calculation of the Historical Results Using the
Data from CERFRANCE Isère
The objective of these calculations is to see if the
hypothesis of the traditionalist's approach is verified in agriculture: does
the performance of the firm increases with leverage? Therefore, the results of
firms divided in 5 groups of leverage were analyzed (group 1 high leverages,
group 5 lowest leverages. See section 3.2.4 page 31 for details).
4.2.1 Normality of the Datasets
Figure 14 presents the distribution of values for ROE to
compare it with a normal distribution. The distribution does not fit with the
normal distribution line looking at the histogram, because the central values
have an abnormally high frequency. This impression is confirmed by the
KolmogorovSmirnov test, because the P-Value is lower than 0.000. We can reject
with 99% confidence that ROE comes from a normal distribution. The Shapiro-Wilk
test cannot be performed because the sample is bigger than 2000 values.
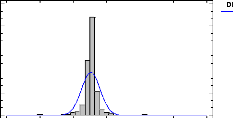
Figure 14: histogram of frequency for ROE
The distributions of ROE have been tested for each year's
separately, and within each year's for each
production either. Over the 25
tests, ROE could come from a normal distribution only for dairy
Dstrbuon
Normal
producers and cattle producers in 2010. Therefore, only the
Kruskal-Wallis and Mood's Median tests were used to analyze ROE, and the
results of the Anova's were not presented.
Figure 15 presents a histogram of the frequency of the
distribution for ROA to compare it with a normal distribution. From a graphic
perspective, it seems that ROA is closer than ROE to a normal distribution, as
the normal distribution line is closer to the frequency histogram. However, the
Kolmogorov-Smirnov test P-Value was lower than 0.000 as well, therefore we can
also reject at 99% confidence that ROA comes from a normal distribution.
-3 -1 1 3 5 7


Figure 15: Histogram of frequency for ROA
Same as the ROE, the distributions of ROA have been tested for
each year and within each year for each production separately. All the tests
performed reported the same results: ROA does not come from a normal
distribution at 99% confidence. Therefore, only the results of the
Kruskal-Wallis and Mood's Median tests were discussed for ROA.
4.2.2 ROE
4.2.2.1 ROE Tested by Time and Specialization
The dataset have been tested first to see if time had an effect
on ROE. The results of the Mood's
median and Kruskal-Wallis tests were quite
logical: as someone could have predicted, time has a
significant effect on
the ROE, with really low P-Values. The years 2006 and 2009 were two years of
isra A
bad results for farmers in Isère. The price of
agricultural commodities soared in 2007 and 2008,
explaining that these two
years were better. The effect was similar in 2010, when commodity prices
Dstributon
recovered from the severe fall of 2009. .
Mood's Median Test for ROE by YEAR Total n =
2840
Grand median = 0,0583012
|
YEAR
|
Sample Size
|
n<=
|
n>
|
Median
|
90,0% lower CL
|
90,0% upper CL
|
|
2006
|
568
|
326
|
242
|
0,0195117
|
0,00305438
|
0,041546
|
|
2007
|
568
|
245
|
323
5
|
0,0910952
55
|
0,0759334
|
0,110756
|
|
2008
|
568
|
250
|
318
|
0,0837851
|
0,065602
|
0,0957051
|
|
2009
|
568
|
328
|
240
|
0,0176906
|
0,00193535
|
0,0337506
|
|
2010
|
568
|
271
|
297
|
0,0734001
|
0,0512998
|
0,091961
|
Test statistic = 46,0986 P-Value = 2,3492E-9
Kruskal-Wallis Test for ROE by YEAR
|
YEAR
|
Sample Size
|
Average Rank
|
|
2006
|
568
|
1275,31
|
|
2007
|
568
|
1547,93
|
|
2008
|
568
|
1517,84
|
|
2009
|
568
|
1287,11
|
|
2010
|
568
|
1474,32
|
Test statistic = 57,0073 P-Value = 1,2328E-11
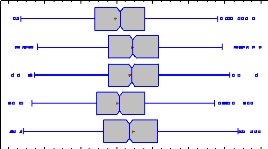
Figure 16: Box and whisker plots with median notch for
ROE by year (means are shown with a red cross)
Figure 16 presents the box and whisker plots with median notch
at 90% confidence intervals, showing that the results of the years 2006 and
2009 were significantly lower than in 2007, 2008 or 2010. Therefore, in order
to isolate the time effect, ROE has to be analyzed year by year.
ROE has been analyzed by specialization:
- Dairy production,
- Cattle ranching,
Bnd
- Grain production,
- Diversified production.
Mood's Median Test for ROE by SPECIALIZATION
Total n = 2840
Grand median = 0,0583012
|
SPECIALIZATION
|
Sample Size
|
n<=
|
n>
|
Median
|
90,0% lower CL
|
90,0% upper CL
|
|
Dairy
|
705
|
326
|
379
|
0,0747834
|
0,0595245
|
0,0896643
|
|
Cattle
|
225
|
154
|
71
|
-0,00274151
|
-0,0266764
|
0,0162487
|
|
Grains
|
630
|
299
|
331
|
0,0769898
|
0,0493805
|
0,103964
|
|
Diversified
|
1280
|
641
|
639
|
0,0580287
|
0,0458927
|
0,0699453
|
Test statistic = 36,2307 P-Value = 6,69281E-8
|
Dairy
Cattle
Grains
Diversified
|
|
Figure 17: Box and whisker plots with median notch for
ROE by specialization (means are shown with a red cross)
The Mood's median test for ROE by specialization illustrates
that the specialization has a significant impact on the ROE, with a really low
P-Value illustrating that we cannot reject the hypothesis that the medians are
different at 99% confidence. The cattle production has a median ROE lower than
the other productions. The P-Value for the Kruskal-Wallis test is 3,96451E-8,
giving the same results. Therefore, ROE was tested separately for each
specialization and each year, in order to isolate the effect of time and
specialization.
| 

