ANNEXES
ANNEXE 1 : De la stationnarité des
variables à la décomposition de la variance
1- Analyse de la stationnarité des variables
TEST ADF
PRIX DU COTON
ADF(1) d=0 avec constante
|
ADF Test Statistic
|
-3.890850
|
1% Critical Value*
|
-3.6496
|
|
|
5% Critical Value
|
-2.9558
|
|
|
10% Critical Value
|
-2.6164
|
|
*MacKinnon critical values for rejection of hypothesis of a unit
root.
|
|
|
|
|
|
|
|
|
|
|
|
Augmented Dickey-Fuller Test Equation
|
|
Dependent Variable: D(LPRC)
|
|
Method: Least Squares
|
|
Date: 04/19/06 Time: 21:34
|
|
Sample(adjusted): 1972 2003
|
|
Included observations: 32 after adjusting endpoints
|
|
Variable
|
Coefficient
|
Std. Error
|
t-Statistic
|
Prob.
|
|
LPRC(-1)
|
-0.586962
|
0.150857
|
-3.890850
|
0.0005
|
|
D(LPRC(-1))
|
0.056695
|
0.156408
|
0.362479
|
0.7196
|
|
C
|
2.484321
|
0.633789
|
3.919790
|
0.0005
|
|
R-squared
|
0.354284
|
Mean dependent var
|
0.019029
|
|
Adjusted R-squared
|
0.309752
|
S.D. dependent var
|
0.222224
|
|
S.E. of regression
|
0.184626
|
Akaike info criterion
|
-0.451904
|
|
Sum squared resid
|
0.988521
|
Schwarz criterion
|
-0.314492
|
|
Log likelihood
|
10.23047
|
F-statistic
|
7.955706
|
|
Durbin-Watson stat
|
2.048334
|
Prob(F-statistic)
|
0.001760
|
ADF(1) d=0 avec constante et trend
|
ADF Test Statistic
|
-3.816645
|
1% Critical Value*
|
-4.2712
|
|
|
5% Critical Value
|
-3.5562
|
|
|
10% Critical Value
|
-3.2109
|
|
*MacKinnon critical values for rejection of hypothesis of a unit
root.
|
|
|
|
|
|
|
|
|
|
|
|
Augmented Dickey-Fuller Test Equation
|
|
Dependent Variable: D(LPRC)
|
|
Method: Least Squares
|
|
Date: 04/19/06 Time: 21:37
|
|
Sample(adjusted): 1972 2003
|
|
Included observations: 32 after adjusting endpoints
|
|
Variable
|
Coefficient
|
Std. Error
|
t-Statistic
|
Prob.
|
|
LPRC(-1)
|
-0.578010
|
0.151445
|
-3.816645
|
0.0007
|
|
D(LPRC(-1))
|
0.022866
|
0.160764
|
0.142235
|
0.8879
|
|
C
|
2.507332
|
0.635475
|
3.945601
|
0.0005
|
|
@TREND(1970)
|
-0.003426
|
0.003633
|
-0.942832
|
0.3538
|
|
R-squared
|
0.374153
|
Mean dependent var
|
0.019029
|
|
Adjusted R-squared
|
0.307099
|
S.D. dependent var
|
0.222224
|
|
S.E. of regression
|
0.184981
|
Akaike info criterion
|
-0.420659
|
|
Sum squared resid
|
0.958103
|
Schwarz criterion
|
-0.237442
|
|
Log likelihood
|
10.73054
|
F-statistic
|
5.579802
|
|
Durbin-Watson stat
|
2.079191
|
Prob(F-statistic)
|
0.003949
|
ADF(1) d=0 ni constante ni trend
|
ADF Test Statistic
|
0.376847
|
1% Critical Value*
|
-2.6369
|
|
|
5% Critical Value
|
-1.9517
|
|
|
10% Critical Value
|
-1.6213
|
|
*MacKinnon critical values for rejection of hypothesis of a unit
root.
|
|
|
|
|
|
|
|
|
|
|
|
Augmented Dickey-Fuller Test Equation
|
|
Dependent Variable: D(LPRC)
|
|
Method: Least Squares
|
|
Date: 04/19/06 Time: 21:38
|
|
Sample(adjusted): 1972 2003
|
|
Included observations: 32 after adjusting endpoints
|
|
Variable
|
Coefficient
|
Std. Error
|
t-Statistic
|
Prob.
|
|
LPRC(-1)
|
0.003575
|
0.009486
|
0.376847
|
0.7089
|
|
D(LPRC(-1))
|
-0.129207
|
0.181248
|
-0.712872
|
0.4814
|
|
R-squared
|
0.012172
|
Mean dependent var
|
0.019029
|
|
Adjusted R-squared
|
-0.020756
|
S.D. dependent var
|
0.222224
|
|
S.E. of regression
|
0.224519
|
Akaike info criterion
|
-0.089255
|
|
Sum squared resid
|
1.512258
|
Schwarz criterion
|
0.002354
|
|
Log likelihood
|
3.428079
|
F-statistic
|
0.369655
|
|
Durbin-Watson stat
|
2.059941
|
Prob(F-statistic)
|
0.547768
|
ADF(3) d=0 avec constante
|
ADF Test Statistic
|
-2.153936
|
1% Critical Value*
|
-3.6661
|
|
|
5% Critical Value
|
-2.9627
|
|
|
10% Critical Value
|
-2.6200
|
|
*MacKinnon critical values for rejection of hypothesis of a unit
root.
|
|
|
|
|
|
|
|
|
|
|
|
Augmented Dickey-Fuller Test Equation
|
|
Dependent Variable: D(LPRC)
|
|
Method: Least Squares
|
|
Date: 04/19/06 Time: 21:43
|
|
Sample(adjusted): 1974 2003
|
|
Included observations: 30 after adjusting endpoints
|
|
Variable
|
Coefficient
|
Std. Error
|
t-Statistic
|
Prob.
|
|
LPRC(-1)
|
-0.483622
|
0.224530
|
-2.153936
|
0.0411
|
|
D(LPRC(-1))
|
-0.004410
|
0.198614
|
-0.022204
|
0.9825
|
|
D(LPRC(-2))
|
-0.169328
|
0.178103
|
-0.950730
|
0.3508
|
|
D(LPRC(-3))
|
0.170741
|
0.164437
|
1.038337
|
0.3091
|
|
C
|
2.041210
|
0.949371
|
2.150064
|
0.0414
|
|
R-squared
|
0.342753
|
Mean dependent var
|
-0.003746
|
|
Adjusted R-squared
|
0.237593
|
S.D. dependent var
|
0.206571
|
|
S.E. of regression
|
0.180369
|
Akaike info criterion
|
-0.436611
|
|
Sum squared resid
|
0.813326
|
Schwarz criterion
|
-0.203078
|
|
Log likelihood
|
11.54916
|
F-statistic
|
3.259363
|
|
Durbin-Watson stat
|
1.637849
|
Prob(F-statistic)
|
0.027836
|
ADF(3) d=0 avec constante et trend
|
ADF Test Statistic
|
-2.234711
|
1% Critical Value*
|
-4.2949
|
|
|
5% Critical Value
|
-3.5670
|
|
|
10% Critical Value
|
-3.2169
|
|
*MacKinnon critical values for rejection of hypothesis of a unit
root.
|
|
|
|
|
|
|
|
|
|
|
|
Augmented Dickey-Fuller Test Equation
|
|
Dependent Variable: D(LPRC)
|
|
Method: Least Squares
|
|
Date: 04/19/06 Time: 21:44
|
|
Sample(adjusted): 1974 2003
|
|
Included observations: 30 after adjusting endpoints
|
|
Variable
|
Coefficient
|
Std. Error
|
t-Statistic
|
Prob.
|
|
LPRC(-1)
|
-0.506474
|
0.226640
|
-2.234711
|
0.0350
|
|
D(LPRC(-1))
|
-0.039123
|
0.202837
|
-0.192881
|
0.8487
|
|
D(LPRC(-2))
|
-0.223665
|
0.188284
|
-1.187912
|
0.2465
|
|
D(LPRC(-3))
|
0.113067
|
0.176593
|
0.640270
|
0.5281
|
|
C
|
2.214749
|
0.971146
|
2.280553
|
0.0317
|
|
@TREND(1970)
|
-0.004060
|
0.004435
|
-0.915416
|
0.3691
|
|
R-squared
|
0.364927
|
Mean dependent var
|
-0.003746
|
|
Adjusted R-squared
|
0.232620
|
S.D. dependent var
|
0.206571
|
|
S.E. of regression
|
0.180956
|
Akaike info criterion
|
-0.404264
|
|
Sum squared resid
|
0.785886
|
Schwarz criterion
|
-0.124025
|
|
Log likelihood
|
12.06397
|
F-statistic
|
2.758190
|
|
Durbin-Watson stat
|
1.607444
|
Prob(F-statistic)
|
0.041727
|
ADF(3) d=0 ni constante ni trend
|
ADF Test Statistic
|
-0.139022
|
1% Critical Value*
|
-2.6423
|
|
|
5% Critical Value
|
-1.9526
|
|
|
10% Critical Value
|
-1.6216
|
|
*MacKinnon critical values for rejection of hypothesis of a unit
root.
|
|
|
|
|
|
|
|
|
|
|
|
Augmented Dickey-Fuller Test Equation
|
|
Dependent Variable: D(LPRC)
|
|
Method: Least Squares
|
|
Date: 04/19/06 Time: 21:45
|
|
Sample(adjusted): 1974 2003
|
|
Included observations: 30 after adjusting endpoints
|
|
Variable
|
Coefficient
|
Std. Error
|
t-Statistic
|
Prob.
|
|
LPRC(-1)
|
-0.001164
|
0.008374
|
-0.139022
|
0.8905
|
|
D(LPRC(-1))
|
-0.267751
|
0.166890
|
-1.604359
|
0.1207
|
|
D(LPRC(-2))
|
-0.349782
|
0.167675
|
-2.086070
|
0.0469
|
|
D(LPRC(-3))
|
0.115463
|
0.173361
|
0.666025
|
0.5113
|
|
R-squared
|
0.221221
|
Mean dependent var
|
-0.003746
|
|
Adjusted R-squared
|
0.131362
|
S.D. dependent var
|
0.206571
|
|
S.E. of regression
|
0.192526
|
Akaike info criterion
|
-0.333610
|
|
Sum squared resid
|
0.963719
|
Schwarz criterion
|
-0.146783
|
|
Log likelihood
|
9.004146
|
F-statistic
|
2.461862
|
|
Durbin-Watson stat
|
1.705462
|
Prob(F-statistic)
|
0.085004
|
ADF(1) d=1 avec constante
|
ADF Test Statistic
|
-5.256104
|
1% Critical Value*
|
-3.6576
|
|
|
5% Critical Value
|
-2.9591
|
|
|
10% Critical Value
|
-2.6181
|
|
*MacKinnon critical values for rejection of hypothesis of a unit
root.
|
|
|
|
|
|
|
|
|
|
|
|
Augmented Dickey-Fuller Test Equation
|
|
Dependent Variable: D(LPRC,2)
|
|
Method: Least Squares
|
|
Date: 04/19/06 Time: 21:47
|
|
Sample(adjusted): 1973 2003
|
|
Included observations: 31 after adjusting endpoints
|
|
Variable
|
Coefficient
|
Std. Error
|
t-Statistic
|
Prob.
|
|
D(LPRC(-1))
|
-1.473714
|
0.280382
|
-5.256104
|
0.0000
|
|
D(LPRC(-1),2)
|
0.275638
|
0.186182
|
1.480479
|
0.1499
|
|
C
|
0.018399
|
0.039606
|
0.464546
|
0.6458
|
|
R-squared
|
0.610834
|
Mean dependent var
|
-0.002085
|
|
Adjusted R-squared
|
0.583036
|
S.D. dependent var
|
0.340189
|
|
S.E. of regression
|
0.219669
|
Akaike info criterion
|
-0.101622
|
|
Sum squared resid
|
1.351128
|
Schwarz criterion
|
0.037151
|
|
Log likelihood
|
4.575138
|
F-statistic
|
21.97433
|
|
Durbin-Watson stat
|
1.867322
|
Prob(F-statistic)
|
0.000002
|
ADF(1) d=1 avec constante et trend
|
ADF Test Statistic
|
-5.464718
|
1% Critical Value*
|
-4.2826
|
|
|
5% Critical Value
|
-3.5614
|
|
|
10% Critical Value
|
-3.2138
|
|
*MacKinnon critical values for rejection of hypothesis of a unit
root.
|
|
|
|
|
|
|
|
|
|
|
|
Augmented Dickey-Fuller Test Equation
|
|
Dependent Variable: D(LPRC,2)
|
|
Method: Least Squares
|
|
Date: 04/19/06 Time: 21:48
|
|
Sample(adjusted): 1973 2003
|
|
Included observations: 31 after adjusting endpoints
|
|
Variable
|
Coefficient
|
Std. Error
|
t-Statistic
|
Prob.
|
|
D(LPRC(-1))
|
-1.639556
|
0.300026
|
-5.464718
|
0.0000
|
|
D(LPRC(-1),2)
|
0.375419
|
0.196430
|
1.911208
|
0.0666
|
|
C
|
0.139774
|
0.094990
|
1.471460
|
0.1527
|
|
@TREND(1970)
|
-0.006636
|
0.004737
|
-1.400903
|
0.1726
|
|
R-squared
|
0.637204
|
Mean dependent var
|
-0.002085
|
|
Adjusted R-squared
|
0.596893
|
S.D. dependent var
|
0.340189
|
|
S.E. of regression
|
0.215988
|
Akaike info criterion
|
-0.107272
|
|
Sum squared resid
|
1.259575
|
Schwarz criterion
|
0.077759
|
|
Log likelihood
|
5.662712
|
F-statistic
|
15.80733
|
|
Durbin-Watson stat
|
1.840482
|
Prob(F-statistic)
|
0.000004
|
ADF(1) d=1 ni constante ni trend
|
ADF Test Statistic
|
-5.307806
|
1% Critical Value*
|
-2.6395
|
|
|
5% Critical Value
|
-1.9521
|
|
|
10% Critical Value
|
-1.6214
|
|
*MacKinnon critical values for rejection of hypothesis of a unit
root.
|
|
|
|
|
|
|
|
|
|
|
|
Augmented Dickey-Fuller Test Equation
|
|
Dependent Variable: D(LPRC,2)
|
|
Method: Least Squares
|
|
Date: 04/19/06 Time: 21:49
|
|
Sample(adjusted): 1973 2003
|
|
Included observations: 31 after adjusting endpoints
|
|
Variable
|
Coefficient
|
Std. Error
|
t-Statistic
|
Prob.
|
|
D(LPRC(-1))
|
-1.462507
|
0.275539
|
-5.307806
|
0.0000
|
|
D(LPRC(-1),2)
|
0.270785
|
0.183358
|
1.476809
|
0.1505
|
|
R-squared
|
0.607834
|
Mean dependent var
|
-0.002085
|
|
Adjusted R-squared
|
0.594311
|
S.D. dependent var
|
0.340189
|
|
S.E. of regression
|
0.216679
|
Akaike info criterion
|
-0.158460
|
|
Sum squared resid
|
1.361542
|
Schwarz criterion
|
-0.065945
|
|
Log likelihood
|
4.456133
|
F-statistic
|
44.94832
|
|
Durbin-Watson stat
|
1.867560
|
Prob(F-statistic)
|
0.000000
|
SUBVENTION
ADF(1) d=0 avec constante
|
ADF Test Statistic
|
-2.460223
|
1% Critical Value*
|
-3.6496
|
|
|
5% Critical Value
|
-2.9558
|
|
|
10% Critical Value
|
-2.6164
|
|
*MacKinnon critical values for rejection of hypothesis of a unit
root.
|
|
|
|
|
|
|
|
|
|
|
|
Augmented Dickey-Fuller Test Equation
|
|
Dependent Variable: D(LNSUB)
|
|
Method: Least Squares
|
|
Date: 04/19/06 Time: 21:51
|
|
Sample(adjusted): 1972 2003
|
|
Included observations: 32 after adjusting endpoints
|
|
Variable
|
Coefficient
|
Std. Error
|
t-Statistic
|
Prob.
|
|
LNSUB(-1)
|
-0.203906
|
0.082881
|
-2.460223
|
0.0201
|
|
D(LNSUB(-1))
|
-0.166002
|
0.165226
|
-1.004695
|
0.3234
|
|
C
|
1.780182
|
0.705094
|
2.524745
|
0.0173
|
|
R-squared
|
0.200248
|
Mean dependent var
|
0.039240
|
|
Adjusted R-squared
|
0.145093
|
S.D. dependent var
|
0.180744
|
|
S.E. of regression
|
0.167118
|
Akaike info criterion
|
-0.651175
|
|
Sum squared resid
|
0.809923
|
Schwarz criterion
|
-0.513763
|
|
Log likelihood
|
13.41881
|
F-statistic
|
3.630626
|
|
Durbin-Watson stat
|
2.158259
|
Prob(F-statistic)
|
0.039161
|
ADF(1) d=0 avec constante et trend
|
ADF Test Statistic
|
-3.298779
|
1% Critical Value*
|
-4.2712
|
|
|
5% Critical Value
|
-3.5562
|
|
|
10% Critical Value
|
-3.2109
|
|
*MacKinnon critical values for rejection of hypothesis of a unit
root.
|
|
|
|
|
|
|
|
|
|
|
|
Augmented Dickey-Fuller Test Equation
|
|
Dependent Variable: D(LNSUB)
|
|
Method: Least Squares
|
|
Date: 04/19/06 Time: 21:52
|
|
Sample(adjusted): 1972 2003
|
|
Included observations: 32 after adjusting endpoints
|
|
Variable
|
Coefficient
|
Std. Error
|
t-Statistic
|
Prob.
|
|
LNSUB(-1)
|
-0.566268
|
0.171660
|
-3.298779
|
0.0026
|
|
D(LNSUB(-1))
|
0.017501
|
0.172082
|
0.101702
|
0.9197
|
|
C
|
4.574276
|
1.352271
|
3.382661
|
0.0021
|
|
@TREND(1970)
|
0.015942
|
0.006749
|
2.362048
|
0.0254
|
|
R-squared
|
0.333129
|
Mean dependent var
|
0.039240
|
|
Adjusted R-squared
|
0.261678
|
S.D. dependent var
|
0.180744
|
|
S.E. of regression
|
0.155305
|
Akaike info criterion
|
-0.770380
|
|
Sum squared resid
|
0.675352
|
Schwarz criterion
|
-0.587163
|
|
Log likelihood
|
16.32608
|
F-statistic
|
4.662374
|
|
Durbin-Watson stat
|
2.034771
|
Prob(F-statistic)
|
0.009149
|
ADF(1) d=0 ni constante ni trend
|
ADF Test Statistic
|
1.328150
|
1% Critical Value*
|
-2.6369
|
|
|
5% Critical Value
|
-1.9517
|
|
|
10% Critical Value
|
-1.6213
|
|
*MacKinnon critical values for rejection of hypothesis of a unit
root.
|
|
|
|
|
|
|
|
|
|
|
|
Augmented Dickey-Fuller Test Equation
|
|
Dependent Variable: D(LNSUB)
|
|
Method: Least Squares
|
|
Date: 04/19/06 Time: 21:53
|
|
Sample(adjusted): 1972 2003
|
|
Included observations: 32 after adjusting endpoints
|
|
Variable
|
Coefficient
|
Std. Error
|
t-Statistic
|
Prob.
|
|
LNSUB(-1)
|
0.005153
|
0.003880
|
1.328150
|
0.1941
|
|
D(LNSUB(-1))
|
-0.177670
|
0.179347
|
-0.990650
|
0.3298
|
|
R-squared
|
0.024459
|
Mean dependent var
|
0.039240
|
|
Adjusted R-squared
|
-0.008059
|
S.D. dependent var
|
0.180744
|
|
S.E. of regression
|
0.181471
|
Akaike info criterion
|
-0.514985
|
|
Sum squared resid
|
0.987948
|
Schwarz criterion
|
-0.423376
|
|
Log likelihood
|
10.23975
|
F-statistic
|
0.752168
|
|
Durbin-Watson stat
|
2.140734
|
Prob(F-statistic)
|
0.392675
|
ADF(1) d=1 avec constante
|
ADF Test Statistic
|
-6.152996
|
1% Critical Value*
|
-3.6576
|
|
|
5% Critical Value
|
-2.9591
|
|
|
10% Critical Value
|
-2.6181
|
|
*MacKinnon critical values for rejection of hypothesis of a unit
root.
|
|
|
|
|
|
|
|
|
|
|
|
Augmented Dickey-Fuller Test Equation
|
|
Dependent Variable: D(LNSUB,2)
|
|
Method: Least Squares
|
|
Date: 04/19/06 Time: 21:54
|
|
Sample(adjusted): 1973 2003
|
|
Included observations: 31 after adjusting endpoints
|
|
Variable
|
Coefficient
|
Std. Error
|
t-Statistic
|
Prob.
|
|
D(LNSUB(-1))
|
-1.638514
|
0.266295
|
-6.152996
|
0.0000
|
|
D(LNSUB(-1),2)
|
0.372849
|
0.173461
|
2.149477
|
0.0404
|
|
C
|
0.060200
|
0.032486
|
1.853121
|
0.0744
|
|
R-squared
|
0.659507
|
Mean dependent var
|
-0.004803
|
|
Adjusted R-squared
|
0.635186
|
S.D. dependent var
|
0.283353
|
|
S.E. of regression
|
0.171144
|
Akaike info criterion
|
-0.600852
|
|
Sum squared resid
|
0.820132
|
Schwarz criterion
|
-0.462079
|
|
Log likelihood
|
12.31321
|
F-statistic
|
27.11686
|
|
Durbin-Watson stat
|
1.777302
|
Prob(F-statistic)
|
0.000000
|
ADF(1) d=1 avec constante et trend
|
ADF Test Statistic
|
-6.562313
|
1% Critical Value*
|
-4.2826
|
|
|
5% Critical Value
|
-3.5614
|
|
|
10% Critical Value
|
-3.2138
|
|
*MacKinnon critical values for rejection of hypothesis of a unit
root.
|
|
|
|
|
|
|
|
|
|
|
|
Augmented Dickey-Fuller Test Equation
|
|
Dependent Variable: D(LNSUB,2)
|
|
Method: Least Squares
|
|
Date: 04/19/06 Time: 21:56
|
|
Sample(adjusted): 1973 2003
|
|
Included observations: 31 after adjusting endpoints
|
|
Variable
|
Coefficient
|
Std. Error
|
t-Statistic
|
Prob.
|
|
D(LNSUB(-1))
|
-1.785594
|
0.272098
|
-6.562313
|
0.0000
|
|
D(LNSUB(-1),2)
|
0.456134
|
0.175018
|
2.606209
|
0.0147
|
|
C
|
0.173112
|
0.073756
|
2.347075
|
0.0265
|
|
@TREND(1970)
|
-0.005951
|
0.003516
|
-1.692507
|
0.1021
|
|
R-squared
|
0.692167
|
Mean dependent var
|
-0.004803
|
|
Adjusted R-squared
|
0.657963
|
S.D. dependent var
|
0.283353
|
|
S.E. of regression
|
0.165716
|
Akaike info criterion
|
-0.637172
|
|
Sum squared resid
|
0.741465
|
Schwarz criterion
|
-0.452142
|
|
Log likelihood
|
13.87617
|
F-statistic
|
20.23662
|
|
Durbin-Watson stat
|
1.778922
|
Prob(F-statistic)
|
0.000000
|
ADF(1) d=1 ni constante ni trend
|
ADF Test Statistic
|
-5.637301
|
1% Critical Value*
|
-2.6395
|
|
|
5% Critical Value
|
-1.9521
|
|
|
10% Critical Value
|
-1.6214
|
|
*MacKinnon critical values for rejection of hypothesis of a unit
root.
|
|
|
|
|
|
|
|
|
|
|
|
Augmented Dickey-Fuller Test Equation
|
|
Dependent Variable: D(LNSUB,2)
|
|
Method: Least Squares
|
|
Date: 04/19/06 Time: 21:56
|
|
Sample(adjusted): 1973 2003
|
|
Included observations: 31 after adjusting endpoints
|
|
Variable
|
Coefficient
|
Std. Error
|
t-Statistic
|
Prob.
|
|
D(LNSUB(-1))
|
-1.478849
|
0.262333
|
-5.637301
|
0.0000
|
|
D(LNSUB(-1),2)
|
0.293343
|
0.174982
|
1.676418
|
0.1044
|
|
R-squared
|
0.617747
|
Mean dependent var
|
-0.004803
|
|
Adjusted R-squared
|
0.604566
|
S.D. dependent var
|
0.283353
|
|
S.E. of regression
|
0.178182
|
Akaike info criterion
|
-0.549681
|
|
Sum squared resid
|
0.920717
|
Schwarz criterion
|
-0.457166
|
|
Log likelihood
|
10.52006
|
F-statistic
|
46.86606
|
|
Durbin-Watson stat
|
1.791056
|
Prob(F-statistic)
|
0.000000
|
CONSOMMATION
ADF(1) ; d=0 ; Avec constante
|
ADF Test Statistic
|
-0.558113
|
1% Critical Value*
|
-3.6496
|
|
|
5% Critical Value
|
-2.9558
|
|
|
|
|
|
|
10% Critical Value
|
-2.6164
|
|
*MacKinnon critical values for rejection of hypothesis of a unit
root.
|
|
|
|
|
|
|
|
|
|
|
|
Augmented Dickey-Fuller Test Equation
|
|
Dependent Variable: D(LCONS)
|
|
Method: Least Squares
|
|
Date: 03/20/06 Time: 18:40
|
|
Sample(adjusted): 1972 2003
|
|
Included observations: 32 after adjusting endpoints
|
|
Variable
|
Coefficient
|
Std. Error
|
t-Statistic
|
Prob.
|
|
LCONS(-1)
|
-0.019541
|
0.035013
|
-0.558113
|
0.5811
|
|
D(LCONS(-1))
|
-0.079801
|
0.186219
|
-0.428536
|
0.6714
|
|
C
|
0.101903
|
0.151144
|
0.674208
|
0.5055
|
|
R-squared
|
0.018612
|
Mean dependent var
|
0.016097
|
|
Adjusted R-squared
|
-0.049070
|
S.D. dependent var
|
0.032577
|
|
S.E. of regression
|
0.033366
|
Akaike info criterion
|
-3.873476
|
|
Sum squared resid
|
0.032286
|
Schwarz criterion
|
-3.736064
|
|
Log likelihood
|
64.97562
|
F-statistic
|
0.274996
|
|
Durbin-Watson stat
|
1.993101
|
Prob(F-statistic)
|
0.761534
|
ADF(1) ; d=1 ; Avec constante
|
ADF Test Statistic
|
-3.920111
|
1% Critical Value*
|
-3.6576
|
|
|
5% Critical Value
|
-2.9591
|
|
|
10% Critical Value
|
-2.6181
|
|
*MacKinnon critical values for rejection of hypothesis of a unit
root.
|
|
|
|
|
|
|
|
|
|
|
|
Augmented Dickey-Fuller Test Equation
|
|
Dependent Variable: D(LCONS,2)
|
|
Method: Least Squares
|
|
Date: 03/20/06 Time: 18:58
|
|
Sample(adjusted): 1973 2003
|
|
Included observations: 31 after adjusting endpoints
|
|
Variable
|
Coefficient
|
Std. Error
|
t-Statistic
|
Prob.
|
|
D(LCONS(-1))
|
-1.097341
|
0.279926
|
-3.920111
|
0.0005
|
|
D(LCONS(-1),2)
|
0.005917
|
0.191300
|
0.030929
|
0.9755
|
|
C
|
0.017634
|
0.007682
|
2.295392
|
0.0294
|
|
R-squared
|
0.541928
|
Mean dependent var
|
-0.000787
|
|
Adjusted R-squared
|
0.509209
|
S.D. dependent var
|
0.048721
|
|
S.E. of regression
|
0.034132
|
Akaike info criterion
|
-3.825386
|
|
Sum squared resid
|
0.032620
|
Schwarz criterion
|
-3.686613
|
|
Log likelihood
|
62.29349
|
F-statistic
|
16.56288
|
|
Durbin-Watson stat
|
1.985804
|
Prob(F-statistic)
|
0.000018
|
ADF(1) ; d=0 ; Avec Trend et
constante
|
ADF Test Statistic
|
-1.696559
|
1% Critical Value*
|
-4.2712
|
|
|
5% Critical Value
|
-3.5562
|
|
|
10% Critical Value
|
-3.2109
|
|
*MacKinnon critical values for rejection of hypothesis of a unit
root.
|
|
|
|
|
|
|
|
|
|
|
|
Augmented Dickey-Fuller Test Equation
|
|
Dependent Variable: D(LCONS)
|
|
Method: Least Squares
|
|
Date: 03/20/06 Time: 18:48
|
|
Sample(adjusted): 1972 2003
|
|
Included observations: 32 after adjusting endpoints
|
|
Variable
|
Coefficient
|
Std. Error
|
t-Statistic
|
Prob.
|
|
LCONS(-1)
|
-0.206428
|
0.121675
|
-1.696559
|
0.1009
|
|
D(LCONS(-1))
|
0.012603
|
0.190372
|
0.066200
|
0.9477
|
|
C
|
0.845869
|
0.487703
|
1.734394
|
0.0938
|
|
@TREND(1970)
|
0.003552
|
0.002220
|
1.600109
|
0.1208
|
|
R-squared
|
0.100833
|
Mean dependent var
|
0.016097
|
|
Adjusted R-squared
|
0.004494
|
S.D. dependent var
|
0.032577
|
|
S.E. of regression
|
0.032503
|
Akaike info criterion
|
-3.898475
|
|
Sum squared resid
|
0.029581
|
Schwarz criterion
|
-3.715258
|
|
Log likelihood
|
66.37560
|
F-statistic
|
1.046644
|
|
Durbin-Watson stat
|
1.987690
|
Prob(F-statistic)
|
0.387341
|
ADF(1) ; d=1 ; Avec Trend et
constante
|
ADF Test Statistic
|
-3.850168
|
1% Critical Value*
|
-4.2826
|
|
|
5% Critical Value
|
-3.5614
|
|
|
10% Critical Value
|
-3.2138
|
|
*MacKinnon critical values for rejection of hypothesis of a unit
root.
|
|
|
|
|
|
|
|
|
|
|
|
Augmented Dickey-Fuller Test Equation
|
|
Dependent Variable: D(LCONS,2)
|
|
Method: Least Squares
|
|
Date: 03/20/06 Time: 18:59
|
|
Sample(adjusted): 1973 2003
|
|
Included observations: 31 after adjusting endpoints
|
|
Variable
|
Coefficient
|
Std. Error
|
t-Statistic
|
Prob.
|
|
D(LCONS(-1))
|
-1.097462
|
0.285043
|
-3.850168
|
0.0007
|
|
D(LCONS(-1),2)
|
0.006256
|
0.194855
|
0.032105
|
0.9746
|
|
C
|
0.018505
|
0.014827
|
1.248099
|
0.2227
|
|
@TREND(1970)
|
-4.83E-05
|
0.000698
|
-0.069201
|
0.9453
|
|
R-squared
|
0.542009
|
Mean dependent var
|
-0.000787
|
|
Adjusted R-squared
|
0.491121
|
S.D. dependent var
|
0.048721
|
|
S.E. of regression
|
0.034755
|
Akaike info criterion
|
-3.761047
|
|
Sum squared resid
|
0.032614
|
Schwarz criterion
|
-3.576017
|
|
Log likelihood
|
62.29624
|
F-statistic
|
10.65105
|
|
Durbin-Watson stat
|
1.986426
|
Prob(F-statistic)
|
0.000085
|
ADF(1) ; d=0 ; Ni Trend et
constante
|
ADF Test Statistic
|
2.635461
|
1% Critical Value*
|
-2.6369
|
|
|
5% Critical Value
|
-1.9517
|
|
|
10% Critical Value
|
-1.6213
|
|
*MacKinnon critical values for rejection of hypothesis of a unit
root.
|
|
|
|
|
|
|
|
|
|
|
|
Augmented Dickey-Fuller Test Equation
|
|
Dependent Variable: D(LCONS)
|
|
Method: Least Squares
|
|
Date: 03/20/06 Time: 18:50
|
|
Sample(adjusted): 1972 2003
|
|
Included observations: 32 after adjusting endpoints
|
|
Variable
|
Coefficient
|
Std. Error
|
t-Statistic
|
Prob.
|
|
LCONS(-1)
|
0.004042
|
0.001534
|
2.635461
|
0.0132
|
|
D(LCONS(-1))
|
-0.090075
|
0.183899
|
-0.489808
|
0.6278
|
|
R-squared
|
0.003230
|
Mean dependent var
|
0.016097
|
|
Adjusted R-squared
|
-0.029996
|
S.D. dependent var
|
0.032577
|
|
S.E. of regression
|
0.033062
|
Akaike info criterion
|
-3.920423
|
|
Sum squared resid
|
0.032792
|
Schwarz criterion
|
-3.828815
|
|
Log likelihood
|
64.72678
|
F-statistic
|
0.097203
|
|
Durbin-Watson stat
|
1.989165
|
Prob(F-statistic)
|
0.757369
|
ADF(1) ; d=1 ; Ni Trend et
constante
|
ADF Test Statistic
|
-2.967966
|
1% Critical Value*
|
-2.6395
|
|
|
5% Critical Value
|
-1.9521
|
|
|
10% Critical Value
|
-1.6214
|
|
*MacKinnon critical values for rejection of hypothesis of a unit
root.
|
|
|
|
|
|
|
|
|
|
|
|
Augmented Dickey-Fuller Test Equation
|
|
Dependent Variable: D(LCONS,2)
|
|
Method: Least Squares
|
|
Date: 03/20/06 Time: 19:03
|
|
Sample(adjusted): 1973 2003
|
|
Included observations: 31 after adjusting endpoints
|
|
Variable
|
Coefficient
|
Std. Error
|
t-Statistic
|
Prob.
|
|
D(LCONS(-1))
|
-0.710131
|
0.239265
|
-2.967966
|
0.0060
|
|
D(LCONS(-1),2)
|
-0.186298
|
0.184224
|
-1.011258
|
0.3203
|
|
R-squared
|
0.455732
|
Mean dependent var
|
-0.000787
|
|
Adjusted R-squared
|
0.436964
|
S.D. dependent var
|
0.048721
|
|
S.E. of regression
|
0.036558
|
Akaike info criterion
|
-3.717486
|
|
Sum squared resid
|
0.038758
|
Schwarz criterion
|
-3.624971
|
|
Log likelihood
|
59.62104
|
F-statistic
|
24.28253
|
|
Durbin-Watson stat
|
2.104406
|
Prob(F-statistic)
|
0.000031
|
PRODUCTION
ADF(1) d=0, avec constante
|
ADF Test Statistic
|
-1.403881
|
1% Critical Value*
|
-3.6496
|
|
|
5% Critical Value
|
-2.9558
|
|
|
10% Critical Value
|
-2.6164
|
|
*MacKinnon critical values for rejection of hypothesis of a unit
root.
|
|
|
|
|
|
|
|
|
|
|
|
Augmented Dickey-Fuller Test Equation
|
|
Dependent Variable: D(LPRO)
|
|
Method: Least Squares
|
|
Date: 03/20/06 Time: 19:23
|
|
Sample(adjusted): 1972 2003
|
|
Included observations: 32 after adjusting endpoints
|
|
Variable
|
Coefficient
|
Std. Error
|
t-Statistic
|
Prob.
|
|
LPRO(-1)
|
-0.136825
|
0.097462
|
-1.403881
|
0.1710
|
|
D(LPRO(-1))
|
-0.239482
|
0.175644
|
-1.363452
|
0.1832
|
|
C
|
0.608687
|
0.421022
|
1.445736
|
0.1590
|
|
R-squared
|
0.144691
|
Mean dependent var
|
0.013868
|
|
Adjusted R-squared
|
0.085705
|
S.D. dependent var
|
0.097728
|
|
S.E. of regression
|
0.093446
|
Akaike info criterion
|
-1.813799
|
|
Sum squared resid
|
0.253234
|
Schwarz criterion
|
-1.676386
|
|
Log likelihood
|
32.02078
|
F-statistic
|
2.452944
|
|
Durbin-Watson stat
|
2.244308
|
Prob(F-statistic)
|
0.103701
|
ADF(1) d=0, avec trend et constante
|
ADF Test Statistic
|
-3.657865
|
1% Critical Value*
|
-4.2712
|
|
|
5% Critical Value
|
-3.5562
|
|
|
10% Critical Value
|
-3.2109
|
|
*MacKinnon critical values for rejection of hypothesis of a unit
root.
|
|
|
|
|
|
|
|
|
|
|
|
Augmented Dickey-Fuller Test Equation
|
|
Dependent Variable: D(LPRO)
|
|
Method: Least Squares
|
|
Date: 03/20/06 Time: 19:26
|
|
Sample(adjusted): 1972 2003
|
|
Included observations: 32 after adjusting endpoints
|
|
Variable
|
Coefficient
|
Std. Error
|
t-Statistic
|
Prob.
|
|
LPRO(-1)
|
-0.875278
|
0.239287
|
-3.657865
|
0.0010
|
|
D(LPRO(-1))
|
0.158223
|
0.193829
|
0.816303
|
0.4212
|
|
C
|
3.540497
|
0.960768
|
3.685069
|
0.0010
|
|
@TREND(1970)
|
0.014524
|
0.004405
|
3.296828
|
0.0027
|
|
R-squared
|
0.383864
|
Mean dependent var
|
0.013868
|
|
Adjusted R-squared
|
0.317849
|
S.D. dependent var
|
0.097728
|
|
S.E. of regression
|
0.080716
|
Akaike info criterion
|
-2.079293
|
|
Sum squared resid
|
0.182422
|
Schwarz criterion
|
-1.896076
|
|
Log likelihood
|
37.26869
|
F-statistic
|
5.814832
|
|
Durbin-Watson stat
|
1.898679
|
Prob(F-statistic)
|
0.003207
|
ADF(1) d=0, ni trend ni constante
|
ADF Test Statistic
|
1.008255
|
1% Critical Value*
|
-2.6369
|
|
|
5% Critical Value
|
-1.9517
|
|
|
10% Critical Value
|
-1.6213
|
|
*MacKinnon critical values for rejection of hypothesis of a unit
root.
|
|
|
|
|
|
|
|
|
|
|
|
Augmented Dickey-Fuller Test Equation
|
|
Dependent Variable: D(LPRO)
|
|
Method: Least Squares
|
|
Date: 03/20/06 Time: 19:28
|
|
Sample(adjusted): 1972 2003
|
|
Included observations: 32 after adjusting endpoints
|
|
Variable
|
Coefficient
|
Std. Error
|
t-Statistic
|
Prob.
|
|
LPRO(-1)
|
0.003968
|
0.003936
|
1.008255
|
0.3214
|
|
D(LPRO(-1))
|
-0.293699
|
0.174683
|
-1.681323
|
0.1031
|
|
R-squared
|
0.083046
|
Mean dependent var
|
0.013868
|
|
Adjusted R-squared
|
0.052480
|
S.D. dependent var
|
0.097728
|
|
S.E. of regression
|
0.095129
|
Akaike info criterion
|
-1.806704
|
|
Sum squared resid
|
0.271486
|
Schwarz criterion
|
-1.715095
|
|
Log likelihood
|
30.90726
|
F-statistic
|
2.717005
|
|
Durbin-Watson stat
|
2.316510
|
Prob(F-statistic)
|
0.109719
|
ADF(1) d=1, avec constante
|
ADF Test Statistic
|
-7.829995
|
1% Critical Value*
|
-3.6576
|
|
|
5% Critical Value
|
-2.9591
|
|
|
10% Critical Value
|
-2.6181
|
|
*MacKinnon critical values for rejection of hypothesis of a unit
root.
|
|
|
|
|
|
|
|
|
|
|
|
Augmented Dickey-Fuller Test Equation
|
|
Dependent Variable: D(LPRO,2)
|
|
Method: Least Squares
|
|
Date: 03/20/06 Time: 19:31
|
|
Sample(adjusted): 1973 2003
|
|
Included observations: 31 after adjusting endpoints
|
|
Variable
|
Coefficient
|
Std. Error
|
t-Statistic
|
Prob.
|
|
D(LPRO(-1))
|
-2.012004
|
0.256961
|
-7.829995
|
0.0000
|
|
D(LPRO(-1),2)
|
0.554769
|
0.162033
|
3.423793
|
0.0019
|
|
C
|
0.028998
|
0.015314
|
1.893508
|
0.0687
|
|
R-squared
|
0.753568
|
Mean dependent var
|
6.14E-05
|
|
Adjusted R-squared
|
0.735965
|
S.D. dependent var
|
0.159970
|
|
S.E. of regression
|
0.082200
|
Akaike info criterion
|
-2.067565
|
|
Sum squared resid
|
0.189190
|
Schwarz criterion
|
-1.928792
|
|
Log likelihood
|
35.04725
|
F-statistic
|
42.81071
|
|
Durbin-Watson stat
|
2.147420
|
Prob(F-statistic)
|
0.000000
|
ADF(1) d=1, avec trend et constante
|
ADF Test Statistic
|
-7.703165
|
1% Critical Value*
|
-4.2826
|
|
|
5% Critical Value
|
-3.5614
|
|
|
10% Critical Value
|
-3.2138
|
|
*MacKinnon critical values for rejection of hypothesis of a unit
root.
|
|
|
|
|
|
|
|
|
|
|
|
Augmented Dickey-Fuller Test Equation
|
|
Dependent Variable: D(LPRO,2)
|
|
Method: Least Squares
|
|
Date: 03/20/06 Time: 19:32
|
|
Sample(adjusted): 1973 2003
|
|
Included observations: 31 after adjusting endpoints
|
|
Variable
|
Coefficient
|
Std. Error
|
t-Statistic
|
Prob.
|
|
D(LPRO(-1))
|
-2.015330
|
0.261624
|
-7.703165
|
0.0000
|
|
D(LPRO(-1),2)
|
0.555696
|
0.164824
|
3.371449
|
0.0023
|
|
C
|
0.037155
|
0.034195
|
1.086580
|
0.2868
|
|
@TREND(1970)
|
-0.000451
|
0.001681
|
-0.267977
|
0.7908
|
|
R-squared
|
0.754221
|
Mean dependent var
|
6.14E-05
|
|
Adjusted R-squared
|
0.726913
|
S.D. dependent var
|
0.159970
|
|
S.E. of regression
|
0.083597
|
Akaike info criterion
|
-2.005705
|
|
Sum squared resid
|
0.188688
|
Schwarz criterion
|
-1.820674
|
|
Log likelihood
|
35.08842
|
F-statistic
|
27.61830
|
|
Durbin-Watson stat
|
2.148584
|
Prob(F-statistic)
|
0.000000
|
ADF(1) d=1, ni trend ni constante
|
ADF Test Statistic
|
-7.281950
|
1% Critical Value*
|
-2.6395
|
|
|
5% Critical Value
|
-1.9521
|
|
|
10% Critical Value
|
-1.6214
|
|
*MacKinnon critical values for rejection of hypothesis of a unit
root.
|
|
|
|
|
|
|
|
|
|
|
|
Augmented Dickey-Fuller Test Equation
|
|
Dependent Variable: D(LPRO,2)
|
|
Method: Least Squares
|
|
Date: 03/20/06 Time: 19:34
|
|
Sample(adjusted): 1973 2003
|
|
Included observations: 31 after adjusting endpoints
|
|
Variable
|
Coefficient
|
Std. Error
|
t-Statistic
|
Prob.
|
|
D(LPRO(-1))
|
-1.883832
|
0.258699
|
-7.281950
|
0.0000
|
|
D(LPRO(-1),2)
|
0.483108
|
0.164425
|
2.938169
|
0.0064
|
|
R-squared
|
0.722012
|
Mean dependent var
|
6.14E-05
|
|
Adjusted R-squared
|
0.712426
|
S.D. dependent var
|
0.159970
|
|
S.E. of regression
|
0.085786
|
Akaike info criterion
|
-2.011591
|
|
Sum squared resid
|
0.213416
|
Schwarz criterion
|
-1.919076
|
|
Log likelihood
|
33.17966
|
F-statistic
|
75.32110
|
|
Durbin-Watson stat
|
2.006281
|
Prob(F-statistic)
|
0.000000
|
|
ADF(3) d=0 ni constante, ni tendance
|
|
ADF Test Statistic
|
1.863045
|
1% Critical Value*
|
-2.6423
|
|
|
5% Critical Value
|
-1.9526
|
|
|
10% Critical Value
|
-1.6216
|
|
*MacKinnon critical values for rejection of hypothesis of a unit
root.
|
|
|
|
|
|
|
|
|
|
|
|
Augmented Dickey-Fuller Test Equation
|
|
Dependent Variable: D(LPRO3)
|
|
Method: Least Squares
|
|
Date: 04/30/06 Time: 16:03
|
|
Sample(adjusted): 1974 2003
|
|
Included observations: 30 after adjusting endpoints
|
|
|
|
|
|
|
Variable
|
Coefficient
|
Std. Error
|
t-Statistic
|
Prob.
|
|
|
|
|
|
|
LPRO3(-1)
|
0.007286
|
0.003911
|
1.863045
|
0.0738
|
|
D(LPRO3(-1))
|
-0.539531
|
0.195159
|
-2.764570
|
0.0103
|
|
D(LPRO3(-2))
|
-0.621773
|
0.187619
|
-3.314012
|
0.0027
|
|
D(LPRO3(-3))
|
-0.136872
|
0.199691
|
-0.685418
|
0.4991
|
|
|
|
|
|
|
R-squared
|
0.372457
|
Mean dependent var
|
0.012972
|
|
Adjusted R-squared
|
0.300049
|
S.D. dependent var
|
0.100878
|
|
S.E. of regression
|
0.084398
|
Akaike info criterion
|
-1.982980
|
|
Sum squared resid
|
0.185199
|
Schwarz criterion
|
-1.796153
|
|
Log likelihood
|
33.74469
|
F-statistic
|
5.143814
|
|
Durbin-Watson stat
|
2.061301
|
Prob(F-statistic)
|
0.006320
|
|
|
|
|
|
|
ADF(3) d=0 avec constante et tendance
|
|
ADF Test Statistic
|
-1.854966
|
1% Critical Value*
|
-4.2949
|
|
|
5% Critical Value
|
-3.5670
|
|
|
10% Critical Value
|
-3.2169
|
|
*MacKinnon critical values for rejection of hypothesis of a unit
root.
|
|
|
|
|
|
|
|
|
|
|
|
Augmented Dickey-Fuller Test Equation
|
|
Dependent Variable: D(LPRO2)
|
|
Method: Least Squares
|
|
Date: 04/30/06 Time: 16:03
|
|
Sample(adjusted): 1974 2003
|
|
Included observations: 30 after adjusting endpoints
|
|
|
|
|
|
|
Variable
|
Coefficient
|
Std. Error
|
t-Statistic
|
Prob.
|
|
|
|
|
|
|
LPRO2(-1)
|
-0.620161
|
0.334325
|
-1.854966
|
0.0759
|
|
D(LPRO2(-1))
|
-0.056106
|
0.322056
|
-0.174211
|
0.8632
|
|
D(LPRO2(-2))
|
-0.308226
|
0.247981
|
-1.242943
|
0.2259
|
|
D(LPRO2(-3))
|
0.034046
|
0.216241
|
0.157446
|
0.8762
|
|
C
|
2.512003
|
1.333844
|
1.883282
|
0.0718
|
|
@TREND(1970)
|
0.010588
|
0.006150
|
1.721655
|
0.0980
|
|
|
|
|
|
|
R-squared
|
0.454336
|
Mean dependent var
|
0.012972
|
|
Adjusted R-squared
|
0.340656
|
S.D. dependent var
|
0.100878
|
|
S.E. of regression
|
0.081913
|
Akaike info criterion
|
-1.989454
|
|
Sum squared resid
|
0.161035
|
Schwarz criterion
|
-1.709215
|
|
Log likelihood
|
35.84181
|
F-statistic
|
3.996619
|
|
Durbin-Watson stat
|
2.007358
|
Prob(F-statistic)
|
0.008855
|
|
|
|
|
|
|
ADF(3) d=0 avec constante
|
|
ADF Test Statistic
|
-0.693628
|
1% Critical Value*
|
-3.6661
|
|
|
5% Critical Value
|
-2.9627
|
|
|
10% Critical Value
|
-2.6200
|
|
|
|
|
|
|
*MacKinnon critical values for rejection of hypothesis of a unit
root.
|
|
|
|
|
|
|
|
|
|
|
|
Augmented Dickey-Fuller Test Equation
|
|
Dependent Variable: D(LPRO1)
|
|
Method: Least Squares
|
|
Date: 04/30/06 Time: 16:11
|
|
Sample(adjusted): 1974 2003
|
|
Included observations: 30 after adjusting endpoints
|
|
|
|
|
|
|
Variable
|
Coefficient
|
Std. Error
|
t-Statistic
|
Prob.
|
|
|
|
|
|
|
LPRO1(-1)
|
-0.067965
|
0.097985
|
-0.693628
|
0.4943
|
|
D(LPRO1(-1))
|
-0.493323
|
0.205695
|
-2.398323
|
0.0243
|
|
D(LPRO1(-2))
|
-0.589613
|
0.193687
|
-3.044157
|
0.0054
|
|
D(LPRO1(-3))
|
-0.130488
|
0.201452
|
-0.647737
|
0.5231
|
|
C
|
0.325599
|
0.423619
|
0.768611
|
0.4493
|
|
|
|
|
|
|
R-squared
|
0.386944
|
Mean dependent var
|
0.012972
|
|
Adjusted R-squared
|
0.288854
|
S.D. dependent var
|
0.100878
|
|
S.E. of regression
|
0.085070
|
Akaike info criterion
|
-1.939668
|
|
Sum squared resid
|
0.180924
|
Schwarz criterion
|
-1.706135
|
|
Log likelihood
|
34.09502
|
F-statistic
|
3.944819
|
|
Durbin-Watson stat
|
2.048737
|
Prob(F-statistic)
|
0.012880
|
|
|
|
|
|
PRIX DU POLYESTER
ADF(1) d=0, avec constante
|
ADF Test Statistic
|
-2.682483
|
1% Critical Value*
|
-3.6496
|
|
|
5% Critical Value
|
-2.9558
|
|
|
10% Critical Value
|
-2.6164
|
|
*MacKinnon critical values for rejection of hypothesis of a unit
root.
|
|
|
|
|
|
|
|
|
|
|
|
Augmented Dickey-Fuller Test Equation
|
|
Dependent Variable: D(LPRP)
|
|
Method: Least Squares
|
|
Date: 03/20/06 Time: 19:36
|
|
Sample(adjusted): 1972 2003
|
|
Included observations: 32 after adjusting endpoints
|
|
Variable
|
Coefficient
|
Std. Error
|
t-Statistic
|
Prob.
|
|
LPRP(-1)
|
-0.185097
|
0.069002
|
-2.682483
|
0.0119
|
|
D(LPRP(-1))
|
0.341595
|
0.157073
|
2.174756
|
0.0379
|
|
C
|
0.778026
|
0.286140
|
2.719037
|
0.0109
|
|
R-squared
|
0.270769
|
Mean dependent var
|
0.015572
|
|
Adjusted R-squared
|
0.220478
|
S.D. dependent var
|
0.107905
|
|
S.E. of regression
|
0.095270
|
Akaike info criterion
|
-1.775150
|
|
Sum squared resid
|
0.263213
|
Schwarz criterion
|
-1.637738
|
|
Log likelihood
|
31.40241
|
F-statistic
|
5.383968
|
|
Durbin-Watson stat
|
1.963681
|
Prob(F-statistic)
|
0.010269
|
ADF(1) d=0, avec trend et constante
|
ADF Test Statistic
|
-2.200966
|
1% Critical Value*
|
-4.2712
|
|
|
5% Critical Value
|
-3.5562
|
|
|
10% Critical Value
|
-3.2109
|
|
*MacKinnon critical values for rejection of hypothesis of a unit
root.
|
|
|
|
|
|
|
|
|
|
|
|
Augmented Dickey-Fuller Test Equation
|
|
Dependent Variable: D(LPRP)
|
|
Method: Least Squares
|
|
Date: 03/20/06 Time: 19:38
|
|
Sample(adjusted): 1972 2003
|
|
Included observations: 32 after adjusting endpoints
|
|
Variable
|
Coefficient
|
Std. Error
|
t-Statistic
|
Prob.
|
|
LPRP(-1)
|
-0.186631
|
0.084795
|
-2.200966
|
0.0361
|
|
D(LPRP(-1))
|
0.343429
|
0.169645
|
2.024396
|
0.0526
|
|
C
|
0.783060
|
0.330304
|
2.370725
|
0.0249
|
|
@TREND(1970)
|
7.43E-05
|
0.002302
|
0.032288
|
0.9745
|
|
R-squared
|
0.270796
|
Mean dependent var
|
0.015572
|
|
Adjusted R-squared
|
0.192667
|
S.D. dependent var
|
0.107905
|
|
S.E. of regression
|
0.096954
|
Akaike info criterion
|
-1.712688
|
|
Sum squared resid
|
0.263203
|
Schwarz criterion
|
-1.529471
|
|
Log likelihood
|
31.40300
|
F-statistic
|
3.466019
|
|
Durbin-Watson stat
|
1.963455
|
Prob(F-statistic)
|
0.029372
|
ADF(1) d=0, ni trend ni constante
|
ADF Test Statistic
|
0.486757
|
1% Critical Value*
|
-2.6369
|
|
|
5% Critical Value
|
-1.9517
|
|
|
10% Critical Value
|
-1.6213
|
|
*MacKinnon critical values for rejection of hypothesis of a unit
root.
|
|
|
|
|
|
|
|
|
|
|
|
Augmented Dickey-Fuller Test Equation
|
|
Dependent Variable: D(LPRP)
|
|
Method: Least Squares
|
|
Date: 03/20/06 Time: 19:39
|
|
Sample(adjusted): 1972 2003
|
|
Included observations: 32 after adjusting endpoints
|
|
Variable
|
Coefficient
|
Std. Error
|
t-Statistic
|
Prob.
|
|
LPRP(-1)
|
0.002192
|
0.004504
|
0.486757
|
0.6300
|
|
D(LPRP(-1))
|
0.297459
|
0.172075
|
1.728654
|
0.0942
|
|
R-squared
|
0.084862
|
Mean dependent var
|
0.015572
|
|
Adjusted R-squared
|
0.054357
|
S.D. dependent var
|
0.107905
|
|
S.E. of regression
|
0.104931
|
Akaike info criterion
|
-1.610565
|
|
Sum squared resid
|
0.330316
|
Schwarz criterion
|
-1.518957
|
|
Log likelihood
|
27.76905
|
F-statistic
|
2.781930
|
|
Durbin-Watson stat
|
1.851040
|
Prob(F-statistic)
|
0.105740
|
ADF(1) d=1, avec constante
|
ADF Test Statistic
|
-4.320814
|
1% Critical Value*
|
-3.6576
|
|
|
5% Critical Value
|
-2.9591
|
|
|
10% Critical Value
|
-2.6181
|
|
*MacKinnon critical values for rejection of hypothesis of a unit
root.
|
|
|
|
|
|
|
|
|
|
|
|
Augmented Dickey-Fuller Test Equation
|
|
Dependent Variable: D(LPRP,2)
|
|
Method: Least Squares
|
|
Date: 03/20/06 Time: 19:41
|
|
Sample(adjusted): 1973 2003
|
|
Included observations: 31 after adjusting endpoints
|
|
Variable
|
Coefficient
|
Std. Error
|
t-Statistic
|
Prob.
|
|
D(LPRP(-1))
|
-0.915207
|
0.211814
|
-4.320814
|
0.0002
|
|
D(LPRP(-1),2)
|
0.278626
|
0.177534
|
1.569423
|
0.1278
|
|
C
|
0.015995
|
0.018824
|
0.849751
|
0.4027
|
|
R-squared
|
0.417048
|
Mean dependent var
|
0.002114
|
|
Adjusted R-squared
|
0.375408
|
S.D. dependent var
|
0.130781
|
|
S.E. of regression
|
0.103357
|
Akaike info criterion
|
-1.609481
|
|
Sum squared resid
|
0.299117
|
Schwarz criterion
|
-1.470708
|
|
Log likelihood
|
27.94696
|
F-statistic
|
10.01569
|
|
Durbin-Watson stat
|
1.992261
|
Prob(F-statistic)
|
0.000523
|
ADF(1) d=1, avec trend et constante
|
ADF Test Statistic
|
-4.986836
|
1% Critical Value*
|
-4.2826
|
|
|
5% Critical Value
|
-3.5614
|
|
|
10% Critical Value
|
-3.2138
|
|
*MacKinnon critical values for rejection of hypothesis of a unit
root.
|
|
|
|
|
|
|
|
|
|
|
|
Augmented Dickey-Fuller Test Equation
|
|
Dependent Variable: D(LPRP,2)
|
|
Method: Least Squares
|
|
Date: 03/20/06 Time: 19:42
|
|
Sample(adjusted): 1973 2003
|
|
Included observations: 31 after adjusting endpoints
|
|
Variable
|
Coefficient
|
Std. Error
|
t-Statistic
|
Prob.
|
|
D(LPRP(-1))
|
-1.061729
|
0.212906
|
-4.986836
|
0.0000
|
|
D(LPRP(-1),2)
|
0.335780
|
0.170421
|
1.970292
|
0.0591
|
|
C
|
0.095390
|
0.042569
|
2.240845
|
0.0335
|
|
@TREND(1970)
|
-0.004290
|
0.002089
|
-2.053866
|
0.0498
|
|
R-squared
|
0.495819
|
Mean dependent var
|
0.002114
|
|
Adjusted R-squared
|
0.439799
|
S.D. dependent var
|
0.130781
|
|
S.E. of regression
|
0.097885
|
Akaike info criterion
|
-1.690135
|
|
Sum squared resid
|
0.258699
|
Schwarz criterion
|
-1.505104
|
|
Log likelihood
|
30.19709
|
F-statistic
|
8.850725
|
|
Durbin-Watson stat
|
2.121695
|
Prob(F-statistic)
|
0.000300
|
ADF(1) d=1, ni trend ni constante
|
ADF Test Statistic
|
-4.259375
|
1% Critical Value*
|
-2.6395
|
|
|
5% Critical Value
|
-1.9521
|
|
|
10% Critical Value
|
-1.6214
|
|
*MacKinnon critical values for rejection of hypothesis of a unit
root.
|
|
|
|
|
|
|
|
|
|
|
|
Augmented Dickey-Fuller Test Equation
|
|
Dependent Variable: D(LPRP,2)
|
|
Method: Least Squares
|
|
Date: 03/20/06 Time: 19:43
|
|
Sample(adjusted): 1973 2003
|
|
Included observations: 31 after adjusting endpoints
|
|
Variable
|
Coefficient
|
Std. Error
|
t-Statistic
|
Prob.
|
|
D(LPRP(-1))
|
-0.885773
|
0.207958
|
-4.259375
|
0.0002
|
|
D(LPRP(-1),2)
|
0.267491
|
0.176199
|
1.518114
|
0.1398
|
|
R-squared
|
0.402014
|
Mean dependent var
|
0.002114
|
|
Adjusted R-squared
|
0.381394
|
S.D. dependent var
|
0.130781
|
|
S.E. of regression
|
0.102861
|
Akaike info criterion
|
-1.648536
|
|
Sum squared resid
|
0.306831
|
Schwarz criterion
|
-1.556020
|
|
Log likelihood
|
27.55230
|
F-statistic
|
19.49614
|
|
Durbin-Watson stat
|
1.977665
|
Prob(F-statistic)
|
0.000128
|
Conclusion : toutes les variables sont
intégrées d'ordre 1 : il y a présomption de
cointégration
2-Estimation de la tendance de LT par la
méthode des MCO (à la Engle-Granger) : Estimation de
EQ/LT
|
Dependent Variable: LPRC
|
|
Method: Least Squares
|
|
Date: 04/19/06 Time: 21:16
|
|
Sample: 1970 2003
|
|
Included observations: 34
|
|
Variable
|
Coefficient
|
Std. Error
|
t-Statistic
|
Prob.
|
|
C
|
3.024311
|
0.722924
|
4.183444
|
0.0002
|
|
LNSUB
|
0.577263
|
0.165251
|
3.493253
|
0.0016
|
|
LCONS
|
-0.389138
|
0.429220
|
-0.906615
|
0.3721
|
|
LPRO
|
-1.049172
|
0.412342
|
-2.544426
|
0.0165
|
|
LPRP
|
0.598628
|
0.160051
|
3.740229
|
0.0008
|
|
R-squared
|
0.630597
|
Mean dependent var
|
4.180170
|
|
Adjusted R-squared
|
0.579645
|
S.D. dependent var
|
0.259579
|
|
S.E. of regression
|
0.168297
|
Akaike info criterion
|
-0.591115
|
|
Sum squared resid
|
0.821396
|
Schwarz criterion
|
-0.366650
|
|
Log likelihood
|
15.04896
|
F-statistic
|
12.37626
|
|
Durbin-Watson stat
|
1.623121
|
Prob(F-statistic)
|
0.000005
|
Stationnarité des
résidus :
|
ADF Test Statistic
|
-6.595528
|
1% Critical Value*
|
-3.6496
|
|
|
5% Critical Value
|
-2.9558
|
|
|
10% Critical Value
|
-2.6164
|
|
*MacKinnon critical values for rejection of hypothesis of a unit
root.
|
|
|
|
|
|
|
|
|
|
|
|
Augmented Dickey-Fuller Test Equation
|
|
Dependent Variable: D(RESID3)
|
|
Method: Least Squares
|
|
Date: 04/25/06 Time: 12:40
|
|
Sample(adjusted): 1972 2003
|
|
Included observations: 32 after adjusting endpoints
|
|
Variable
|
Coefficient
|
Std. Error
|
t-Statistic
|
Prob.
|
|
RESID3(-1)
|
-1.344164
|
0.203799
|
-6.595528
|
0.0000
|
|
D(RESID3(-1))
|
0.485885
|
0.148773
|
3.265953
|
0.0028
|
|
C
|
0.011472
|
0.023340
|
0.491505
|
0.6268
|
|
R-squared
|
0.606844
|
Mean dependent var
|
0.007869
|
|
Adjusted R-squared
|
0.579730
|
S.D. dependent var
|
0.203433
|
|
S.E. of regression
|
0.131882
|
Akaike info criterion
|
-1.124758
|
|
Sum squared resid
|
0.504393
|
Schwarz criterion
|
-0.987346
|
|
Log likelihood
|
20.99614
|
F-statistic
|
22.38108
|
|
Durbin-Watson stat
|
2.164398
|
Prob(F-statistic)
|
0.000001
|
Conclusion : Confirmation de la
possibilité de cointégration des variables
3-
Détermination du nombre de retard
|
Date: 05/11/06 Time: 15:46
|
|
Sample(adjusted): 1971 2003
|
|
Included observations: 33 after adjusting endpoints
|
|
Standard errors & t-statistics in parentheses
|
|
LPRC
|
LNSUB
|
LPRO
|
LCONS
|
LPRP
|
|
LPRC(-1)
|
0.205257
|
0.274352
|
0.242383
|
-0.082652
|
0.255119
|
|
(0.19352)
|
(0.15647)
|
(0.06694)
|
(0.03065)
|
(0.09499)
|
|
(1.06066)
|
(1.75334)
|
(3.62082)
|
(-2.69683)
|
(2.68573)
|
|
|
|
|
|
|
|
LNSUB(-1)
|
0.303332
|
0.344130
|
-0.238073
|
0.009668
|
0.051107
|
|
(0.20291)
|
(0.16407)
|
(0.07019)
|
(0.03214)
|
(0.09960)
|
|
(1.49490)
|
(2.09747)
|
(-3.39179)
|
(0.30084)
|
(0.51311)
|
|
|
|
|
|
|
|
LPRO(-1)
|
-1.268494
|
-0.259161
|
0.401130
|
0.098791
|
-0.379355
|
|
(0.46881)
|
(0.37907)
|
(0.16217)
|
(0.07425)
|
(0.23012)
|
|
(-2.70577)
|
(-0.68368)
|
(2.47351)
|
(1.33058)
|
(-1.64850)
|
|
|
|
|
|
|
|
LCONS(-1)
|
0.357396
|
1.367578
|
0.978226
|
0.821134
|
0.388632
|
|
(0.45644)
|
(0.36907)
|
(0.15789)
|
(0.07229)
|
(0.22405)
|
|
(0.78301)
|
(3.70551)
|
(6.19557)
|
(11.3593)
|
(1.73459)
|
|
|
|
|
|
|
|
LPRP(-1)
|
0.293807
|
-0.049724
|
-0.029107
|
0.075944
|
0.661992
|
|
(0.20572)
|
(0.16634)
|
(0.07116)
|
(0.03258)
|
(0.10098)
|
|
(1.42821)
|
(-0.29894)
|
(-0.40902)
|
(2.33100)
|
(6.55578)
|
|
|
|
|
|
|
|
C
|
3.491248
|
-0.123557
|
-0.497207
|
0.311607
|
-0.131247
|
|
(0.97673)
|
(0.78976)
|
(0.33787)
|
(0.15469)
|
(0.47944)
|
|
(3.57441)
|
(-0.15645)
|
(-1.47159)
|
(2.01443)
|
(-0.27375)
|
|
R-squared
|
0.512180
|
0.874628
|
0.903856
|
0.979403
|
0.899236
|
|
Adj. R-squared
|
0.421843
|
0.851411
|
0.886052
|
0.975589
|
0.880576
|
|
Sum sq. resids
|
0.807513
|
0.527949
|
0.096627
|
0.020254
|
0.194566
|
|
S.E. equation
|
0.172939
|
0.139834
|
0.059823
|
0.027389
|
0.084889
|
|
F-statistic
|
5.669659
|
37.67185
|
50.76589
|
256.7778
|
48.19041
|
|
Log likelihood
|
14.39504
|
21.40686
|
49.42621
|
75.20757
|
37.87760
|
|
Akaike AIC
|
-0.508790
|
-0.933749
|
-2.631891
|
-4.194398
|
-1.931976
|
|
Schwarz SC
|
-0.236698
|
-0.661657
|
-2.359799
|
-3.922306
|
-1.659884
|
|
Mean dependent
|
4.202674
|
8.514157
|
4.328230
|
4.329735
|
4.141739
|
|
S.D. dependent
|
0.227442
|
0.362761
|
0.177220
|
0.175300
|
0.245644
|
|
Determinant Residual Covariance
|
2.25E-12
|
|
|
|
|
Log Likelihood
|
208.3760
|
|
|
|
|
Akaike Information Criteria
|
-10.81067
|
-10.82271
|
-11.10134
|
-11.42893
|
|
Schwarz Criteria
|
-9.450204
|
-8.303478
|
-7.400730
|
-6.524736
|
|
Date: 05/11/06 Time: 15:55
|
|
Sample(adjusted): 1972 2003
|
|
Included observations: 32 after adjusting endpoints
|
|
Standard errors & t-statistics in parentheses
|
|
LPRC
|
LNSUB
|
LPRO
|
LCONS
|
LPRP
|
|
LPRC(-1)
|
0.054017
|
0.167893
|
0.296354
|
-0.122028
|
0.177222
|
|
(0.23839)
|
(0.21391)
|
(0.07140)
|
(0.03788)
|
(0.11618)
|
|
(0.22659)
|
(0.78486)
|
(4.15080)
|
(-3.22144)
|
(1.52541)
|
|
|
|
|
|
|
|
LPRC(-2)
|
-0.191853
|
0.220860
|
-0.154710
|
0.068977
|
0.028441
|
|
(0.33366)
|
(0.29940)
|
(0.09993)
|
(0.05302)
|
(0.16261)
|
|
(-0.57499)
|
(0.73768)
|
(-1.54820)
|
(1.30103)
|
(0.17491)
|
|
|
|
|
|
|
|
LNSUB(-1)
|
0.235207
|
0.339353
|
-0.260789
|
-0.034177
|
0.061208
|
|
(0.25571)
|
(0.22945)
|
(0.07658)
|
(0.04063)
|
(0.12462)
|
|
(0.91982)
|
(1.47896)
|
(-3.40530)
|
(-0.84115)
|
(0.49116)
|
|
|
|
|
|
|
|
LNSUB(-2)
|
0.215523
|
-0.167257
|
0.105220
|
0.024496
|
0.042116
|
|
(0.26916)
|
(0.24152)
|
(0.08061)
|
(0.04277)
|
(0.13117)
|
|
(0.80072)
|
(-0.69251)
|
(1.30527)
|
(0.57275)
|
(0.32107)
|
|
|
|
|
|
|
|
LPRO(-1)
|
-0.954584
|
-0.712120
|
0.579659
|
0.023316
|
-0.315089
|
|
(0.68804)
|
(0.61739)
|
(0.20606)
|
(0.10933)
|
(0.33531)
|
|
(-1.38740)
|
(-1.15344)
|
(2.81303)
|
(0.21327)
|
(-0.93969)
|
|
|
|
|
|
|
|
LPRO(-2)
|
-0.086501
|
0.056477
|
-0.361435
|
-0.066581
|
-0.234434
|
|
(0.56393)
|
(0.50602)
|
(0.16889)
|
(0.08961)
|
(0.27483)
|
|
(-0.15339)
|
(0.11161)
|
(-2.14005)
|
(-0.74305)
|
(-0.85303)
|
|
|
|
|
|
|
|
LCONS(-1)
|
0.992224
|
1.459671
|
0.196767
|
0.966773
|
1.336411
|
|
(1.27334)
|
(1.14259)
|
(0.38136)
|
(0.20233)
|
(0.62056)
|
|
(0.77923)
|
(1.27751)
|
(0.51597)
|
(4.77820)
|
(2.15357)
|
|
|
|
|
|
|
|
LCONS(-2)
|
-1.307031
|
0.567750
|
0.766128
|
0.024890
|
-0.830475
|
|
(1.19682)
|
(1.07392)
|
(0.35844)
|
(0.19017)
|
(0.58326)
|
|
(-1.09209)
|
(0.52867)
|
(2.13742)
|
(0.13088)
|
(-1.42385)
|
|
|
|
|
|
|
|
LPRP(-1)
|
0.631784
|
-0.151012
|
-0.212215
|
0.027226
|
0.965613
|
|
(0.42568)
|
(0.38197)
|
(0.12749)
|
(0.06764)
|
(0.20745)
|
|
(1.48419)
|
(-0.39535)
|
(-1.66462)
|
(0.40252)
|
(4.65467)
|
|
|
|
|
|
|
|
LPRP(-2)
|
-0.185877
|
0.070733
|
0.262675
|
0.013697
|
-0.333759
|
|
(0.34410)
|
(0.30877)
|
(0.10306)
|
(0.05468)
|
(0.16770)
|
|
(-0.54018)
|
(0.22908)
|
(2.54887)
|
(0.25052)
|
(-1.99026)
|
|
|
|
|
|
|
|
C
|
4.960554
|
-0.142300
|
-0.237564
|
0.376907
|
-0.032798
|
|
(1.30409)
|
(1.17018)
|
(0.39056)
|
(0.20722)
|
(0.63554)
|
|
(3.80384)
|
(-0.12161)
|
(-0.60826)
|
(1.81891)
|
(-0.05161)
|
|
R-squared
|
0.523496
|
0.853348
|
0.941023
|
0.982867
|
0.910389
|
|
Adj. R-squared
|
0.296590
|
0.783514
|
0.912939
|
0.974708
|
0.867718
|
|
Sum sq. resids
|
0.618896
|
0.498322
|
0.055512
|
0.015626
|
0.146991
|
|
S.E. equation
|
0.171672
|
0.154044
|
0.051414
|
0.027278
|
0.083663
|
|
F-statistic
|
2.307101
|
12.21965
|
33.50710
|
120.4683
|
21.33473
|
|
Log likelihood
|
17.72283
|
21.18987
|
56.30421
|
76.58685
|
40.72389
|
|
Akaike AIC
|
-0.420177
|
-0.636867
|
-2.831513
|
-4.099178
|
-1.857743
|
|
Schwarz SC
|
0.083670
|
-0.133020
|
-2.327667
|
-3.595331
|
-1.353897
|
|
Mean dependent
|
4.221048
|
8.541905
|
4.336001
|
4.337954
|
4.158327
|
|
S.D. dependent
|
0.204689
|
0.331079
|
0.174250
|
0.171523
|
0.230030
|
|
Determinant Residual Covariance
|
4.41E-13
|
|
|
|
|
Log Likelihood
|
228.1634
|
|
|
|
|
Akaike Information Criteria
|
-10.82271
|
|
|
|
|
Schwarz Criteria
|
-8.303478
|
|
|
|
|
Date: 05/11/06 Time: 15:57
|
|
Sample(adjusted): 1973 2003
|
|
Included observations: 31 after adjusting endpoints
|
|
Standard errors & t-statistics in parentheses
|
|
LPRC
|
LNSUB
|
LPRO
|
LCONS
|
LPRP
|
|
LPRC(-1)
|
-0.245937
|
0.068784
|
0.234987
|
-0.165855
|
0.086595
|
|
(0.21720)
|
(0.29678)
|
(0.08511)
|
(0.04853)
|
(0.14591)
|
|
(-1.13228)
|
(0.23177)
|
(2.76082)
|
(-3.41779)
|
(0.59348)
|
|
|
|
|
|
|
|
LPRC(-2)
|
0.413556
|
0.159916
|
-0.119117
|
0.079895
|
0.183662
|
|
(0.38810)
|
(0.53028)
|
(0.15208)
|
(0.08671)
|
(0.26071)
|
|
(1.06560)
|
(0.30157)
|
(-0.78324)
|
(0.92144)
|
(0.70446)
|
|
|
|
|
|
|
|
LPRC(-3)
|
-1.104008
|
0.034854
|
-0.075947
|
-0.064501
|
-0.224231
|
|
(0.34948)
|
(0.47751)
|
(0.13695)
|
(0.07808)
|
(0.23477)
|
|
(-3.15903)
|
(0.07299)
|
(-0.55457)
|
(-0.82611)
|
(-0.95512)
|
|
|
|
|
|
|
|
LNSUB(-1)
|
0.367848
|
0.401346
|
-0.205604
|
-0.010779
|
0.099138
|
|
(0.21292)
|
(0.29093)
|
(0.08344)
|
(0.04757)
|
(0.14304)
|
|
(1.72761)
|
(1.37953)
|
(-2.46417)
|
(-0.22659)
|
(0.69310)
|
|
|
|
|
|
|
|
LNSUB(-2)
|
0.036283
|
-0.409798
|
0.029598
|
0.002050
|
0.046809
|
|
(0.28917)
|
(0.39511)
|
(0.11332)
|
(0.06461)
|
(0.19426)
|
|
(0.12547)
|
(-1.03716)
|
(0.26120)
|
(0.03173)
|
(0.24097)
|
|
|
|
|
|
|
|
LNSUB(-3)
|
0.144111
|
0.243795
|
0.174075
|
0.065224
|
-0.048788
|
|
(0.24170)
|
(0.33025)
|
(0.09471)
|
(0.05400)
|
(0.16237)
|
|
(0.59624)
|
(0.73821)
|
(1.83788)
|
(1.20785)
|
(-0.30048)
|
|
|
|
|
|
|
|
LPRO(-1)
|
-2.500951
|
-0.862791
|
0.491919
|
-0.049179
|
-0.798061
|
|
(0.81222)
|
(1.10978)
|
(0.31828)
|
(0.18146)
|
(0.54562)
|
|
(-3.07917)
|
(-0.77744)
|
(1.54555)
|
(-0.27102)
|
(-1.46266)
|
|
|
|
|
|
|
|
LPRO(-2)
|
0.751703
|
0.243756
|
-0.073719
|
0.045987
|
-0.065033
|
|
(0.68931)
|
(0.94184)
|
(0.27012)
|
(0.15400)
|
(0.46306)
|
|
(1.09052)
|
(0.25881)
|
(-0.27292)
|
(0.29861)
|
(-0.14044)
|
|
|
|
|
|
|
|
LPRO(-3)
|
-0.479734
|
-0.183035
|
-0.150010
|
-0.101153
|
-0.292767
|
|
(0.51487)
|
(0.70350)
|
(0.20176)
|
(0.11503)
|
(0.34588)
|
|
(-0.93175)
|
(-0.26018)
|
(-0.74350)
|
(-0.87936)
|
(-0.84645)
|
|
|
|
|
|
|
|
LCONS(-1)
|
2.869136
|
0.947850
|
0.106287
|
0.942211
|
1.890448
|
|
(1.24666)
|
(1.70338)
|
(0.48852)
|
(0.27852)
|
(0.83747)
|
|
(2.30146)
|
(0.55645)
|
(0.21757)
|
(3.38289)
|
(2.25734)
|
|
|
|
|
|
|
|
LCONS(-2)
|
-5.020108
|
0.446684
|
1.106218
|
0.146441
|
-1.307816
|
|
(1.58014)
|
(2.15904)
|
(0.61920)
|
(0.35303)
|
(1.06149)
|
|
(-3.17700)
|
(0.20689)
|
(1.78652)
|
(0.41481)
|
(-1.23205)
|
|
|
|
|
|
|
|
LCONS(-3)
|
2.453802
|
0.502073
|
-0.624952
|
-0.215713
|
0.355910
|
|
(1.03224)
|
(1.41041)
|
(0.40450)
|
(0.23062)
|
(0.69343)
|
|
(2.37717)
|
(0.35598)
|
(-1.54501)
|
(-0.93537)
|
(0.51326)
|
|
|
|
|
|
|
|
LPRP(-1)
|
0.620927
|
0.055480
|
-0.173332
|
0.043248
|
1.019617
|
|
(0.36526)
|
(0.49907)
|
(0.14313)
|
(0.08160)
|
(0.24537)
|
|
(1.69998)
|
(0.11117)
|
(-1.21100)
|
(0.52997)
|
(4.15546)
|
|
|
|
|
|
|
|
LPRP(-2)
|
0.411054
|
-0.336099
|
0.172165
|
0.007776
|
-0.445740
|
|
(0.49126)
|
(0.67124)
|
(0.19251)
|
(0.10976)
|
(0.33001)
|
|
(0.83673)
|
(-0.50071)
|
(0.89432)
|
(0.07085)
|
(-1.35067)
|
|
|
|
|
|
|
|
LPRP(-3)
|
0.096060
|
0.277100
|
0.076103
|
0.044549
|
0.273411
|
|
(0.34335)
|
(0.46915)
|
(0.13455)
|
(0.07671)
|
(0.23066)
|
|
(0.27977)
|
(0.59065)
|
(0.56561)
|
(0.58075)
|
(1.18537)
|
|
|
|
|
|
|
|
C
|
7.149779
|
0.751159
|
0.182226
|
0.772576
|
0.547116
|
|
(1.43402)
|
(1.95939)
|
(0.56194)
|
(0.32038)
|
(0.96333)
|
|
(4.98582)
|
(0.38336)
|
(0.32428)
|
(2.41142)
|
(0.56794)
|
|
R-squared
|
0.786643
|
0.839456
|
0.958332
|
0.985682
|
0.912131
|
|
Adj. R-squared
|
0.573286
|
0.678912
|
0.916665
|
0.971363
|
0.824261
|
|
Sum sq. resids
|
0.242786
|
0.453267
|
0.037282
|
0.012119
|
0.109564
|
|
S.E. equation
|
0.127223
|
0.173833
|
0.049854
|
0.028424
|
0.085465
|
|
F-statistic
|
3.686976
|
5.228821
|
22.99948
|
68.84061
|
10.38053
|
|
Log likelihood
|
31.18113
|
21.50445
|
60.22302
|
77.64150
|
43.51409
|
|
Akaike AIC
|
-0.979427
|
-0.355126
|
-2.853098
|
-3.976871
|
-1.775103
|
|
Schwarz SC
|
-0.239305
|
0.384997
|
-2.112976
|
-3.236748
|
-1.034980
|
|
Mean dependent
|
4.233784
|
8.565974
|
4.342848
|
4.346090
|
4.178243
|
|
S.D. dependent
|
0.194759
|
0.306775
|
0.172699
|
0.167965
|
0.203870
|
|
Determinant Residual Covariance
|
5.95E-14
|
|
|
|
|
Log Likelihood
|
252.0708
|
|
|
|
|
Akaike Information Criteria
|
-11.10134
|
|
|
|
|
Schwarz Criteria
|
-7.400730
|
|
|
|
|
Date: 05/11/06 Time: 16:01
|
|
Sample(adjusted): 1974 2003
|
|
Included observations: 30 after adjusting endpoints
|
|
Standard errors & t-statistics in parentheses
|
|
LPRC
|
LNSUB
|
LPRO
|
LCONS
|
LPRP
|
|
LPRC(-1)
|
-0.226373
|
0.542015
|
0.184618
|
-0.162003
|
-0.000788
|
|
(0.43478)
|
(0.58920)
|
(0.17405)
|
(0.09883)
|
(0.32041)
|
|
(-0.52066)
|
(0.91992)
|
(1.06069)
|
(-1.63918)
|
(-0.00246)
|
|
|
|
|
|
|
|
LPRC(-2)
|
0.549416
|
0.215517
|
-0.168977
|
0.052860
|
0.080895
|
|
(0.43932)
|
(0.59534)
|
(0.17587)
|
(0.09986)
|
(0.32375)
|
|
(1.25062)
|
(0.36201)
|
(-0.96080)
|
(0.52933)
|
(0.24987)
|
|
|
|
|
|
|
|
LPRC(-3)
|
-0.938749
|
0.370471
|
0.056750
|
-0.104554
|
-0.233053
|
|
(0.49139)
|
(0.66591)
|
(0.19672)
|
(0.11170)
|
(0.36213)
|
|
(-1.91038)
|
(0.55634)
|
(0.28848)
|
(-0.93603)
|
(-0.64357)
|
|
|
|
|
|
|
|
LPRC(-4)
|
-0.019533
|
0.578245
|
-0.172632
|
0.056250
|
-0.142389
|
|
(0.65439)
|
(0.88679)
|
(0.26197)
|
(0.14875)
|
(0.48224)
|
|
(-0.02985)
|
(0.65206)
|
(-0.65898)
|
(0.37815)
|
(-0.29526)
|
|
|
|
|
|
|
|
LNSUB(-1)
|
0.441311
|
0.260112
|
-0.212714
|
-0.021185
|
0.097884
|
|
(0.28327)
|
(0.38387)
|
(0.11340)
|
(0.06439)
|
(0.20875)
|
|
(1.55793)
|
(0.67760)
|
(-1.87579)
|
(-0.32901)
|
(0.46890)
|
|
|
|
|
|
|
|
LNSUB(-2)
|
0.016328
|
-0.310667
|
0.073766
|
0.001531
|
0.077325
|
|
(0.32863)
|
(0.44534)
|
(0.13156)
|
(0.07470)
|
(0.24218)
|
|
(0.04968)
|
(-0.69759)
|
(0.56070)
|
(0.02050)
|
(0.31929)
|
|
|
|
|
|
|
|
LNSUB(-3)
|
0.230263
|
0.129316
|
0.063591
|
0.101209
|
-0.075947
|
|
(0.36134)
|
(0.48967)
|
(0.14465)
|
(0.08214)
|
(0.26628)
|
|
(0.63725)
|
(0.26409)
|
(0.43961)
|
(1.23221)
|
(-0.28521)
|
|
|
|
|
|
|
|
LNSUB(-4)
|
-0.121277
|
-0.405189
|
0.111100
|
-0.073903
|
0.078171
|
|
(0.33098)
|
(0.44853)
|
(0.13250)
|
(0.07524)
|
(0.24391)
|
|
(-0.36642)
|
(-0.90337)
|
(0.83849)
|
(-0.98228)
|
(0.32049)
|
|
|
|
|
|
|
|
LPRO(-1)
|
-2.477442
|
0.073842
|
0.372196
|
0.065756
|
-0.904958
|
|
(1.12731)
|
(1.52767)
|
(0.45129)
|
(0.25625)
|
(0.83076)
|
|
(-2.19767)
|
(0.04834)
|
(0.82474)
|
(0.25661)
|
(-1.08932)
|
|
|
|
|
|
|
|
LPRO(-2)
|
0.568162
|
0.184654
|
-0.488380
|
0.116314
|
-0.393010
|
|
(1.17650)
|
(1.59433)
|
(0.47098)
|
(0.26743)
|
(0.86701)
|
|
(0.48293)
|
(0.11582)
|
(-1.03694)
|
(0.43493)
|
(-0.45330)
|
|
|
|
|
|
|
|
LPRO(-3)
|
-0.385009
|
-0.304832
|
0.088451
|
-0.240408
|
-0.264362
|
|
(0.79768)
|
(1.08098)
|
(0.31933)
|
(0.18132)
|
(0.58784)
|
|
(-0.48266)
|
(-0.28200)
|
(0.27699)
|
(-1.32585)
|
(-0.44972)
|
|
|
|
|
|
|
|
LPRO(-4)
|
-0.332337
|
0.199262
|
-0.159839
|
0.160311
|
-0.268490
|
|
(0.66419)
|
(0.90008)
|
(0.26589)
|
(0.15098)
|
(0.48947)
|
|
(-0.50036)
|
(0.22138)
|
(-0.60114)
|
(1.06180)
|
(-0.54853)
|
|
|
|
|
|
|
|
LCONS(-1)
|
3.188688
|
1.247296
|
0.039658
|
0.887472
|
1.547912
|
|
(1.43578)
|
(1.94570)
|
(0.57478)
|
(0.32637)
|
(1.05808)
|
|
(2.22088)
|
(0.64105)
|
(0.06900)
|
(2.71921)
|
(1.46294)
|
|
|
|
|
|
|
|
LCONS(-2)
|
-4.653193
|
0.296322
|
1.607146
|
0.062645
|
-0.758469
|
|
(2.30862)
|
(3.12853)
|
(0.92420)
|
(0.52478)
|
(1.70131)
|
|
(-2.01558)
|
(0.09472)
|
(1.73896)
|
(0.11937)
|
(-0.44582)
|
|
|
|
|
|
|
|
LCONS(-3)
|
2.693801
|
0.700174
|
-1.382048
|
-0.348192
|
0.093905
|
|
(2.40267)
|
(3.25599)
|
(0.96185)
|
(0.54616)
|
(1.77062)
|
|
(1.12117)
|
(0.21504)
|
(-1.43686)
|
(-0.63753)
|
(0.05303)
|
|
|
|
|
|
|
|
LCONS(-4)
|
-0.298093
|
0.418181
|
0.545769
|
0.145026
|
0.294286
|
|
(1.33842)
|
(1.81377)
|
(0.53581)
|
(0.30424)
|
(0.98634)
|
|
(-0.22272)
|
(0.23056)
|
(1.01859)
|
(0.47668)
|
(0.29836)
|
|
|
|
|
|
|
|
LPRP(-1)
|
0.573966
|
-0.079010
|
-0.210639
|
0.043197
|
0.902372
|
|
(0.44493)
|
(0.60295)
|
(0.17812)
|
(0.10114)
|
(0.32789)
|
|
(1.29000)
|
(-0.13104)
|
(-1.18257)
|
(0.42711)
|
(2.75207)
|
|
|
|
|
|
|
|
LPRP(-2)
|
0.192267
|
-0.323267
|
0.341200
|
0.052700
|
-0.194420
|
|
(0.62844)
|
(0.85163)
|
(0.25158)
|
(0.14285)
|
(0.46312)
|
|
(0.30594)
|
(-0.37959)
|
(1.35623)
|
(0.36891)
|
(-0.41981)
|
|
|
|
|
|
|
|
LPRP(-3)
|
0.302981
|
-0.691553
|
-0.167577
|
0.016095
|
0.158251
|
|
(0.72023)
|
(0.97602)
|
(0.28833)
|
(0.16372)
|
(0.53076)
|
|
(0.42067)
|
(-0.70854)
|
(-0.58121)
|
(0.09831)
|
(0.29816)
|
|
|
|
|
|
|
|
LPRP(-4)
|
-0.159187
|
0.304551
|
0.260099
|
-0.008189
|
0.209983
|
|
(0.40673)
|
(0.55118)
|
(0.16282)
|
(0.09245)
|
(0.29973)
|
|
(-0.39138)
|
(0.55254)
|
(1.59742)
|
(-0.08858)
|
(0.70056)
|
|
|
|
|
|
|
|
C
|
5.598849
|
-4.751686
|
0.856996
|
0.838139
|
2.253647
|
|
(3.46637)
|
(4.69746)
|
(1.38768)
|
(0.78795)
|
(2.55450)
|
|
(1.61519)
|
(-1.01154)
|
(0.61757)
|
(1.06369)
|
(0.88223)
|
|
R-squared
|
0.847344
|
0.879766
|
0.967549
|
0.988648
|
0.896895
|
|
Adj. R-squared
|
0.508108
|
0.612579
|
0.895436
|
0.963421
|
0.667774
|
|
Sum sq. resids
|
0.172065
|
0.315987
|
0.027575
|
0.008891
|
0.093445
|
|
S.E. equation
|
0.138269
|
0.187376
|
0.055353
|
0.031430
|
0.101896
|
|
F-statistic
|
2.497799
|
3.292700
|
13.41705
|
39.18994
|
3.914493
|
|
Log likelihood
|
34.84806
|
25.73061
|
62.31225
|
79.29084
|
44.00557
|
|
Akaike AIC
|
-0.923204
|
-0.315374
|
-2.754150
|
-3.886056
|
-1.533705
|
|
Schwarz SC
|
0.057634
|
0.665464
|
-1.773312
|
-2.905218
|
-0.552866
|
|
Mean dependent
|
4.230377
|
8.580462
|
4.349803
|
4.354332
|
4.197379
|
|
S.D. dependent
|
0.197147
|
0.301038
|
0.171178
|
0.164336
|
0.176782
|
|
Determinant Residual Covariance
|
6.82E-15
|
|
|
|
|
Log Likelihood
|
276.4339
|
|
|
|
|
Akaike Information Criteria
|
-11.42893
|
|
|
|
|
Schwarz Criteria
|
-6.524736
|
|
|
|
Conclusion : p=1.
4 et
5- Test de cointégration et Identification du nombre de relation
Démarches préliminaires pour le choix du
type d'estimation :
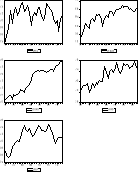
Conclusion : les variables présentent
des tendances et des constantes
Estimation
|
Date: 04/19/06 Time: 21:08
|
|
Sample: 1970 2003
|
|
Included observations: 32
|
|
Test assumption: Linear deterministic trend in the data
|
|
|
|
|
|
|
Series: LPRC LNSUB LCONS LPRO LPRP
|
|
Lags interval: 1 to 1
|
|
Likelihood
|
5 Percent
|
1 Percent
|
Hypothesized
|
|
|
Eigenvalue
|
Ratio
|
Critical Value
|
Critical Value
|
No. of CE(s)
|
|
|
0.611985
|
85.14212
|
68.52
|
76.07
|
None **
|
|
0.530836
|
54.84738
|
47.21
|
54.46
|
At most 1 **
|
|
0.395104
|
30.62966
|
29.68
|
35.65
|
At most 2 *
|
|
0.343720
|
14.54330
|
15.41
|
20.04
|
At most 3
|
|
0.032762
|
1.065957
|
3.76
|
6.65
|
At most 4
|
|
*(**) denotes rejection of the hypothesis at 5%(1%)
significance level
|
|
|
|
|
|
|
L.R. test indicates 3 cointegrating equation(s) at 5%
significance level
|
|
|
|
|
|
|
|
|
|
|
|
|
Unnormalized Cointegrating Coefficients:
|
|
LPRC
|
LNSUB
|
LCONS
|
LPRO
|
LPRP
|
|
|
-0.945457
|
0.321664
|
2.447826
|
-3.948896
|
0.885794
|
|
|
-1.516209
|
0.587783
|
-3.439992
|
1.888552
|
0.622787
|
|
|
-0.765169
|
1.473529
|
-3.287545
|
0.822495
|
0.262914
|
|
|
-0.514963
|
-0.371339
|
-1.444340
|
1.713768
|
1.238298
|
|
|
-0.128405
|
-0.106953
|
1.615928
|
-0.247785
|
-0.311950
|
|
|
|
|
|
|
|
|
Normalized Cointegrating Coefficients: 1 Cointegrating
Equation(s)
|
|
|
|
|
|
|
LPRC
|
LNSUB
|
LCONS
|
LPRO
|
LPRP
|
C
|
|
1.000000
|
-0.340221
|
-2.589041
|
4.176708
|
-0.936895
|
-4.290731
|
|
(0.19966)
|
(1.42312)
|
(1.47951)
|
(0.18836)
|
|
|
|
|
|
|
|
|
Log likelihood
|
200.7397
|
|
|
|
|
|
|
|
|
|
|
|
Normalized Cointegrating Coefficients: 2 Cointegrating
Equation(s)
|
|
|
|
|
|
|
LPRC
|
LNSUB
|
LCONS
|
LPRO
|
LPRP
|
C
|
|
1.000000
|
0.000000
|
-37.42325
|
43.05829
|
-4.709709
|
-9.056512
|
|
|
(193.217)
|
(218.834)
|
(20.5612)
|
|
|
0.000000
|
1.000000
|
-102.3871
|
114.2834
|
-11.08932
|
-14.00792
|
|
|
(519.847)
|
(588.769)
|
(55.3197)
|
|
|
|
|
|
|
|
|
Log likelihood
|
212.8486
|
|
|
|
|
|
|
|
|
|
|
|
Normalized Cointegrating Coefficients: 3 Cointegrating
Equation(s)
|
|
|
|
|
|
|
LPRC
|
LNSUB
|
LCONS
|
LPRO
|
LPRP
|
C
|
|
1.000000
|
0.000000
|
0.000000
|
0.700911
|
-0.619779
|
-4.663857
|
|
|
|
(0.19598)
|
(0.16195)
|
|
|
0.000000
|
1.000000
|
0.000000
|
-1.603080
|
0.100418
|
-1.989950
|
|
|
|
(0.32894)
|
(0.27181)
|
|
|
0.000000
|
0.000000
|
1.000000
|
-1.131846
|
0.109288
|
0.117378
|
|
|
|
(0.05883)
|
(0.04861)
|
|
|
|
|
|
|
|
|
Log likelihood
|
220.8917
|
|
|
|
|
|
|
|
|
|
|
|
Normalized Cointegrating Coefficients: 4 Cointegrating
Equation(s)
|
|
|
|
|
|
|
LPRC
|
LNSUB
|
LCONS
|
LPRO
|
LPRP
|
C
|
|
1.000000
|
0.000000
|
0.000000
|
0.000000
|
4.407756
|
-22.46227
|
|
|
|
|
(14.2290)
|
|
|
0.000000
|
1.000000
|
0.000000
|
0.000000
|
-11.39825
|
38.71748
|
|
|
|
|
(29.9442)
|
|
|
0.000000
|
0.000000
|
1.000000
|
0.000000
|
-8.009287
|
28.85866
|
|
|
|
|
(21.7943)
|
|
|
0.000000
|
0.000000
|
0.000000
|
1.000000
|
-7.172860
|
25.39327
|
|
|
|
|
(19.3764)
|
|
|
|
|
|
|
|
|
Log likelihood
|
227.6304
|
|
|
|
|
6- Estimation par le MV du MVCE
Une seule relation de cointégration
|
Date: 04/19/06 Time: 20:47
|
|
Sample(adjusted): 1972 2003
|
|
Included observations: 32 after adjusting endpoints
|
|
Standard errors & t-statistics in parentheses
|
|
Cointegrating Eq:
|
CointEq1
|
|
|
|
|
|
LPRC(-1)
|
1.000000
|
|
|
|
|
|
|
|
|
|
|
|
LNSUB(-1)
|
-0.340221
|
|
|
|
|
|
(0.19966)
|
|
|
|
|
|
(-1.70402)
|
|
|
|
|
|
|
|
|
|
|
|
LCONS(-1)
|
-2.589041
|
|
|
|
|
|
(1.42312)
|
|
|
|
|
|
(-1.81927)
|
|
|
|
|
|
|
|
|
|
|
|
LPRO(-1)
|
4.176708
|
|
|
|
|
|
(1.47951)
|
|
|
|
|
|
(2.82303)
|
|
|
|
|
|
|
|
|
|
|
|
LPRP(-1)
|
-0.936895
|
|
|
|
|
|
(0.18836)
|
|
|
|
|
|
(-4.97407)
|
|
|
|
|
|
|
|
|
|
|
|
C
|
-4.290731
|
|
|
|
|
|
Error Correction:
|
D(LPRC)
|
D(LNSUB)
|
D(LCONS)
|
D(LPRO)
|
D(LPRP)
|
|
CointEq1
|
-0.408546
|
-0.049574
|
-0.022115
|
-0.121356
|
0.000784
|
|
(0.19035)
|
(0.16979)
|
(0.02553)
|
(0.05467)
|
(0.08981)
|
|
(-2.14633)
|
(-0.29197)
|
(-0.86612)
|
(-2.21988)
|
(0.00873)
|
|
|
|
|
|
|
|
D(LPRC(-1))
|
-0.316397
|
0.301299
|
-0.087310
|
0.379427
|
0.210096
|
|
(0.18775)
|
(0.16748)
|
(0.02518)
|
(0.05392)
|
(0.08859)
|
|
(-1.68519)
|
(1.79904)
|
(-3.46676)
|
(7.03654)
|
(2.37164)
|
|
|
|
|
|
|
|
D(LNSUB(-1))
|
0.118426
|
-0.259614
|
-0.024495
|
-0.244631
|
0.040542
|
|
(0.24860)
|
(0.22175)
|
(0.03335)
|
(0.07140)
|
(0.11729)
|
|
(0.47638)
|
(-1.17074)
|
(-0.73457)
|
(-3.42636)
|
(0.34565)
|
|
|
|
|
|
|
|
D(LCONS(-1))
|
1.195784
|
0.800612
|
0.014164
|
-0.548300
|
0.663415
|
|
(1.30534)
|
(1.16439)
|
(0.17510)
|
(0.37489)
|
(0.61590)
|
|
(0.91607)
|
(0.68758)
|
(0.08089)
|
(-1.46255)
|
(1.07715)
|
|
|
|
|
|
|
|
D(LPRO(-1))
|
-0.087055
|
0.237999
|
0.085543
|
0.428219
|
-0.045992
|
|
(0.62141)
|
(0.55431)
|
(0.08336)
|
(0.17847)
|
(0.29320)
|
|
(-0.14009)
|
(0.42936)
|
(1.02623)
|
(2.39938)
|
(-0.15686)
|
|
|
|
|
|
|
|
D(LPRP(-1))
|
-0.022968
|
-0.083023
|
-0.014327
|
-0.206414
|
0.345722
|
|
(0.38538)
|
(0.34376)
|
(0.05169)
|
(0.11068)
|
(0.18183)
|
|
(-0.05960)
|
(-0.24151)
|
(-0.27714)
|
(-1.86495)
|
(1.90132)
|
|
|
|
|
|
|
|
C
|
0.001501
|
0.028548
|
0.017616
|
0.022661
|
-0.005370
|
|
(0.04367)
|
(0.03895)
|
(0.00586)
|
(0.01254)
|
(0.02060)
|
|
(0.03437)
|
(0.73288)
|
(3.00730)
|
(1.80680)
|
(-0.26061)
|
|
R-squared
|
0.338084
|
0.203830
|
0.445777
|
0.717695
|
0.375007
|
|
Adj. R-squared
|
0.179224
|
0.012749
|
0.312763
|
0.649942
|
0.225008
|
|
Sum sq. resids
|
1.013322
|
0.806295
|
0.018233
|
0.083583
|
0.225589
|
|
S.E. equation
|
0.201328
|
0.179588
|
0.027006
|
0.057821
|
0.094992
|
|
F-statistic
|
2.128192
|
1.066723
|
3.351364
|
10.59279
|
2.500072
|
|
Log likelihood
|
9.834004
|
13.49063
|
74.11802
|
49.75638
|
33.87040
|
|
Akaike AIC
|
-0.177125
|
-0.405664
|
-4.194877
|
-2.672274
|
-1.679400
|
|
Schwarz SC
|
0.143504
|
-0.085034
|
-3.874247
|
-2.351644
|
-1.358770
|
|
Mean dependent
|
0.019029
|
0.039240
|
0.016097
|
0.013868
|
0.015572
|
|
S.D. dependent
|
0.222224
|
0.180744
|
0.032577
|
0.097728
|
0.107905
|
|
Determinant Residual Covariance
|
2.45E-12
|
|
|
|
|
Log Likelihood
|
200.7397
|
|
|
|
|
Akaike Information Criteria
|
-10.04623
|
|
|
|
|
Schwarz Criteria
|
-8.214061
|
|
|
|
Représentation
Estimation Proc:
===============================
EC 1 1 LPRC LNSUB LCONS LPRO LPRP @ C
VAR Model:
===============================
D(LPRC) = A(1,1)*(B(1,1)*LPRC(-1) + B(1,2)*LNSUB(-1) +
B(1,3)*LCONS(-1) + B(1,4)*LPRO(-1) + B(1,5)*LPRP(-1) + B(1,6)) +
C(1,1)*D(LPRC(-1)) + C(1,2)*D(LNSUB(-1)) + C(1,3)*D(LCONS(-1)) +
C(1,4)*D(LPRO(-1)) + C(1,5)*D(LPRP(-1)) + C(1,6)
D(LNSUB) = A(2,1)*(B(1,1)*LPRC(-1) + B(1,2)*LNSUB(-1) +
B(1,3)*LCONS(-1) + B(1,4)*LPRO(-1) + B(1,5)*LPRP(-1) + B(1,6)) +
C(2,1)*D(LPRC(-1)) + C(2,2)*D(LNSUB(-1)) + C(2,3)*D(LCONS(-1)) +
C(2,4)*D(LPRO(-1)) + C(2,5)*D(LPRP(-1)) + C(2,6)
D(LCONS) = A(3,1)*(B(1,1)*LPRC(-1) + B(1,2)*LNSUB(-1) +
B(1,3)*LCONS(-1) + B(1,4)*LPRO(-1) + B(1,5)*LPRP(-1) + B(1,6)) +
C(3,1)*D(LPRC(-1)) + C(3,2)*D(LNSUB(-1)) + C(3,3)*D(LCONS(-1)) +
C(3,4)*D(LPRO(-1)) + C(3,5)*D(LPRP(-1)) + C(3,6)
D(LPRO) = A(4,1)*(B(1,1)*LPRC(-1) + B(1,2)*LNSUB(-1) +
B(1,3)*LCONS(-1) + B(1,4)*LPRO(-1) + B(1,5)*LPRP(-1) + B(1,6)) +
C(4,1)*D(LPRC(-1)) + C(4,2)*D(LNSUB(-1)) + C(4,3)*D(LCONS(-1)) +
C(4,4)*D(LPRO(-1)) + C(4,5)*D(LPRP(-1)) + C(4,6)
D(LPRP) = A(5,1)*(B(1,1)*LPRC(-1) + B(1,2)*LNSUB(-1) +
B(1,3)*LCONS(-1) + B(1,4)*LPRO(-1) + B(1,5)*LPRP(-1) + B(1,6)) +
C(5,1)*D(LPRC(-1)) + C(5,2)*D(LNSUB(-1)) + C(5,3)*D(LCONS(-1)) +
C(5,4)*D(LPRO(-1)) + C(5,5)*D(LPRP(-1)) + C(5,6)
VAR Model - Substituted Coefficients:
===============================
D(LPRC) = - 0.4085463551*( LPRC(-1) - 0.3402205817*LNSUB(-1) -
2.589040839*LCONS(-1) + 4.176707946*LPRO(-1) - 0.9368954394*LPRP(-1) -
4.290730878 ) - 0.3163970841*D(LPRC(-1)) + 0.1184264556*D(LNSUB(-1)) +
1.195783779*D(LCONS(-1)) - 0.08705458523*D(LPRO(-1)) -
0.02296766631*D(LPRP(-1)) + 0.001500734796
D(LNSUB) = - 0.04957379141*( LPRC(-1) - 0.3402205817*LNSUB(-1) -
2.589040839*LCONS(-1) + 4.176707946*LPRO(-1) - 0.9368954394*LPRP(-1) -
4.290730878 ) + 0.301299125*D(LPRC(-1)) - 0.2596136987*D(LNSUB(-1)) +
0.8006116274*D(LCONS(-1)) + 0.2379992104*D(LPRO(-1)) -
0.08302317248*D(LPRP(-1)) + 0.02854829442
D(LCONS) = - 0.02211463955*( LPRC(-1) - 0.3402205817*LNSUB(-1) -
2.589040839*LCONS(-1) + 4.176707946*LPRO(-1) - 0.9368954394*LPRP(-1) -
4.290730878 ) - 0.0873100742*D(LPRC(-1)) - 0.02449539672*D(LNSUB(-1)) +
0.01416385047*D(LCONS(-1)) + 0.08554264835*D(LPRO(-1)) -
0.01432669387*D(LPRP(-1)) + 0.01761599735
D(LPRO) = - 0.1213556337*( LPRC(-1) - 0.3402205817*LNSUB(-1) -
2.589040839*LCONS(-1) + 4.176707946*LPRO(-1) - 0.9368954394*LPRP(-1) -
4.290730878 ) + 0.3794270341*D(LPRC(-1)) - 0.2446314623*D(LNSUB(-1)) -
0.5482998201*D(LCONS(-1)) + 0.428219454*D(LPRO(-1)) - 0.2064141313*D(LPRP(-1))
+ 0.02266051657
D(LPRP) = 0.000783830909*( LPRC(-1) - 0.3402205817*LNSUB(-1) -
2.589040839*LCONS(-1) + 4.176707946*LPRO(-1) - 0.9368954394*LPRP(-1) -
4.290730878 ) + 0.2100964483*D(LPRC(-1)) + 0.04054244061*D(LNSUB(-1)) +
0.6634154436*D(LCONS(-1)) - 0.04599184447*D(LPRO(-1)) +
0.3457220482*D(LPRP(-1)) - 0.005369653458
Test de résidus
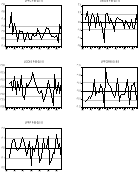
Fonctions de réponses
impulsionnelles.
Décompositions :
|
Variance Decomposition of LPRC:
|
|
|
|
|
|
|
|
Period
|
S.E.
|
LPRC
|
LNSUB
|
LCONS
|
LPRO
|
LPRP
|
|
1
|
0.177950
|
100.0000
|
0.000000
|
0.000000
|
0.000000
|
0.000000
|
|
2
|
0.224737
|
92.76315
|
0.042907
|
0.999760
|
4.614941
|
1.579239
|
|
3
|
0.250415
|
81.64260
|
1.541987
|
1.922280
|
7.687241
|
7.205891
|
|
4
|
0.279786
|
78.01703
|
2.556988
|
2.665882
|
6.681592
|
10.07851
|
|
5
|
0.312732
|
78.98321
|
2.305599
|
3.113555
|
5.626746
|
9.970885
|
|
6
|
0.338014
|
78.45788
|
2.128654
|
3.385928
|
5.722191
|
10.30535
|
|
7
|
0.359041
|
76.68254
|
2.264889
|
3.607509
|
6.055721
|
11.38934
|
|
8
|
0.380362
|
75.66115
|
2.429385
|
3.813191
|
5.921598
|
12.17467
|
|
9
|
0.401919
|
75.49406
|
2.421548
|
3.974179
|
5.688267
|
12.42194
|
|
10
|
0.421696
|
75.24749
|
2.386898
|
4.093908
|
5.637912
|
12.63379
|
|
Variance Decomposition of LNSUB:
|
|
|
|
|
|
|
|
Period
|
S.E.
|
LPRC
|
LNSUB
|
LCONS
|
LPRO
|
LPRP
|
|
1
|
0.158735
|
1.727629
|
98.27237
|
0.000000
|
0.000000
|
0.000000
|
|
2
|
0.211557
|
9.389397
|
89.45837
|
1.133594
|
0.000221
|
0.018419
|
|
3
|
0.249446
|
7.309824
|
90.40773
|
1.662055
|
0.508587
|
0.111809
|
|
4
|
0.286149
|
5.704806
|
91.39929
|
1.829460
|
0.615525
|
0.450921
|
|
5
|
0.318708
|
5.322459
|
91.59296
|
2.015113
|
0.513564
|
0.555902
|
|
6
|
0.346523
|
5.359920
|
91.45440
|
2.175593
|
0.460590
|
0.549492
|
|
7
|
0.372013
|
5.094383
|
91.58242
|
2.265670
|
0.482608
|
0.574915
|
|
8
|
0.396723
|
4.775078
|
91.77324
|
2.323489
|
0.493404
|
0.634787
|
|
9
|
0.420109
|
4.613206
|
91.86129
|
2.381447
|
0.473461
|
0.670592
|
|
10
|
0.441875
|
4.545254
|
91.88159
|
2.433958
|
0.457278
|
0.681925
|
|
Variance Decomposition of LCONS:
|
|
|
|
|
|
|
|
Period
|
S.E.
|
LPRC
|
LNSUB
|
LCONS
|
LPRO
|
LPRP
|
|
1
|
0.023870
|
1.220395
|
2.175287
|
96.60432
|
0.000000
|
0.000000
|
|
2
|
0.038378
|
19.32826
|
0.892465
|
79.76153
|
0.000652
|
0.017094
|
|
3
|
0.046280
|
21.25906
|
0.614073
|
77.73385
|
0.361234
|
0.031782
|
|
4
|
0.052034
|
19.46435
|
0.538843
|
79.23361
|
0.549189
|
0.214012
|
|
5
|
0.057577
|
19.47363
|
0.475963
|
79.31863
|
0.463928
|
0.267847
|
|
6
|
0.062942
|
20.38253
|
0.398314
|
78.58309
|
0.398431
|
0.237633
|
|
7
|
0.067730
|
20.48185
|
0.344025
|
78.54152
|
0.408756
|
0.223850
|
|
8
|
0.072080
|
20.21356
|
0.309885
|
78.80697
|
0.427827
|
0.241757
|
|
9
|
0.076222
|
20.19296
|
0.284794
|
78.85738
|
0.411439
|
0.253424
|
|
10
|
0.080211
|
20.34288
|
0.259059
|
78.75606
|
0.392540
|
0.249458
|
|
Variance Decomposition of LPRO:
|
|
|
|
|
|
|
|
Period
|
S.E.
|
LPRC
|
LNSUB
|
LCONS
|
LPRO
|
LPRP
|
|
1
|
0.051107
|
37.44247
|
17.99844
|
9.310427
|
35.24866
|
0.000000
|
|
2
|
0.060785
|
29.44052
|
16.35456
|
9.025741
|
43.74565
|
1.433534
|
|
3
|
0.064338
|
33.24483
|
15.32760
|
9.753118
|
39.04924
|
2.625215
|
|
4
|
0.078964
|
43.27088
|
11.66073
|
8.390601
|
25.93073
|
10.74706
|
|
5
|
0.087501
|
40.74812
|
10.80146
|
9.396841
|
24.10128
|
14.95229
|
|
6
|
0.091811
|
37.85349
|
9.850822
|
11.01503
|
25.20354
|
16.07712
|
|
7
|
0.095812
|
37.53976
|
9.050009
|
11.99559
|
24.06529
|
17.34935
|
|
8
|
0.101722
|
38.47024
|
8.260245
|
12.22775
|
21.90811
|
19.13365
|
|
9
|
0.107136
|
38.08169
|
7.757711
|
12.62038
|
20.88908
|
20.65113
|
|
10
|
0.111343
|
37.22760
|
7.301368
|
13.22719
|
20.63755
|
21.60629
|
|
Variance Decomposition of LPRP:
|
|
|
|
|
|
|
|
Period
|
S.E.
|
LPRC
|
LNSUB
|
LCONS
|
LPRO
|
LPRP
|
|
1
|
0.083962
|
5.190848
|
2.631411
|
0.648278
|
4.129500
|
87.39996
|
|
2
|
0.152715
|
20.91790
|
1.275266
|
0.338137
|
3.258430
|
74.21027
|
|
3
|
0.205261
|
19.92680
|
0.953353
|
0.873190
|
2.220944
|
76.02571
|
|
4
|
0.249917
|
16.89389
|
0.687501
|
1.222509
|
1.742035
|
79.45407
|
|
5
|
0.290051
|
15.82977
|
0.533596
|
1.443802
|
1.691697
|
80.50113
|
|
6
|
0.325633
|
15.82930
|
0.476776
|
1.600689
|
1.704477
|
80.38875
|
|
7
|
0.357278
|
15.62293
|
0.450008
|
1.699759
|
1.631533
|
80.59577
|
|
8
|
0.386469
|
15.22558
|
0.413819
|
1.765444
|
1.558848
|
81.03630
|
|
9
|
0.413902
|
14.98052
|
0.381863
|
1.819542
|
1.532055
|
81.28602
|
|
10
|
0.439633
|
14.89579
|
0.362796
|
1.864895
|
1.523117
|
81.35340
|
|
Ordering: LPRC LNSUB LCONS LPRO LPRP
|
|
|
|
|
|
|
ANNEXE 2 :Approche
mathématique et graphique de l'étude de Goreux(2003a)
P= prix mondial du coton défini par l'indice A21(*) exprimé en
cents par livre
Si = subvention accordée par le gouvernement
du pays i en cents par livre
Qi = quantité de coton produit par le pays i
en milliers de tonnes
QJ = quantité de coton produite sans
subvention par le pays j en milliers de tonnes
Q = quantité de coton produite dans l'ensemble du monde
en milliers de tonnes
E0 = coefficient d'élasticité de
l'offre ( positif)
Ed = coefficient d'élasticité de la
demande (négatif)
Ln = Logarithme
i = Indice caractérisant les pays à subventions
Etats-Unis, Chine, UE (Grèce et Espagne)
j = Indice caractérisant les pays sans
subventions : reste du monde
* 21 L'indice A de cotlook est
un indicateur sans précédent du marché mondial des prix du
coton
| 
