|

Graduating Project
The determinants of green consumption
A study of socio-demographics factors as
determinants
MSC in International Marketing
Marine ETIEVENT
1st of December 2011
Graduating project supervisor: Dr. Yann Truong
Abstract
The main objective of this thesis is to investigate if the
socio-demographics factors could be seen as determinants of the consumption of
green products, in order to see if green consumers could have a specific
profile; if according to specific factors they are willing to consume or not
green products.
This paper permits to review the main determinants and barrier
of green consumption. In addition, this study permits to report the results of
a questionnaire held by 150 respondents in order to get accurate information
about the respondents (gender, income, education, place of living etc.) and
insight about their knowledge on this topic and their habits in term of green
consumption (if they are consuming).
Results from regression analysis revealed that the
socio-demographics factors do not seem to be linked to the consumption of green
products. Surprisingly, green purchases are not significantly related to
monetary barriers, or to the socioeconomic characteristics of the consumers. It
appears that pro-environmental behaviour or gender has an effect upon the
consumption of green products. Recommendations for business were established in
order to get insight about the profile of green consumers.

Acknowledgement
I would like to express my gratitude to my supervisor, Dr.
Yann Truong, whose expertise, understanding, and patience, added considerably
to my graduate experience. I appreciate his vast knowledge and skill in many
areas, and his assistance in writing reports.
I would like to thank my internship supervisor, Mrs Leroy, for
the assistance they provided at all levels of the research project.
Finally, I would like to thank Mrs Curley for taking time out
from his busy schedule to serve as my external reader.

Table of contents
Abstract~~~~~~~~~~~~~~~~~~~~~~~~~~ ~~~~~ -2-
Acknowledgment. -3-
List of figures -8-
List of tables~~~~~~~~~~~~~~~~~~~~~~~~~~~~~~~~~~~~~
-9-
Introduction~~~~~~~~~~~~~~~~~~~~~~~~~~~~~~~~~~~~~
-11-
I. Literature Review~~~~~~~~~~~~~~~~~~~~~~~~~~~~~~~~~
-12-
|
1.1 Environmental
Concern~~~~~~~~~~~~~~~~~~~~~~~~~~
-13-
|
|
|
1.2 Determinants of green consumption
|
-14-
|
|
1.3 Conclusion
|
-17-
|
1.4 Constraints to green consumption
|
-18-
|
|
|
1.5 Conclusion
|
-20-
|
|
II. Methodology
|
-21-
|
2.1 Research overview
|
-22-
|
|
2.1.1 Definition of the studied
variables......................................................... -22-
2.1.2 Research
objectives.................................................................................
-22-
2.2 Hypotheses -23-
2.2.1 H1: socio-economical characteristics have a positive
effect on
consumers buying decision of green
product................................................ -23- 2.2.1.1 H1a: the
gender has a positive effect on green buying......... -23- 2.2.1.2 H1b: the
level of income or revenue is positively linked to
consumers green buying
behavior.............................................. -24- 2.2.1.3 H1c: the
level of education is positively linked to the consumption
of green
products........................................................................
-24-
2.2.1.4 H1d: employment status is positively linked to the
consumption
of green
product............................................................................
-24- 2.2.1.5 H1e: the legal status is positively linked to green purchasing
behavior..........................................................................................
-24-
2.2.2 H2: living condition has a positive effect on consumers
green buying
decision -24-

2.2.2.1 H2a: The place of living is positively linked to green
buying
behavior~~~~~~~~~~~~~~~~~~~~~~~~~~~~~~ -25-
2.2.2.2 H2b: The household size is positively linked to green
buying
behavior~~~~~~~~~~~~~~~~~~~~~~~~~~~~~~ -25-
2.2.3 H3: The store type is has a positive effect on green
consumer
behavior~~~~~~~~~~~~~~~~~~~~~~~~~~~~~~~~ -25-
2.2.4 H4: Good knowledge / high environmental knowledge lead to
the consumption of green products -25-
2.2.5 H5: The intention to buy green
product is positively linked the act of
purchasing green product~~~~~~~~~~~~~~~~~~~~~~. -25-
2.3 Research
design~~~~~~~~~~~~~~~~~~~~~~~~~~~~~~~~~.-27-
2.4 Data
gatherin~~~~~~~~~~~~~~~~~~~~~~~~~~~~~~~~~~. -28-
2.4.1 Conjoint analysis -28-
2.4.2 Questionnaire Design -28-
2.4.3 Questionnaire testing~~~~~~~~~~~~~~~~~~~~~~~~~~ -29-
2.4.5 Participants~~~~~~~~~~~~~~~~~~~~~~~~~~~~~~~ -29-
2.5 Measuring and scaling~~~~~~~~~~~~~~~~~~~~~~~~~~~~~
-29-
2.5.1 Sampling types -29-
2.5.2 Sampling size -30-
2.6 Data processing and analysis~~~~~~~~~~~~~~~~~~~~~~~~~
-31-
2.7 Constraints and
limitations~~~~~~~~~~~~~~~~~~~~~~~~~~~ -31-
2.7.1 Time, money and workforce~~~~~~~~~~~~~~~~~~~~~~ -31-
2.7.2 Sampling~~~~~~~~~~~~~~~~~~~~~~~~~~~~~~~~~ -32-
2.7.3 Online questionnaire~~~~~~~~~~~~~~~~~~~~~~~~~~. -32-
III. Results and Analysis~~~~~~~~~~~~~~~~~~~~~~~~~~~~~~~
-33-
3.1 Introduction~~~~~~~~~~~~~~~~~~~~~~~~~~~~~~~~~~~
-34-
3.2 Questionnaire findings~~~~~~~~~~~~~~~~~~~~~~~~~~~~~
-34-
3.2.1 Personal information~~~~~~~~~~~~~~~~~~~~~~~~~~ -34-
3.2.2 Environmental knowledge~~~~~~~~~~~~~~~~~~~~~~~ -36-
3.2.3 Green consumption~~~~~~~~~~~~~~~~~~~~~~~~~~ -39-
3.3 Hypotheses testing~~~~~~~~~~~~~~~~~~~~~~~~~~~~~~~.
-43-
3.3.1 Data cleaning and normality testing -46-

3.3.2 Regression analysis -44-
3.3.2.1 Theoretical review -44-
3.3.3 Hypothesis 1: socio-economical characteristics have a
positive effect on
consumers buying decision of green product -44-
3.3.3.1 H1a: the gender has a positive effect on green buying
-47-
3.3.3.2 H1b: the level of income or revenue is positively linked
to consumers green buying behavior -49-
3.3.3.3 H1c: the level of education
is positively linked to the
consumption of green
product...................................................... -51-
3.3.3.4 H1d: employment status is positively linked to the
consumption of green product -53-
3.3.3.5 H1e: the legal status is positively linked to green
purchasing
behavior -54-
3.3.4 Hypothesis 2: living condition has a positive effect on
consumers green buyingdecision -54- 3.3.4.1 H2a: The place of living is
positively link to green buying behavior -57- 3.3.4.2 H2b: The household size
is positively link to green buying
behavior -58-
3.3.5 H3: The store type is has a positive effect on green
consumer behavior -60-
3.3.6 H4: Good green knowledge lead to the consumption of
green
products -62-
3.3.7 H5: The intention to buy green is positively link to green
buying
behavior -64-
IV. Conclusions and recommendations~~~~~~~~~~~~~~~~~~~~~~
-67-
4.1 Introduction~~~~~~~~~~~~~~~~~~~~~~~~~~~~~~~~~~~
-68-
4.2 Findings' analysis and discussion -68-
4.2.1 Socio-economical factors, living condition and store
type............... -68-
4.2.2 Green knowledge and
intention............................................................ -72-
4.3 Conclusion -73-
4. 4 Recommendations for
businesses~~~~~~~~~~~~~~~~~~~~~~~ -75-

V. Limitations and suggestions for future
research............... -78-
5.1 Limitations -79-
5.1.1 Results limitation~~~~~~~~~~~~~~~~~~~~~~~~~~~~~~ -79-
5.1.2 Material Limitation~~~~~~~~~~~~~~~~~~~~~~~~~~~~ -80-
5.1.3 Initial against accomplished
objectives..................-80-
5.1.4 Unusual Results~~~~~~~~~~~~~~~~~~~~~~~~~~~~~~~ -80-
5.2 Suggestions for future
research~~~~~~~~~~~~~~~~~~~~~~~~. -81-
General Conclusions~~~~~~~~~~~~~~~~~~~~~~~~~~~~~~~~
-82-
References. -84-
Appendices. -91-
Questionnaire~~~~~~~~~~~~~~~~~~~~~~~~~~~
-91-
Compatible cartridges analysis~~~~~~~~~~~~~~~~~~~~~~~~~~
-96-

List of figures
Fig 2.1 Conceptual Model~~~~~~~~~~~~~~~~~~~~~~~~~~~~~~~ -26-
Fig 3.1 «If you don't know it well, what is ecology for
you?» -37-
Fig 3.2 «When buying green which criteria seem the most
important?» -40-
Fig 3.3 «Where do you usually buy green products?»
-40-
Fig 3.4 «What kind of products are you
buying?»................................................... -41-
Fig 3.5 «If you don't buy green,
why?».....................................................................
-41-
Fig Appendix 1 «How often are you buying cartridges?»
-96-
Fig Appendix 2 «How much are you spending for it?»
-97-
Fig Appendix 3 «By choosing cartridges, what are the most
important criteria?. -98-
Fig Appendix 4 «What is compatible cartridge
for you?» -98-

List of tables
Table 3.1 Personal information~~~~~~~~~~~~~~~~~~~~~~~~~~~~
-35-
Table 3.2 Green knowledge -36-
Table 3.3 Green Consumption~~~~~~~~~~~~~~~~~~~~~~~~~~~~ -38-
Table 3.4 Normality Testing~~~~~~~~~~~~~~~~~~~~~~~~~~~~~ -43-
Table 3.5 H1 Model Summary~~~~~~~~~~~~~~~~~~~~~~~~~~~~ -45-
Table 3.6 H1 ANOVA Table~~~~~~~~~~~~~~~~~~~~~~~~~~~~~~ -46-
Table 3.7 H1 Coefficients Table -47-
Table 3.8 H1a: Model Summary~~~~~~~~~~~~~~~~~~~~~~~~~~~. -48-
Table 3.9 H1a: ANOVA Table~~~~~~~~~~~~~~~~~~~~~~~~~~~~~ -48-
Table 3.10 H1a: Coefficients Table~~~~~~~~~~~~~~~~~~~~~~~~~~
-49-
Table 3.11 H1b: Model Summary -49-
Table 3.12 H1b: ANOVA Table~~~~~~~~~~~~~~~~~~~~~~~~~~~~ -50-
Table 3.13 H1b: Coefficients Table~~~~~~~~~~~~~~~~~~~~~~~~~~
-51-
Table 3.14 H1c: Model Summary~~~~~~~~~~~~~~~~~~~~~~~~~~ -51-
Table 3.15 H1c: ANOVA Table~~~~~~~~~~~~~~~~~~~~~~~~~~~~ -52- Table 3.16 H1c:
Coefficients Table~~~~~~~~~~~~~~~~~~~~~~~~~~ -52- Table 3.17 H1d: Model
Summary~~~~~~~~~~~~~~~~~~~~~~~~~~ -53-
Table 3.18 H1d: ANOVA Table~~~~~~~~~~~~~~~~~~~~~~~~~~~~. -54-
Table 3.19 H1d: Coefficients Table~~~~~~~~~~~~~~~~~~~~~~~~~~
-54-
Table 3.20 H1e: Model Summary~~~~~~~~~~~~~~~~~~~~~~~~~~ -55-
Table 3.21 H1e: ANOVA Table~~~~~~~~~~~~~~~~~~~~~~~~~~~~. -56-
Table 3.22 H1e: Coefficients Table~~~~~~~~~~~~~~~~~~~~~~~~~~
-56-
Table 3.23 H2a: Model Summary~~~~~~~~~~~~~~~~~~~~~~~~~~
-57-
Table 3.24 H2a: ANOVA Table~~~~~~~~~~~~~~~~~~~~~~~~~~~~. -57-

Table 3.25 H2a: Coefficients Table~~~~~~~~~~~~~~~~~~~~~~~~~~
-58-
Table 3.26 H2b: Model Summary -59-
Table 3.27 H2b: ANOVA Table~~~~~~~~~~~~~~~~~~~~~~~~~~~~ -59-
Table 3.28 H2b: Coefficients Table~~~~~~~~~~~~~~~~~~~~~~~~~~
-60-
Table 3.29 H3: Model Summary~~~~~~~~~~~~~~~~~~~~~~~~~~~ -60-
Table 3.30 H3: ANOVA Table~~~~~~~~~~~~~~~~~~~~~~~~~~~~~ -61-
Table 3.31 H3: Coefficients Table~~~~~~~~~~~~~~~~~~~~~~~~~~.
-61- Table 3.32 H4: Model Summary~~~~~~~~~~~~~~~~~~~~~~~~~~~ -62- Table 3.33
H4: ANOVA Table~~~~~~~~~~~~~~~~~~~~~~~~~~~~~ -62- Table 3.34 H4: Coefficients
Table~~~~~~~~~~~~~~~~~~~~~~~~~~ -63- Table 3.35 H5: Model
Summary~~~~~~~~~~~~~~~~~~~~~~~~~~~ -64- Table 3.36 H5: ANOVA
Table~~~~~~~~~~~~~~~~~~~~~~~~~~~~~. -64-
|
Table 3.37 H5: Coefficients Table~~~~~~~~~~~~~~~~~~~~~~~~~~
-65-
|
|
|
Table 3.38 Hypotheses Resume
|
-66-
|
|
Table Appendix 1
|
-99-
|

Introduction
This thesis is based on the topic of green marketing.
According to the business dictionary (2011), green marketing can be seen as the
«promotional activities aimed at taking advantage of the
changing consumer attitudes toward a brand.» Those
changes are more and more important as they are influenced by firm's new
policies and practices that are affecting the quality of the environment, and
reflect the level of its concern for the community. Green marketing is growing
quickly and nowadays, many consumers are willing to consume green products due
to an increasing environmental consciousness. But is it the only reason?
Determinants for green purchasing are various and that lead the researcher to
establish the main research question as: what are the determinants of green
consumption?
Many researches have been conducted in order to define the
determinant of green consumption. According to various researchers it appears
that the determinant of green consumption are link to cultural orientation,
value, belief or norm, psychological, economical or socio-demographic factors
(Cleveland et al., 2005; Stern, 2000; Tina Mainieri 1997).
After making a review of the theoretical background, the
purpose of this diploma study is to examine if the socio-demographics factors;
socio-economical variables (gender, income, level of education and employment
status) stores type and living condition; can be seen as determinants for the
consumption of green products.
In order to see if those factors could be seen as determinant
for the consumption of green product, the researcher has decided to conducted
survey in order to assess consumers' knowledge and attitude against green
products. Following, conclusions and recommendations were drawn in order to see
if those factors are finally determining the consumption of green product or
not.

Chapter I
Literature review

1.1 Environmental Concern
Environmental concern has various definitions, Gill et
al., (1986) have defined it as the «protective attitude towards the
environment». However, for some researchers, like Dunlap and Jones (2002),
environmental concern is seen as «an individual's awareness of
environmental problems and individual's attempts to solve either them or
willingness to contribute to such attempts.»
Over the last 20 past years we could see an increasing feeling
of environmental concern. In fact, in 1992 took place one of the first UNCED of
the United Nation in order to take decision upon development and the
environment. This UN conference also called Earth Summit was held in order to
deliver a message that: «nothing less than a transformation of our
attitudes and behavior would bring about the necessary changes» (UN 23 may
1997). Many others meeting followed this one like the biosafty protocol in 1999
and 2000; recently the summits in Copenhagen (2009) and in Cancun (2010).
This increasing feeling of environmental concern could be
explain because of major events that occurred in the last past years. The
global warming, the ozone depletion, the water and air pollution, the loss of
species are relevant examples of what happened in recent years (Timothy
McDaniels, Lawrence J. Axelrod, Paul Slovic, 1995).
Another main reason could be the over consumption of the
natural resources due to the human activities. (Paul M Brown, Linda D Cameron,
1996) Activities, production, consumption are, as a result, also responsible of
the degradation of the environment, in a more general way the human activities
are responsible of the transformation of the environment (Richard Wilk 2002).
In fact, according to various researches, 30 to 40% of the current
environmental deterioration is due to the consumption activities (Grunert,
1993). Moreover, some others reports tend to show that this trend is growing
(Grant, 2000).
All of these have transformed and degraded the environment,
therefore nowadays,
people awareness is rising. As a consequence the world
needs a change in human
behavior and a development of cleaner and more
efficient technologies. As a

consequence in recent years many changes and developments have
occurred in both companies and consumers behavior.
Therefore, it is since the 1970s that researchers, mostly in
the United States, began to study marketing in an environmental perspective
(Kassarjian, 1971; Kinnear and Taylor, 1973; Kangun, 1974, Kinnear et al.,
1974)
Over the past twenty years, we could clearly observe a strong
tendency to the differentiation of the approaches of the companies with the
"eco-friendly" term (Brandbury and Clair, 1999). In fact, a large proportion of
company began to recycle, reduce their carbon emissions, reduce their water
consumption, or simply offering reduced packaging (Larry West 2004). In fact,
companies and consumers are now feeling concerned about those problems and try
to make the situation being better. Nowadays there are an increasing number of
companies which are doing what we called green marketing. Green marketing was
defined as «the development and marketing of product designed in a manner
that is sensitive or responsive to environmental concern» (American
marketing association 2007). As a result, the offer for green products is now
booming in our everyday life, as we can now find green products in
supermarkets. (Jeff McIntire-Strasburg 2009)
As companies are now offering green products, consumers are
now changing their consumption behaviors. In fact, behavior and habits change
because they want to contribute to the protection and improvement of the
environment.
1.2 Determinants of green consumption
In this section the researcher is not going to develop a new
theoretical model with all those factors, but rather she wants to use the
existing literature in order to give an overview of «green buying
determinants».
Green buying or consumption has been defined by Tina Mainieri
(1997) as the «influence of environment concern on consumer behavior, it
is the awareness about environment impact of products, specific environment
belief of consumers, attitudes and demographic variables.» For others
authors it is more complicated, green consumption can refers to various things.
Firstly it can just refers to the act of «buying traded tea bags to
organic meat» (Andrew Gilg, Stewart Barr, Nicholas Ford,

2005); or this behavior can be kind of paradox based on buying
local in order to support local producers (Andrew Gilg, Stewart Barr, Nicholas
Ford, 2005) or purchasing organically farmed produce based on ecological
principles (B. Ilbery et al. 1999). In addition, according to the Korean
ministry of environment, green buying refers to «purchasing products which
are essential and environmentally-friendly». (Ministry of Environment;
2011) Therefore, green consumption definition's is discussed between
researchers as it is not existing one unique definition.
Environmentally-friendly products, literally, refers to
«earth-friendly or not harmful to the environment» (
Dictionary.com 21st Century Lexicon,
2003-2011). Generally it refers to a product that contributes to green living
and permits to prevent air, water or land pollution (Daniel Holzer
2006).
Nevertheless, saying that is because of environmental concern
that people are buying green products is too «restrictive»,
determinants can be far more complicated, that's why many studies have been
conducted upon this area of research.
Environmental concern is seen as the most obvious determinant.
However, researchers disagree on the way to explain this determinant. In fact,
for some of them environmental concern has to be seen as an attitude (Souad
H'Mida Ph.D, 2008). According to the author, consumers that have a strong
environmental concern thought that the deterioration of the environment
«represent serious problems facing the security of the world» whereas
for people with a lower environmental concern, they think that problems will
solve themselves. (Laroche et al., 2002, p.268) For others researchers,
environmental concern is seen as an action or behavior (Kangand James 2007).
According to them, it is the behavior which «aims at reducing human
ecological footprint».
Many researchers agree to say that determinants of the
consumption of green products could be due to cultural orientation like value,
belief or norm, psychological, economical or socio-demographic factors
(Cleveland et al., 2005; Stern, 2000). Multitude of factors could explain this
behavior, depending on consumer's behavior and involvement with the product
(Black et al, 1985;

Cleveland). Psychological, knowledge, attitudes, memory have also
an effect on eco friendly buying product (Ricky Y. K. Chan 2001)
Moreover four categories of determinants have been defined
which are the contextual factors, the attitudinal factors, the habits or
routine and the personal capabilities (Johan Jansson and Agneta Marell 2010).
According to Carmern Tanner and Sybill (2003), green consumer behavior could be
explained because of three major determinants. Firstly they described the
specific attitudes as a determinant. For them, it refers to the judgment about
a product or a behavior rather than the measures of the environment concern.
(Hines et al 1986/1987). The second one is the perceived effectiveness. It
refers to the fact that consumers have to be sure that their behavior will have
impact on the environment or will be effective in the environment fighting.
Concerning this determinant, many researchers agree to say that most of the
time a high level of perceived effectiveness is link to a high level of green
consumerism (Kinnear et al 1974; Tucker 1980). And the last one is the personal
norm. It refers to the feeling of moral obligation. According to the authors
Carmern Tanner and Sybille Kast (2003), people tend to consume green product in
order to have a good «conscience», because it is synonymous of
good.
The cultural background of the consumer can also be seen as a
determinant of green consumption. In fact, culture is seen as the «most
fundamental determinant of a person's wants and behavior» (Management-Hub
2010). Cultural orientation is a powerful determinant, some researcher agree on
the fact that it could be more important than the age or the gender for
example, in situation «where economic growth and environmental
exploitation are proven to be important». (Souad H'Mida Ph.D, 2008)
Indeed, it appears that according to the country, people are not «
prepared » willing to buy green products, due to a lack of green
consciousness (Souad H'Mida, 2008) it is true for the American for example,
where there is not a strong environmental consciousness. (Krause D. 1993)
Green knowledge has also been defined as a determinant for
green consumption. Environmental knowledge refers to «general knowledge of
facts, concepts and relationship concerning the natural environment and its
major ecosystem«(Fryxell and lo 2003 p 45). In other words it is what
people know about the environment. About that, Shahn and Holzer (1990) have
described two types of environmental

knowledge abstract and concert. The first one refers to the
concern about the environment issues, like the problem, causes, solutions etc.
The second one, concrete, refers to behavioral knowledge that can be utilized
by consumer. Hines et al (1987) added that the abstract knowledge is the most
important when there is a difference between people that are consuming or not
green product, the main explanation is knowledge.
Lastly, the attitude which is an important predictor behavior
(kitchen and Reiling 2000). Neil Lessem and Ryan Vaughn (2010) have explained
that there are no additional benefits of buying green products, and most of the
time those kinds of products (green) are much more expensive. So they asked
themselves the following question: Why do consumers buy green product? They
found that in our society «green» mostly means «good». For
them there is another type of motivation that is driving the consumption of the
green products. More precisely, if a green product is easily and highly
observable, consumers would buy this product in order to show that they are
green consumers or a good person. For them the key point in green buying is the
importance that the consumer is attaching to the environment.
Another determinant has been described, it is the price. Price
could also be seen as a determinant for many researchers. In fact, price,
quality and convenience can be competitive advantage in buying decision of
green product (J. Ottman 1994). In addition, Catherine Roche et al. (2009) said
that the price is not an obstacle of the buying decision of green product. Link
to this idea, according to Michaelyn Erickson (2008) the «sales of green
products in Europe are predicted to double by 2015» according to perceived
benefits of those products, consumers are not paying attention to the price.
1.4 Conclusion
We could observe three major determinants that are driving the
consumption of green products (Andrew Gilg 2005). As it was explained
previously, the first are the environmental concern and the values. The second
one is the psychological factors which is including various determinants like
the perceived effectiveness, social responsibility (Tucker 1980) and the effect
of the price, the last which is the less studied is the socio-demographics
factors.

However, most of the researches agree on one point which is
that the identification of consumer motivation underlying pro-environmental
behavior is still difficult to predict. It is also difficult because, the act
of sharing information about environmental problems can convince even those who
are not currently in favor of green purchasing. (Afzaal Ali 2011)
That could explain the number of researches that were
conducted on this topic. The Environmental concerned feeling increase and
nowadays consumer are inclined to take some responsibility and to reduce the
environment damages through recycling and purchasing responsibly.
1.5 Barrier of green consumption
Despites all of these studies about the determinants of buying
green products, less things have been done on the barriers of green products.
When studying a topic it is also important to have both point of view in our
case to explain the determinant of the green purchasing and the barrier to this
kind of consumption.
First of all, it is logical to assume that a high
environmental concern could lead to the consumption of green products. However,
it is far more complicated as András Takács-Sánta (2007)
has explained. For the author, people can be blocked because of «the
mental appraisal processes concerning environmental problems». In other
words, this means that consumers are not going to evaluate the environmental
problems at the same level of importance and, as a result, are not going to
consume green products as they don't feel concerned with environmental
problem.
In addition, according to Catherine Roche (2009) many
companies are reluctant to commercialize and advertise on their green products.
In fact, companies are scared of what is commonly called «green
washing». Green washing is «the practice of making an unsubstantiated
or misleading claim about the environmental benefits of a product, service,
technology or company practices» (Search CRM 2007). Indeed, in recent
years we could observe increasing consumer skepticism about the products
promoted as green and respectful of the environment (Tiffany Hsu 2011). Indeed,
according to the author «many companies are making the products out to be
greener than they really are». Because of that, consumers are less
trusting companies and not buying green product. Additionally, consumers can
feel

confused because of green washed, fair-trade, ethical, organic
etc finally: they don't know which product is really a good and a green one?
(Shrum et al 1995)
Confusion is also an important barrier to the consumption of
green products. Indeed, Cheryl D. Hicks (2011) has conducted a study about
consumers green behavior's which revealed that «38% of the respondents
were confused by companies' claims that their products were green and more than
58% wanted to know what specifically justified a green label». To resume,
consumers feel confused because of the numerous and different green campaigns
that are now emerging and the different label they want to know to what it
refer.
In addition, according to the BBMG Conscious Consumer Report
(2007), consumers could feel reluctant to buy green products because they feel
like it is difficult to see the personal benefits if they are consuming those
products. Consumers may have some difficulties to identify the environmentally
relevant aspect of the product; they need to be more visible, need to be seen
by the consumer. As Afzaal Ali (2011) also said, for consumers it may be
difficult to assess environmental friendliness of a product and as a
consequence they are not willing to buy those products. Additionally, the
quotation «One person can't make the difference» (The good human
2009), reveals that consumers tend to think that consuming green products is
useless and is not going to solve environmental problems.
Most of the time, consumers tend not to consume green product
because of the capital cost. Due to the higher price, consumer can feel
reluctant of consuming those products. (Lars Perner 1998)
However, there is a paradox on the price. Indeed, according to the
BBMG Conscious Consumer Report (2007) «50% of the respondents are willing
to pay more for green products» but for «66% of them the price is the
first factor in buying decision», as a consequence consumer are willing to
pay a premium price for green product but the majority of them are first
looking at the price before buying a product.
According to various researchers like Biwas et al (2000), one
main reason of the non-consumption of green product is the perception of
inferior product quality. In fact, most of the time green products are made of
recycle product and; in the general belief; it refers to a lower quality
product. Consumers are uncertain about

the quality: they thought that those products are not as good as
conventional product.
According to the BBMG Conscious Consumer Report (2007),
another barrier can be found; it is companies' green responsibility barrier. In
fact most of the consumers are not going to buy green products from companies
they disagree with: companies have social responsibility and providing green
products is one. (Lois A. Mohr, Webb J. D., Harris, K. E., 2001) As a result:
even if a company is selling green products, consumers may not consume them due
to the social responsibility of this company. The BBMG Conscious Consumer
Report (2007) also found that if people have the choice between various
products they are going to buy from a company that «manufactures energy
efficient appliances and products (90%), promotes consumer health and safety
benefits (88%), supports fair labor and trade practices (87%), commits to
environmentally-friendly practices (87%)». It revealed that consumers are
looking for companies' corporate responsibilities and product itself before
purchasing it.
1.6 Conclusion
As a conclusion, the main reasons of the non-consumption of
green product are mostly link to the perception of those products by the
consumer: the perception of a higher price, the perception of the effectiveness
of those products, the lower quality perception etc.
Like the determinants of green consumption, the barriers are
various and many researchers agree to say that it is a wide topic still
difficult to explain, as it depends of consumers' personal belief, culture
etc.

Chapter II
Methodology

2.1 Research overview
2.1.1 Definition of the studied variables
According to the previous literature review, defining the
determinants of green consumption is a really wide topic, with many
possibilities; it clearly appears to the researcher that the area of study as
to be narrowed down, it would be impossible to study all the determinants, the
research had to make choices.
The researcher has decided to study determinants that were not
really studied. Therefore, socio-demographic factors are less known as few
studies have been conducted upon this area of research. Scio-demographics
factors can refers «to the age, sex, education level, income level,
marital status, occupation, religion, birth rate, death rate, average size of a
family, average age at marriage» (Business Dictionary). Therefore, the
researcher found interesting to focus on the sociodemographics factors in order
to see if it is possible to draw a «profile type» of green consumers,
if they have common characteristics. Additionally, the researcher has decided
to look at the living conditions and the different types of stores, which are
selling green products, in order to see if consumers tend to pay attention at
where they are buying their products or not.
2.1.2 Research objectives
This research was conducted in order to determine if the
socio-demographics factors described above are influencing consumer green
purchase behavior.
This study title is: The determinants of the green
consumption: a study of sociodemographics factors as determinants. As
a consequence, our main research question for this study is the following:
« What are the determinants that lead to the consumption
of green products? » Firstly the researcher has conducted a literature
review in order to get an overview of the different determinants that lead to
the consumption of green products. After that, the researcher has decided to
study the determinants which were not studied. In fact, many researches were
conducted on this topic and the researcher decided to study determinants which
were less studied. That's why the socio-demographics factors were chosen. As it
was explained above, the research will be based on four

determinants in order to analyze the reasons of the
consumption of green products. Those determinants were studied in order to see
if they are link or facilitate (or not) the consumption of green products.
Determinants that are going to be studied are the following: socio-demographic
factors.
· Socio-economical characteristics: gender, level of
income, level of education, employment and status
· Living condition: household and place of living
· Stores types
· Level of Environmental concern
2.2 Hypotheses
This study was drawn in order to establish if the
socio-demographic variables can be seen as determinants of the consumption of
green products or not, if there is a link between those variables and the green
purchasing behavior.
As a consequence the researcher has established various
hypotheses in order to answer the main research question.
According to the studied variables, the first hypothesis refers
to the fact that the socio-economical characteristics are linked to the
consumption of green products.
2.2.1 H1: socio-economical characteristics have a positive
effect on
consumers buying decision of green product
However, there are several sub-determinants in the
socio-economical characteristics, that's why the following sub-hypotheses were
conducted. Those hypotheses were established because of the literature review
and the personal interpretation of the researcher.
2.2.1.1 H1a: the gender has a positive effect on green
buying.
For this hypothesis the researcher suggests that women tend to
consume more green products than men, therefore the researcher wants to see if
this hypothesis can be validated or not.

2.2.1.2 H1b: the level of income or revenue is positively
linked
to consumers green buying behavior.
For this hypothesis, the researcher suggests that people with
high level of income tend to consume more green products than people with a
lower level of income, as green products tend to be perceived as more
expensive.
2.2.1.3 H1c: the level of education is positively linked to
the
consumption of green products.
For this hypothesis it is almost the same reflection as the
previous one. The research suggests that people with a higher level of
education are willing to consume more than the other.
2.2.1.4 H1d: employment status is positively linked to
the
consumption of green product.
For this hypothesis, the researcher assumes that people with a
full time job are willing to consume more green products than people with a
part time job or unemployed.
2.2.1.5 H1e: the legal status is positively linked to green
purchasing behavior.
For this hypothesis, the researcher assumes that the
consumption of green products is link to the legal status of consumers. The
researcher suggests that people who are married tend to consume more green
products than people living alone.
2.2.2 H2: living condition has a positive effect on
consumers green buying decision
The second developed hypothesis refers to the living
condition. We wanted to see if the living condition can have an effect or being
linked to the consumption of green product.

2.2.2.1 H2a: The place of living is positively linked to
green
buying behavior.
Concerning, the place of living, the researcher suggests that
people living outside of city center may consume more green products that
people living in city.
2.2.2.2 H2b: The household size is positively linked to green
buying behavior.
With this hypothesis, the researcher wanted to see if the
household size is affecting the consumption of green products, if according to
the size the consumption is more important or not.
2.2.3 H3: The store type is has a positive effect on green
consumer behavior
This hypothesis refers to the type of store. In fact, the
researcher wanted to see if consumers are willing to buy green products
according to the store, if the type of store is affecting the final decision of
the consumer.
With this hypothesis the researcher wanted to see if a certain
type of store is facilitating the consumption of green products.
2.2.4 H4: Good knowledge / high environmental knowledge
lead to the consumption of green products.
The fourth hypothesis formulated refers to what the researcher
has called «green knowledge». In fact, the researcher wanted to see
if people, who are consuming green products, are more aware of what ecology is,
in other words if there is a link between green knowledge and the consumption
of green product.
2.2.5 H5: The intention to buy green product is positively
linked
the act of purchasing green product
The last formulated hypothesis refers to the link between the
intention of buying green products and the act of buying. In fact, sometime
people are willing to buy a product but are finally not buying it; we wanted to
see if there is a link between those behaviors.

? Fig 2.1: Conceptual model
Socio-economical characterictics
- Gender
- Education level
- Income level - Legal status
Living condition
- Place of living
- Household size
Intention to
buy green
Purchasing
green
Environmental concern
Stores type
In order to resume the hypotheses, a conceptual model was
drawn. This model allow the reader to have an overview of the main determinants
that are going to be studied, to understand the link between all of these
determinants and the intention of buying green and the act of purchasing.
In this model, the determinants have to be seen as independent
variables and the act of purchase is a dependent variable. The researcher
assumes that the independent variables; stores type, living condition,
environmental concern and socio-economical characteristics; are directly
influencing the intention to buy green products.
This model was drawn according to the formulated hypothesis and
permits the reader to have a better understanding of the purpose of this
study.

2.3 Research design
Research design can be defined as «the framework for
conducting a marketing project. It permits to specifies the details of the
procedures necessary for obtaining the information needed to structure or solve
marketing research problems» (Malhotra and Birks, Marketing Research an
applied approach, p64)
For this study, we used two different kind of research design:
exploratory and conclusive quantitative design.
In fact, as Malhorta and Birks (2007) have explained it is
possible to combine two kind of research design. Indeed, at the beginning of
the analysis, the researcher had to use an exploratory research as an initial
step of research. This design was used in order to get more background about
the topic; as the topic was not well understand by the researcher; she needed
to conduct this type of research in order to get accurate information.
Exploratory research designed was also used in order to develop our research
question and our different hypothesis. The present study is exploratory since
it would gather information in order to see if the independent variables are
influencing the green purchase behavior. The researcher has used the existing
literature in order to come up with preliminary ideas on the research
problem.
Following the exploratory research, in order to test the
formulated hypothesis, the researcher has used a conclusive descriptive
research design. Creswell (1994) said about the descriptive research design
that the emphasis is on describing a phenomena rather than on judging or
interpreting. The final goal of this type of research design is to verify the
formulated hypotheses that refer to the initial situation in order to validate
or reject it. That's why this kind of design was used in the present study: in
order to test the formulated hypotheses. For the present study, descriptive
approach was also chosen due to its various advantages. In fact, descriptive
design is quick and practical in terms of the financial aspect. In addition,
this design permits a flexible approach, as a consequence, when important new
issues and questions appears during the duration of the study, further
investigation can be conducted.

2.4 Data gathering
2.4.1 Conjoint analysis
In order to conduct this study the researcher first thought
that it could be interesting to use a tradeoff or conjoint analysis in order to
gather information. In fact, a conjoint analysis permits to define the consumer
preferences according to additive utility model, specific to each interviewee
(Gilbert Saporta 2009). In other words, this would allow the researcher to
determine what consumer are looking for when they are looking for green
products and what do they prefer in those products.
However, the present hypotheses are mostly based on the
consumer himself; household, situation, level of income and education, store
types etc; as a consequence this kind of instrument wouldn't be very effective
and relevant in this case. Indeed, conjoint analysis is more relevant when
studying consumer attitude toward product's attributes rather than the profile
of the consumer, which is the case here.
That's why the researcher has finally decided to conduct a survey
which would allow asking accurate questions according to the hypotheses.
2.4.2 Questionnaire design
The survey questionnaire was used as the main data-gathering
instrument for this study. The survey was composed of four major sections. The
first section concerned the personal information of the respondent; as the
majority of the hypotheses are based on personal information of the respondent
this section was composed of ten questions about the respondent gender,
situation, place of living, household, income, etc.
The second part of the questionnaire was set up in order to
assess the respondent «knowledge» on ecology and environmental
concern in general.
The third part of the questionnaire was more oriented on the
consumption of green product itself. This section would allow the reader to
know how people are consuming, or not, and why; how do they feel with green
products, what are their intentions?

The last part of the questionnaire is a little bit apart. This
section was established in order to get insight about the consumption of
compatible cartridge in order to let the company; where the internship was
made: Pelikan France SAS; known about the consumption of those products, the
determinants, feeling of consumers etc.
2.4.3 Questionnaire testing
In order to determine the validity and the feasibility of the
questionnaire, a pre-test was held by 15 respondents. This pre-test has
permitted to add the question «I have consider or already bought green
product». Indeed, the first version of the questionnaire did not contain a
clear question about the consumption of green products; therefore the
researcher could clearly know if people have already consumed green product or
not.
2.4.4 Participants
The questionnaire was held by 150 respondents. The respondents
were chosen randomly by the researcher. Participants were treated anonymously;
the researcher was trying to get heterogeneous answers from different people in
term of gender, income, occupation etc. in order to get various backgrounds.
2.5 Measuring and scaling
2.5.1 Sampling types
After defining how the data are going to be collected the next
consideration is how to select a sample of the population of interest that is
truly representative. In fact, it would be very costly and time-consuming to
collect data from the entire population of a market. The population will be
sampled by using a sampling frame. A sample is defined as «a subset of a
frame where elements are selected based on a randomized process with a known
probability of selection» (OECD Glossary of statistical terms, 2001).
There are various types of sampling frame.
At the beginning, for the present study, the researcher thought
of two different types of sampling: quota sampling and convenience sampling.

Both of these sampling are non probability; Castillo, Joan
Joseph (2009) defines non-probability sampling as «a sampling technique
where the samples are collected in a way that does not give all the individuals
the same chance of being selected». As a consequence it is true to assume
that probability sampling is often more representative; however it is also more
complicated to set up. Indeed, the researcher was facing many limitations like
time, workforce and money; as a result it is almost impossible to randomly
sample the whole population. For the present study, the researcher decided to
use a non probability sample based on the accessibility of the samples. As it
was said before, the researcher thought of two different sampling frames: quota
and convenience sampling.
Quota sampling permitted to obtain representative data of the
overall population by divided it by the most important variables. This is quick
and easy to set up. However, this type of sampling as it is not made randomly;
the risk of bias is rising. Unlike quota sampling, convenience sampling permits
to gather quickly a large amount of information and it is readily available.
However, the risk of no response is important and the researcher has to make
sure that all the respondents have equal chance to be interviewed.
For this study, convenience sampling was finally chosen. In
fact, convenience sampling would allow an easier and quicker establishment;
whereas quota is more time consuming as the researcher will need more knowledge
about the population for the stratification.
2.5.2 Sampling size
After defining the sampling type, it is important to decide of
the sampling size. The most obvious reason is that the biggest the sample is
the better is. In fact, larger sample tend to be more similar to the population
and, as a consequence, permits to get more representative information.
However, large sample are costly and more time-consuming than
smaller sample. As a convenience sampling was used for this study, we need a
relatively large sample according to time and a money constraint, the research
has tried to get the larger sample as possible.

2.6 Data processing and analysis
The questionnaire was an online one; therefore it was easier
for the researcher as the distribution of the invitation is very rapid (email
with hyperlink), the data could be downloaded and imported to SPSS and it is a
low cost method of gathering information.
After gathering all the completed questionnaires from the
respondents, the total responses for each item were obtained and tabulated.
This would allow the researcher to get various data, which would be analyzed in
order to validate or not the hypothesis.
In order to analyse the relation between the independent and
the dependent variables, the researcher tabulated the data in SPSS software in
order to do a linear regression analysis.
Regression is a statistical test designed to predict a
dependent variable from one or more independent variables, this would allow the
researcher to test the different hypotheses according to the different
variables. (Alan O. Sykes 1986) Each hypothesis was test with linear regression
analysis and the obtained results were described and explained in results
part.
2.7 Constraints and limitations
2.7.1 Time, money and workforce
As it was briefly explained in the previous section, the most
important constraints were time and the cost. As this study was conducted
during a limited period of time, the researcher couldn't gather as much
information as she wanted for this research; the study was conducted with tools
and methods that were feasible during this period.
Due to the different constraints, the methodology is certainly
not the most accurate according to the topic but the researcher has tried to
overcome them by using a methodology which would allow getting the most
representative information in a limited period of time.
For this study, the researcher opted to use this research method
considering the objective to obtain first hand data from the respondents.

2.7.2 Sampling
As the researcher used a non probability sampling in order to
gather information, a proportion of the population was not sampled. As a
result, the sampled used in this research may not represent the entire
population accurately.
2.7.3 Online questionnaire
In addition, as the researcher has decided to do an online
questionnaire, there were various disadvantages, mostly technology bias. In
fact, firstly the potential respondents must have an email address or internet
access and know how to use it in order to answer the questionnaire. Secondly
there can be an age / gender bias due to varying experience with internet.
Lastly, with online questionnaire we may not include non-internet users.
Therefore, the results of this research can't be generalized
to the entire population. As a consequence, the researcher wants this research
to be seen more like a guidance / overview for the reader, in order to give
information about the determinants and those variables.

Chapter III
Results and analysis

3.1 Introduction
In this part will be presented and analyzed the results of the
survey conducted by the researcher. The results will be organized in two
parts.
Firstly, the researcher will show the general results of the
Survey. This first part will permit to have an overview of the respondents, of
their level of environmental concern and their green purchasing behaviour.
The second part will permit the researcher to test the hypotheses
related to the original problem.
This questionnaire was held by 150 respondents, chosen
randomly and anonymously by the researcher. The questionnaire was composed of 4
sections with a total of 40 questions. The analysis was made section by
section.
In order to have the most accurate results, the researcher has
decided not to treat the answers that seem not relevant for the initial
research question; therefore the results of the fourth section compatible
cartridge are available in the appendices as they are not directly related to
the original problem.
3.2 . Questionnaire findings
3.2.1 Section 1 Personal information
Around one half 54.73% of the 150 respondents were female,
this is not surprisingly as it tend to show that shopping of the household is
still done more by women than by men and, 34.67% were single. The median age
and personal income were 18 - 25 years (36%) and inferior to 1 500€ for
62% respectively. Most of the interviewees do not have children for 56.08% and
were living in city center 52%. Concerning the socio-professional group, most
of the respondents were student for 30.67% and manager for 18%.
The majority of the respondents were either master degree for
(and higher) 54.73% and college degree for 30.41%. More than one half of the
respondents have a full time activity for 57.72%. The household size is shared
almost equally: 53.02% of the respondents are living in household of one to
three and 46.31% in a household of four to seven.
All the data are grouped in the table 3.1 available on the next
page 35.

|
Question
|
|
Frequency
|
Percentage
|
|
Gender
|
Male
|
67
|
45,27%
|
|
Female
|
81
|
54,73%
|
|
Personal situation
|
Married
|
48
|
32%
|
|
Divorced
|
15
|
10%
|
|
Single
|
52
|
34,67%
|
|
Other
|
35
|
23,33%
|
|
Children
|
Yes
|
65
|
43,92%
|
|
No
|
83
|
56,08%
|
|
Age
|
18-25
|
54
|
36,00%
|
|
26-35
|
34
|
22,67%
|
|
36-45
|
28
|
18,67%
|
|
46-50
|
25
|
16,67%
|
|
50+
|
9
|
6,00%
|
|
Place of living
|
City Center
|
78
|
52%
|
|
Country
|
31
|
20,67%
|
|
Suburbs
|
41
|
27,33%
|
|
Level of income
|
> 1500
|
62
|
41,61%
|
|
1500 - 2000
|
25
|
16,78%
|
|
2000 - 2500
|
25
|
16,78%
|
|
2500 - 3000
|
22
|
14,77%
|
|
3000 - 4000
|
11
|
7,38%
|
|
< 4000
|
4
|
2,68%
|
|
Level of education
|
High school
|
5
|
3,38%
|
|
Some College
|
17
|
11,49%
|
|
College degree (AS or BS)
|
45
|
30,41%
|
|
Master degree and higher
|
81
|
54,73%
|
|
Socio-professional group
|
office employee
|
18
|
12,00%
|
|
worker in industry
|
6
|
4,00%
|
|
Manager
|
27
|
18,00%
|
|
company owner
|
9
|
6,00%
|
|
student
|
46
|
30,67%
|
|
corporate executive
|
7
|
4,67%
|
|
self-employed
|
16
|
10,67%
|
|
other
|
21
|
14,00%
|
|
Employment status
|
Full time
|
86
|
57,72%
|
|
Part time
|
26
|
17,45%
|
|
Unemployed
|
24
|
16,11%
|
|
Other
|
13
|
8,72%
|
|
Household size
|
1 - 3
|
79
|
53,02%
|
|
4 - 7
7+
|
69
1
|
46,31%
0.67%
|
3.2.2 Section 2 Environmental knowledge
Table 3.2 Green knowledge Questions /
rating
How would you rate your knowledge on the ecology?*
«I feel concern with environmental problem»**
"Today seriousness of environmental problem is exaggerated"
|
1
|
2
|
3
|
4
|
5
|
Total
|
|
4,08%
|
21,50%
|
31,50%
|
35,60%
|
7,40%
|
100%
|
|
0,70%
|
15,50%
|
27%
|
35,10%
|
21,60%
|
100%
|
|
28,6%
|
31,3%
|
30,6%
|
8,9%
|
0,7%
|
100%
|
* For this question the rating 1 to 5 means: one almost nothing
is known about the ecology and five the person is an «expert» on this
topic.
** For all the following question the rating means: one strongly
disagree and five strongly agree with the sentence.
In this second section, the most important result is that the
majority of the respondents have a relatively good knowledge on the
«ecology» topic as respectively 35.6% and 31.5% rate their knowledge
four and three.
Link to those results, we can observe that the majority of the
respondents feel concerned with the environmental problems. Indeed, 21.6% are
strongly concerned with environmental problem
Therefore, only few respondents don't feel concerned at all
with environmental problems as only 0.7% strongly disagrees with this
affirmation. In addition, for most of the respondents environmental problems
are not exaggerated as only 0.7% strongly agree with it.
As a result, it appears that respondents seem to be aware of
the environment problems; however some of them have only little knowledge about
the ecology 21.5% or no knowledge at all 4.08%. Nevertheless this doesn't mean
that those persons are not concerned of environmental problems because only
0.7% are not concerned at all and 15.5% are less concerned.
The following question would allow the researcher to see what
ecology is for those who don't have strong knowledge upon this topic.

Fig 3.1: «If you don't know it well, what is ecology
for you?»
57%
32%
7%
3%
0%
1%
natural product healthy product vegetarian
diet
without pesticide
respectful of the environment
This graph allows the reader to see what ecology means for
those who don't have a clear definition of it. It clearly appears that for more
than the half of the respondents, 57%, ecological products mean respectful of
the environment; and for more than 32% it mean natural product.
Even if those respondents seem to not have strong knowledge on
this topic it is clear that they already have an idea of what it is as they
almost all answers they same answer, for only few of them ecological products
mean healthy product (7%), without pesticide for only 3% and diet products for
only 1%.

3.2.3 Section 3 Green consumption
Table 3.3 Green Consumption
Questions / rating
I'm aware of any products which are designed with environmental
issues in mind
I consider the effect on environment as a consumer before
purchasing
I think that buying green help fighting against environmental
problem
I think that companies develop sustainable product lines
primarily to attract new customers
I prefer eating wealthy even if it's more expensive
I will consider buying products because they are less
polluting
I plan to switch to a green version of a product
I will consider switching to other brands for ecological
reasons
I have already consider or bought green product
|
1
|
2
|
3
|
4
|
5
|
Total
|
|
3,40%
|
25,90%
|
32,00%
|
30,61%
|
8,20%
|
100%
|
|
15,70%
|
26,50%
|
39,50%
|
13%
|
5,40%
|
100%
|
|
6%
|
19,50%
|
26,20%
|
38,30%
|
10,10%
|
100%
|
|
8,10%
|
23,70%
|
23%
|
25%
|
20,30%
|
100%
|
|
4%
|
6,10%
|
23,70%
|
35,10%
|
31,10%
|
100%
|
|
5,50%
|
20,60%
|
28,10%
|
37%
|
9%
|
100%
|
|
10,10%
|
19%
|
32,40%
|
30,40%
|
8,10%
|
100%
|
|
9,50%
|
17,70%
|
28,60%
|
33,30%
|
10,90%
|
100%
|
|
8,10%
|
14,20%
|
13,50%
|
27,03%
|
37,16%
|
100%
|
In this board are summarized the answers of the question about
the consumption of green product. This was supposed to give an overview of the
feelings of the respondents upon those kinds of products.
With the collected data, the first observation that can be
made is that generally respondents are aware of products which are
«eco-friendly» as 30.6% strongly agree with it and, only 3.4% are not
aware at all.
In addition, most of the respondents don't consider the effect
on the environment before purchasing: only 5.4% are paying attention when 15.7%
don't. Therefore, there is a paradox because in the following question, the
majority of the interviewees think that buying green can help in the fight
against environmental problems, for 38.3% of them; so it appears that
respondents don't pay attention before purchasing but think that it could help
fighting environmental problems.

Moreover, link to the findings in the literature review; it
appears that respondents are septic against those products, as 20.3% strongly
agree with the fact that companies develop green products only to attract new
consumers, 25% agree and 23% neither agree or disagree. Nevertheless the
results are heterogeneous as 23.7% think that companies do not develop those
products in order to attract new customers.
It also clearly appears that interviewees prefer to eat
wealthy and better products even if it means spending more for it, 31.10%
strongly agree with it.
For the following question the answers are more contrasted. In
fact, it appears that globally the respondents are considered buying less
polluting products for 37%, switching to other brands for ecological reason for
33.3% of them and ready to change for a green version of the product for
30.40%. Nevertheless, despites all those results it also appears that even if
the majority of the interviewees are able to change their habits, a significant
amount, 19%, of them are not willing to switch to green products, 20.6% are not
willing to buy product that are less polluting. This is not really surprisingly
as many of the respondents still feel septic against those products and are not
willing to buy them.
The last question permits to know the proportion of
respondents which have already consider or consume green products. The result
is really significant as 37.16% of them have already consumed or bought green
products. Only 8.10% of the interviewees have never consider or bought those
kind of products.
The next three questions have permitted the researcher to get
insight about the habits of green consumers.

Fig 3.2 «When buying green which criteria seem the
most important?»
3% 17%
20%
29%
31%
the health
the environment protection
the quality
the efficiency
the natural aspect
This question allows the researcher to see what people are
looking for when they are buying green products. For this question, the
respondents had the choice between five criteria. It clearly appears that when
people are buying green products they are first looking for the protection of
their health (31%) the environment protection (29%) and finally the quality of
the product (20%).
They seem to pay less attention to the efficiency of the product
(3%).
Fig 3.3 «Where do you usually buy green
products?»
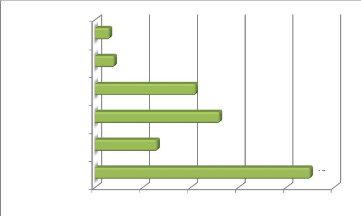
0 10 20 30 40 50
internet
health food store
Farmer's market
organic stores
smaller retailers
Supermarkets
13
3
4
21
26
45

After getting information about what people are looking for
when they are buying green, the researcher wanted to know where they are buying
green products, this would be useful in order to test the hypothesis about the
stores types.
With those results we can see that the majority of the
interviewees are buying green products in supermarkets, organic stores or
farmer's market.
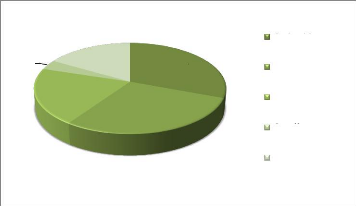
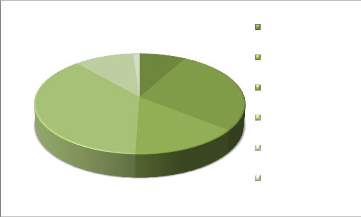
Fig 3.4 «What kind of products are you
buying?»
20%
20%
6%
54%
Food
beauty
cleaning products baby products
With this question, the researcher could get insight about the
type consumed products. It clearly appear that respondents are generally
consuming food products, for 54% of them.
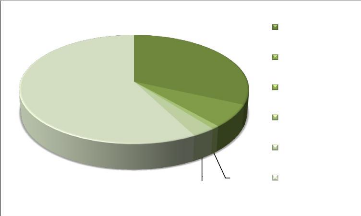
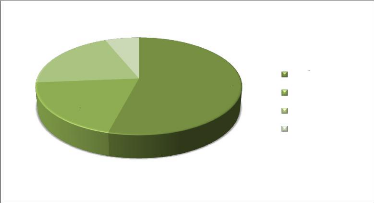
Fig 3.5 «If you don't buy green,
why?»
38%
1%
10%
8%
15%
28%
reduced performance don't trust it
not aware of those products
too expensive low quality
other

For this question, the researcher wanted to know why people
are not consuming green products. We could clearly observe that for the
majority, 38%, of the respondent they're not buying green products due to the
price, as those products are perceived as more expensive. The second most
important reason is again link to this feeling of scepticism, as 28% of the
respondents don't trust green products.
Conclusion
This analysis was essential in order to resume the results of
the questionnaire and to prepare the hypotheses testing. This would allow the
reader to get an overview of the respondents' environmental knowledge, green
purchase behaviour and their profiles; before entering in the details with the
hypotheses.
In the second part, all the different hypotheses were test each
by one in order to see if it could be validated or not, with the actual
sample.
3.3 Hypotheses Testing
3.3.1 Data cleaning and normality testing
The data were already gathered in an excel file and pasted on
SPSS.
Firstly, the researcher has cleaned all errors and mistakes in
the questionnaire. Some responses were out of range, logically inconsistent or
had extreme values. This kind of data is not admissible in the analysis.
Moreover, some responses were missing, ambiguous or not properly recorded.
After cleaning the data, a normality test was conducted in order
to see if the variables are well distributed or not.

Table 3.4 Normality Testing
Tests de normalité*
|
Kolmogorov-Smirnova
|
Shapiro-Wilk
|
|
Statistique
|
ddl
|
Signification
|
Statistique
|
ddl
|
Signification
|
|
knowledge_
|
,235
|
150
|
,000
|
,861
|
150
|
,000
|
|
intention
|
,120
|
150
|
,000
|
,969
|
150
|
,002
|
|
living
|
,208
|
150
|
,000
|
,845
|
150
|
,000
|
|
socio
|
,126
|
150
|
,000
|
,967
|
150
|
,001
|
|
green_consump
|
,177
|
150
|
,000
|
,924
|
150
|
,000
|
a. Correction de signification de Lilliefors
*Board explanation: Normality tests to see the
results for Kolmogorov-Smirnova and Shapiro-Wilk in term of
statistic and signification.
Normality testing: The normality testing is used in
order to see if each variable are well distributed. A normal distribution is a
theoretical frequency distribution that is bell-shaped and
symmetrical, with tails extending indefinitely either side of the
centre. The mean, median and mode coincide at the centre. (Hun Myoung Park,
Ph.D. 2008)
For this study, the data don't seem to follow a normal
distribution as the significations for each is lower than 0,005. However, most
of the time, data appear to not follow a normal distribution and, as this
doesn't have a serious impact of the rest of the analysis, the researcher has
decided to not transform the data.
3.3.2 Regression analysis
After gathering those different results, simple regression was
established in order to test the formulated hypotheses. In order to test those
hypotheses, as it was explained in the methodology part, the researched has mad
simple linear regression in order to see if the independent variable permitted
to explain the dependent variable.

3.3.2.1 Theoretical review
Definition: Simple linear regression permits to measure
the linear relationship between two variables, as the correlation, but it gives
a direction the relationship: in other words it permits to assess how much the
independent variable (IV) is explaining the variation of the dependent variable
(DV). (O. Renaud and G. Pini 2005)
Null hypothesis: In the case of regression, the null
hypothesis is that there is no relationship between the dependent variable and
the independent variable, so the independent variable does not predict the
dependent variable. The alternative hypothesis is that it is possible to
predict the dependent variable from the independent variable. Eric Yergeau.
(2007)
For all the following hypotheses:
- The Significance Level is set has: á = 0.05 and,
- If p-value (Sig) < á the regression line fits the
data better than a flat line; the relationship is significant. (UCLA University
2008)
3.3.3 Hypothesis 1: socio-economical characteristics have a
positive effect on consumers buying decision of green product
For this hypothesis the researcher has established the null
hypothesis as:
- H0 = the socio-economical characteristics are not explaining
the consumption of green products
- H1 = the socio economical characteristics permit to explain the
consumption of green product
After implemented the hypothesis, three boards were obtained,
those tables would permit to determine if the independent variable
(socio-economical characteristics) has an effect on the dependent variable.

Table 3.5 H1 Model summary
Récapitulatif des modèles*
|
Modèle
|
R
|
|
R-deux
|
R-deux ajusté
|
Erreur standard de
l'estimation
|
|
dimensio
n0
|
1
|
|
,111a
|
,012
|
,006
|
1,09501
|
a. Valeurs prédites : (constantes), socio
*Model summary table translation. R-deux means R-square and
R-deux ajusté, R-square adjusted. The last column means standard
mistakes according the estimation.
As the researcher was using a French version of SPSS, all the
different tables are in French. A translation is provided for each table.
Firstly, the summary model table has to be studied. In this
table, the most interesting indications are the R and the R square (=R-deux).
The first, R, represents the simple correlation between the two variables, in
our case it is 0,111, which indicates a low degree of correlation; the
correlation is strong when it's close to 1. (Laerd Statistics 2007)
The R-square (R-deux) refers to the proportion of variance in
the dependent variable (green consumption) which can be explained by the
independent variables (socio-economical characteristics). «This is an
overall measure of the strength of association and does not reflect the extent
to which any particular independent variable is associated with the dependent
variable». (UCLA University 2007)
In this particular case, R-square is equal to 0,12 this means
that only 12% of the variance of green consumption could be explained by the
socio-economical characteristics; therefore it is not really important.
That's why the researcher has divided the socio-economical
characteristics in order to see which one is affecting, or not, the consumption
of green products.

Table 3.6 H1 ANOVA Table
ANOVAb**
|
Modèle
|
Somme des
carrés
|
ddl
|
Moyenne des
carrés
|
D
|
Sig.
|
|
1 Régression
Résidu
Total
|
2,214 177,460 179,673
|
1
148
149
|
2,214
1,199
|
1,846
|
,176a
|
a. Valeurs prédites : (constantes), socio
**ANOVA Table translation: the first column means sum of squares,
the third one is mean of the squares and the following one is F in English.
The second table is the ANOVA table; it refers to the analysis
of the variance. To be relevant, the improvement obtained with the independent
variable must be large and the residual between the observed and the regression
line, low. (Eric Yegereau 2009) Therefore we can observe that the part of
variance none explain by the independent variable is much more important,
177.46, than the part explain by the independent variable, 2.21. So it seems
that the socio-economical characteristics don't have an effect upon the green
consumption.
In this case, F (=D) is 1.846 and we get p-value = 0.176 >
0.05, in other words, at the p = 0.05 level of significance, there exists
enough evidence to conclude that the slope of the population regression line is
close to zero and, hence, that socioeconomical characteristics isn't useful as
a predictor of green consumption. (Statistical Sciences and Operations
Research; 2010)
So there isn't a statistically significant relationship between
the dependent variable and the independent variable.
We can conclude that the model with a predictor,
soio-economical characteristics, doesn't permits to predict the variable, green
consumption, better than a model without a predictor. (Eric Yegereau 2009)

Table 3.7 H1 Coefficients table
Coefficientsa***
|
Modèle
|
|
Coefficients
|
|
|
|
Coefficients non standardisés
|
standardisés
|
|
|
|
A
|
Erreur standard
|
Bêta
|
t
|
Sig.
|
|
1 (Constante)
|
4,048
|
,446
|
|
9,067
|
,000
|
|
socio
|
-,218
|
,161
|
-,111
|
-1,359
|
,176
|
a. Variable dépendante : green_consump
**Coefficient table translation: the first column means
unstandardized coefficients with A and standard error. The second column means
standardized coefficients. The last two columns remain the same.
The last table permits to see the relative importance of each
independent variable to the dependent variable and to draw the regression
equation.
For this hypothesis, the regression equation could be drawn as
followed: Green consumption = 4,048-0,218*socio-economical characteristics.
The coefficients, also, permits to look at the p-value (=sig), we
reject H0 if p< 0.05 (Jeff Sinn, 2008)
In this case, p = 0.176 therefore we get 0.176 > 0.05, as a
consequence we can't reject H0 and we have to say that generally the
socio-economical characteristics don't permit to explain the consumption of
green products.
3.3.3.1 H1a: the gender has a positive effect on green
buying
For this hypothesis the researcher has established the null
hypothesis as: H0 = the gender is not explaining the consumption of green
products
H1 = the gender has an effect on the consumption of green
product

Table 3.8 H1a Model summary
Récapitulatif des modèles
|
Modèle
|
R
|
|
R-deux
|
R-deux ajusté
|
Erreur standard de
l'estimation
|
|
dimensio
n0
|
1
|
|
,344a
|
,118
|
,113
|
1,03448
|
a. Valeurs prédites : (constantes), 2
For this hypothesis, we could observe that the correlation
between the variables, gender and the consumption of green products is not
really strong 0,344. Moreover, R-square is equal to 0,118 this means that only
11.8% of the variance of green consumption could be explained by the gender;
therefore it seems that the gender is not, wholly, explaining the consumption
of green products.
Table 3.9 H1a: ANOVA Table
ANOVAb
|
Modèle
|
Somme des
carrés
|
ddl
|
Moyenne des
carrés
|
D
|
Sig.
|
|
1 Régression
Résidu
Total
|
21,291 158,383 179,673
|
1
148
149
|
21,291
1,070
|
19,895
|
,000a
|
a. Valeurs prédites : (constantes), 2
b. Variable dépendante : green_consump
The part of variance none explain by the independent variable
is much more important, 158.4, than the part explain by the independent
variable, 21.3. So it seems that the gender don't have an effect upon the green
consumption.
In this case, the D (F) value is 19.895 and is significant at
p <0.0005. In other words, at the p = 0.05 level of significance, there
exists enough evidence to conclude that the slope of the population regression
line is not zero and, hence, that gender is useful as a predictor of green
consumption. So there is a statistically significant relationship between the
green consumption and the gender. However, according to the previous
observations, it is not a strong relationship between those variables;

as a consequence it appears that gender doesn't have a strong
effect upon green buying decision.
Table 3.10 H1a: Coefficients Table
Coefficientsa
|
Modèle
|
|
Coefficients
|
|
|
|
Coefficients non standardisés
|
standardisés
|
|
|
|
A
|
Erreur standard
|
Bêta
|
t
|
Sig.
|
|
1 (Constante)
|
2,358
|
,260
|
|
9,085
|
,000
|
|
gender
|
,717
|
,161
|
,344
|
4,460
|
,000
|
a. Variable dépendante : green_consump
For this hypothesis, the regression equation could be drawn as
followed: Green consumption = 2.358+0,717*gender.
For the p-value, in this case p = .000 therefore we get .000
< 0.05, as a consequence we reject H0 and we have to say that the gender can
explain the consumption of green products. However, as it was previously
explained, there isn't a strong relationship between those variables; as a
result, the gender doesn't seem to predict totally the consumption of green
product.
3.3.3.2 H1b: the level of income or revenue is positively
linked to
consumers green buying behavior
For this hypothesis the null hypothesis is:
H0 = the level of income is not explaining the consumption of
green products H1 = the level of income has an effect on the consumption of
green product
Table 3.11 H1b: Model Summary
Récapitulatif des modèles
|
Modèle
|
R
|
|
R-deux
|
R-deux ajusté
|
Erreur standard de
l'estimation
|
|
dimensio
n0
|
1
|
|
,291a
|
,084
|
,078
|
1,05424
|
a. Valeurs prédites : (constantes), 2

For this hypothesis, we can observe that the correlation
between the variables, level of income and the consumption of green products is
not really strong: 0,291. Moreover, R-square is equal to 0.084 this means that
only 8.4% of the variance of green consumption could be explained by the level
of income; therefore it seems that the level of income is not explaining the
consumption of green products.
Table 3.12 H1b ANOVA Table
ANOVAb
|
Modèle
|
Somme des
carrés
|
ddl
|
Moyenne des
carrés
|
D
|
Sig.
|
|
1 Régression
Résidu
Total
|
15,182 164,491 179,673
|
1
148
149
|
15,182
1,111
|
13,660
|
,309a
|
a. Valeurs prédites : (constantes), 2
b. Variable dépendante : green_consump
The part of variance none explain by the independent variable
is much more important, 164.491, than the part explain by the independent
variable, 15,182. So it seems that the level of education don't have an effect
upon the green consumption. In this case, the D (F) value is 13,660 and is
significant at p <0.0005. In other words, at the p = 0.05 level of
significance, there exists enough evidence to conclude that the slope of the
population regression line is close to zero and, hence, that the level of
income isn't useful as a predictor of green consumption. In this case, we keep
the null hypothesis formulated above. So there isn't a statistically
significant relationship between the green consumption and the level of
income.

Table 3.13 H1b Coefficients table
Coefficientsa
|
Modèle
|
|
Coefficients
|
|
|
|
Coefficients non standardisés
|
standardisés
|
|
|
|
A
|
Erreur standard
|
Bêta
|
t
|
Sig.
|
|
1 (Constante)
|
3,965
|
,163
|
|
24,313
|
,000
|
|
2
|
-,217
|
,059
|
-,291
|
-3,696
|
,309
|
a. Variable dépendante : green_consump
For this hypothesis, the regression equation could be drawn as
followed: Green consumption = 3,965-0,0.217*level of income.
For the p-value, in this case p = .0.309 therefore we get
.0.309 > 0.05, as a consequence we keep H0 and we have to say that the level
of income can't explain the consumption of green products.
3.3.3.3 H1c: the level of education is positively linked to
the
consumption of green products
For this hypothesis the null hypothesis is:
H0 = the level of education is not explaining the consumption of
green products H1 = the level of education has an effect on the consumption of
green products.
Table 3.14 H1c Model Summary
Récapitulatif des modèles
|
Modèle
|
R
|
R-deux
|
R-deux ajusté
|
Erreur standard de
l'estimation
|
|
1
dimensi
on0
|
,104a
|
,011
|
,004
|
1,09589
|
a. Valeurs prédites : (constantes), 2
For this hypothesis, we could observe that the correlation
between the variables,
level of education and the consumption of green
products is not strong at all:
0,104. Moreover, R-square is equal to 0.011
this means that only 1.1% of the

variance of green consumption could be explained by the level
of education; therefore it seems that the consumption of green products is not
dependent of the level of education.
Table 3.15 H1c ANOVA Table
ANOVAb
|
Modèle
|
Somme des
carrés
|
ddl
|
Moyenne des
carrés
|
D
|
Sig.
|
|
1 Régression
Résidu
Total
|
1,930 177,743 179,673
|
1
148
149
|
1,930
1,201
|
1,607
|
,207a
|
a. Valeurs prédites : (constantes), 2
b. Variable dépendante : green_consump
The part of variance none explain by the independent variable
is much more important, 177.743, than the part explain by the independent
variable, 1.930. So it seems that the level of education don't have an effect
upon the green consumption. In this case, the D (F) value is 1.607 and is
significant at p <0.0005. In other words, at the p = 0.05 level of
significance, there exists enough evidence to conclude that the slope of the
population regression line is close to zero and, hence, that the level of
education isn't useful as a predictor of green consumption. In this case, we
keep the null hypothesis formulated above. So there isn't a statistically
significant relationship between the green consumption and the level of
education.
Table 3.16 H1c Coefficients Table
Coefficientsa
|
Modèle
|
|
Coefficients
|
|
|
|
Coefficients non standardisés
|
standardisés
|
|
|
|
A
|
Erreur standard
|
Bêta
|
t
|
Sig.
|
|
1 (Constante)
|
3,873
|
,343
|
|
11,288
|
,000
|
|
2
|
-,126
|
,100
|
-,104
|
-1,268
|
,207
|
a. Variable dépendante : green_consump

For this hypothesis, the regression equation could be drawn as
followed: Green consumption = 3.873-0,126*level of education.
For the p-value, in this case p = .207 therefore we get .207
> 0.05, as a consequence we keep H0 and we have to say that the level of
education can't explain the consumption of green products.
3.3.3.4 H1d: employment status is positively linked to the
consumption of green product
For this hypothesis the null hypothesis is:
H0 = the employment status is not explaining the consumption of
green products H1 = the employment status has an effect on the consumption of
green product
Table 3.17 H1d Model Summary
Récapitulatif des modèles
|
Modèle
|
R
|
R-deux
|
R-deux ajusté
|
Erreur standard de
l'estimation
|
|
1
dimensi
on0
|
,228a
|
,052
|
,046
|
1,07279
|
a. Valeurs prédites : (constantes), 2
For this hypothesis, we could observe that the correlation
between the variables, the employment status and the consumption of green
products is 0.228, so it is a weak correlation. Moreover, R-square is equal to
0.052 this means that only 5.2% of the variance of green consumption could be
explained by the employment status; therefore it seems that the consumption of
green products is not dependent of the employment status.

Table 3.18 H1d ANOVA Table
ANOVAb
|
Modèle
|
Somme des
carrés
|
ddl
|
Moyenne des
carrés
|
D
|
Sig.
|
|
1 Régression
Résidu
Total
|
9,345 170,329 179,673
|
1
148
149
|
9,345
1,151
|
8,120
|
,007a
|
a. Valeurs prédites : (constantes), 2
b. Variable dépendante : green_consump
The part of variance none explain by the independent variable
is much more important, 170.329, than the part explain by the independent
variable, 9.345. So it seems that the employment status don't have an effect
upon the green consumption.
In this case, the D (F) value is 8.120 and is significant at p
<0.0005. In other words, at the p = 0.05 level of significance, there exists
enough evidence to conclude that the slope of the population regression line is
close to zero and, hence, that the employment status isn't useful as a
predictor of green consumption. In this case, we keep the null hypothesis
formulated above. So there isn't a statistically significant relationship
between the green consumption and the employment status.
Table 3.19 H1d Coefficients Table
Coefficientsa
|
Modèle
|
|
Coefficients
|
|
|
|
Coefficients non standardisés
|
standardisés
|
|
|
|
A
|
Erreur standard
|
Bêta
|
T
|
Sig.
|
|
1 (Constante)
|
3,026
|
,174
|
|
17,436
|
,000
|
|
2
|
,244
|
,086
|
,228
|
2,850
|
,007
|
a. Variable dépendante : green_consump
For this hypothesis, the regression equation could be drawn as
followed: Green consumption = 3.026+0.244*employment status

For the p-value, in this case p = .007 therefore we get .007
> 0.05, as a consequence we keep H0 and we have to say that the employment
status can't explain the consumption of green products.
3.3.3.5 H1e: the legal status is positively linked to green
purchasing
behavior
For this hypothesis the null hypothesis is:
H0 = the legal status is not explaining the consumption of green
products H1 = the legal status has an effect on the consumption of green
product
Table 3.20 H1e Model Summary
Récapitulatif des modèles
|
Modèle
|
R
|
R-deux
|
R-deux ajusté
|
Erreur standard de
l'estimation
|
|
1
dimensi
on0
|
,170a
|
,029
|
,022
|
1,08584
|
a. Valeurs prédites : (constantes), 2
For this hypothesis, we could observe that the correlation
between the variables, the legal status and the consumption of green products
is 0.170. Moreover, R-square is equal to 0.029 this means that only 2.9% of the
variance of green consumption could be explained by the legal status; therefore
it seems that the consumption of green products is not dependent of the legal
status.
Table 3.21 H1e ANOVA Table
ANOVAb
|
Modèle
|
Somme des
carrés
|
ddl
|
Moyenne des
carrés
|
D
|
Sig.
|
|
1 Régression
Résidu
Total
|
5,176 174,498 179,673
|
1
148
149
|
5,176
1,179
|
4,390
|
,038a
|
a. Valeurs prédites : (constantes), 2
b. Variable dépendante : green_consump

The part of variance none explain by the independent variable
is much more important, 174.498, than the part explain by the independent
variable, 5.176. So it seems that the legal status doesn't have an effect upon
the green consumption.
In this case, the D (F) value is 4.390 and is significant at p
< 0.0005. In other words, at the p = 0.05 level of significance, there
exists enough evidence to conclude that the slope of the population regression
line is close to zero and, hence, that the legal status isn't useful as a
predictor of green consumption. In this case, we keep the null hypothesis
formulated above. So there isn't a statistically significant relationship
between the green consumption and the legal status.
Table 3.22 H1e Coefficients Table
Coefficientsa
|
Modèle
|
|
Coefficients
|
|
|
|
Coefficients non standardisés
|
standardisés
|
|
|
|
A
|
Erreur standard
|
Bêta
|
T
|
Sig.
|
|
1 (Constante)
|
3,056
|
,209
|
|
14,587
|
,000
|
|
2
|
,159
|
,076
|
,170
|
2,095
|
,038
|
a. Variable dépendante : green_consump
For this hypothesis, the regression equation could be drawn as
followed: Green consumption = 3.056+0.159*legal status
For the p-value, in this case p = .038 therefore we get .038
> 0.05, as a consequence we keep H0 and we have to say that the legal status
can't explain the consumption of green products.

3.3.4 H2: living condition has a positive effect on
consumers green buying decision
3.3.4.1 H2a: The place of living is positively linked to green
buying behavior
For this hypothesis the null hypothesis is:
H0 = the place of living is not explaining the consumption of
green products H1 = the place of living has an effect on the consumption of
green product
Table 3.23 H2a: Model Summary
Récapitulatif des modèles
|
Modèle
|
R
|
R-deux
|
R-deux ajusté
|
Erreur standard de
l'estimation
|
|
1
dimensi
on0
|
,283a
|
,080
|
,074
|
1,05686
|
a. Valeurs prédites : (constantes), 2
For this hypothesis, we could observe that the correlation
between the variables, the place of living and the consumption of green
products is 0.283. Moreover, R-square is equal to 0.080 this means that only 8%
of the variance of green consumption could be explained by the place of living;
therefore it seems that the consumption of green products is not dependent of
the place of living.
Table 3.24 H2a ANOVA Table
ANOVAb
|
Modèle
|
Somme des
carrés
|
ddl
|
Moyenne des
carrés
|
D
|
Sig.
|
|
1 Régression
Résidu
Total
|
14,364 165,309 179,673
|
1
148
149
|
14,364
1,117
|
12,860
|
,305a
|
a. Valeurs prédites : (constantes), 2
b. Variable dépendante : green_consump

The part of variance none explain by the independent variable
is much more important, 165.309, than the part explain by the independent
variable, 14.364. So it seems that the place of living doesn't have an effect
upon the green consumption. In this case, the D (F) value is 12.860 and is
significant at p < 0.0005. In other words, at the p = 0.05 level of
significance, there exists enough evidence to conclude that the slope of the
population regression line is close to zero and, hence, that the place of
living isn't useful as a predictor of green consumption. Therefore we keep the
null hypothesis formulated above. So there isn't a statistically significant
relationship between the green consumption and the place of living.
Table 3.25 H2a Coefficients Table
Coefficientsa
|
Modèle
|
|
Coefficients
|
|
|
|
Coefficients non standardisés
|
standardisés
|
|
|
|
A
|
Erreur standard
|
Bêta
|
T
|
Sig.
|
|
1 (Constante)
|
4,087
|
,197
|
|
20,777
|
,305
|
|
2
|
-,362
|
,101
|
-,283
|
-3,586
|
,010
|
a. Variable dépendante : green_consump
For this hypothesis, the regression equation could be drawn as
followed: Green consumption = 3.056+0.159*legal status
For the p-value, in this case p = .010 therefore we get .010
> 0.05, as a consequence we keep H0 and we have to say that the legal status
can't explain the consumption of green products.
3.3.4.2 H2b: The household size is positively linked to green
buying behavior
For this hypothesis the null hypothesis is:
H0 = the household size is not explaining the consumption of
green products H1 = the household size permits to explain the consumption of
green product

Table 3.26 H2b Model Summary
Récapitulatif des modèles
|
Modèle
|
R
|
|
R-deux
|
R-deux ajusté
|
Erreur standard de
l'estimation
|
|
dimensio
n0
|
1
|
|
,090a
|
,008
|
,001
|
1,09738
|
a. Valeurs prédites : (constantes), 2
For this hypothesis, we could observe that the correlation
between the variables, the household size and the consumption of green products
is 0.090. Moreover, R-square is equal to 0.008 this means that only 0.8% of the
variance of green consumption could be explained by the household size;
therefore it seems that the consumption of green products is not dependent at
all of the household size.
Table 3.27 H2b ANOVA Table
ANOVAb
|
Modèle
|
Somme des
carrés
|
ddl
|
Moyenne des
carrés
|
D
|
Sig.
|
|
1 Régression
Résidu
Total
|
1,447 178,226 179,673
|
1
148
149
|
1,447
1,204
|
1,201
|
,275a
|
a. Valeurs prédites : (constantes), 2
b. Variable dépendante : green_consump
The part of variance none explain by the independent variable
is much more important, 178.226, than the part explain by the independent
variable, 1.447. So it seems that the household size doesn't have an effect
upon the green consumption. In this case, the D (F) value is 1.201 and is
significant at p < 0.0005. In other words, at the p = 0.05 level of
significance, there exists enough evidence to conclude that the slope of the
population regression line is close to zero and, hence, that the household size
isn't useful as a predictor of green consumption. Therefore we keep the null
hypothesis formulated above. So there isn't a statistically significant
relationship between the green consumption and the household size.

Table 3.28 H2b Coefficients Table
Coefficientsa
|
Modèle
|
|
Coefficients
|
|
|
|
Coefficients non standardisés
|
standardisés
|
|
|
|
A
|
Erreur standard
|
Bêta
|
t
|
Sig.
|
|
1 (Constante)
|
3,728
|
,266
|
|
14,020
|
,000
|
|
2
|
-,187
|
,171
|
-,090
|
-1,096
|
,275
|
a. Variable dépendante : green_consump
For this hypothesis, the regression equation could be drawn as
followed: Green consumption = 3.728-0.187*household size
For the p-value, in this case p = .275 therefore we get .275
> 0.05, as a consequence we keep H0 and we have to say that the household
size can't explain the consumption of green products.
3.3.5 H3: The store type is has a positive effect on green
consumer behavior
For this hypothesis the null hypothesis is:
H0 = the store type is not explaining the consumption of green
products H1 = the store type has an effect on the consumption of green
product
Table 3.29 H3 Model Summary
Récapitulatif des modèles
|
Modèle
|
R
|
|
R-deux
|
R-deux ajusté
|
Erreur standard de
l'estimation
|
|
dimensio
n0
|
1
|
|
,515a
|
,266
|
,261
|
,94415
|
a. Valeurs prédites : (constantes), 2
For this hypothesis, we could observe that the correlation
between the variables, the store type and the consumption of green products is
0.515, which is relatively important. Moreover, R-square is equal to 0.266 this
means that 26.6% of the variance of green consumption could be explained
because of the store type;

therefore it seems that the consumption of green products is
affected by the type of store.
Table 3.30 H3 ANOVA Table
ANOVAb
|
Modèle
|
Somme des
carrés
|
ddl
|
Moyenne des
carrés
|
D
|
Sig.
|
|
1 Régression
Résidu
Total
|
47,743 131,930 179,673
|
1
148
149
|
47,743
,891
|
53,559
|
,000a
|
a. Valeurs prédites : (constantes), 2
b. Variable dépendante : green_consump
The part of variance none explain by the independent variable
is more important, 131.930, than the part explain by the independent variable,
47.743. So it seems that the consumption of green product is moderately
affected by the type of store.
In this case, the D (F) value is 53.559 and is significant at
p < 0.0005. In other words, at the p = 0.05 level of significance, there
exists enough evidence to conclude that the slope of the population regression
line is not zero and, hence, that the store type is useful as a predictor of
green consumption. Therefore we reject the null hypothesis formulated above. So
there is a statistically significant relationship between the green consumption
and the type of store.
Table 3.31 H3 Coefficients Table
Coefficientsa
|
Modèle
|
|
Coefficients
|
|
|
|
Coefficients non standardisés
|
standardisés
|
|
|
|
A
|
Erreur standard
|
Bêta
|
t
|
Sig.
|
|
1 (Constante)
|
2,817
|
,116
|
|
24,255
|
,000
|
|
2
|
,352
|
,048
|
,515
|
7,318
|
,000
|
a. Variable dépendante : green_consump
For this hypothesis, the regression equation could be drawn as
followed: Green consumption = 2.817+0.352*store type

For the p-value, in this case p = .000 therefore we get .000
> 0.05, as a consequence we reject H0 and we have to say that according to
the store type, the consumption of green products could be facilitated.
3.3.6 H4: Good knowledge / high environmental knowledge
lead to the consumption of green products
For this hypothesis the null hypothesis is:
H0 = Green knowledge is not explaining the consumption of
green products H1 = Green knowledge permits to explain the consumption of green
product Table 3.32 Model Summary
|
Récapitulatif des modèles
|
|
Modèle
|
R
|
R-deux
|
R-deux ajusté
|
Erreur standard de
l'estimation
|
|
dimen
sion0
|
1
|
,815a
|
,664
|
,662
|
,63825
|
|
a. Valeurs prédites : (62onstants), 2
|
For this hypothesis, we could observe that the correlation
between the variables, the store type and the consumption of green products is
0.815, which indicates a high correlation. Moreover, R-square is equal to 0.664
this means that 66.4% of the variance of green consumption could be explained
because of the green knowledge of the consumers; which is very large; therefore
it seems that the consumption of green depends of the green knowledge of
consumer.
Table 3.33 H4 ANOVA Table
ANOVAb
|
Modèle
|
|
Somme des
|
|
|
Moyenne des
|
|
|
|
|
|
carrés
|
ddl
|
|
carrés
|
D
|
Sig.
|
|
|
1
|
Régression
|
119,383
|
|
1
|
119,383
|
293,060
|
|
,000a
|

a.
Résidu 60,290 148 ,407
Total 179,673 149


Valeurs prédites : (constantes), 2
b. Variable dépendante : green_consump
The part of variance none explain by the independent variable
is less important, 60.290, than the part explain by the independent variable,
119.383. So it seems that having a good knowledge is determining the
consumption of green products.
In this case, the D (F) value is 293.060 and is significant at
p < 0.0005. In other words, at the p = 0.05 level of significance, there
exists enough evidence to conclude that the slope of the population regression
line is not zero and, hence, that the green knowledge / consciousness is useful
as a predictor of green consumption. Therefore we reject the null hypothesis
formulated above. So there is a statistically significant relationship between
the green consumption and green knowledge.
Table 3.34 H4 Coefficients Table
Coefficientsa
|
Modèle
|
|
Coefficients
|
|
|
|
Coefficients non standardisés
|
standardisés
|
|
|
|
A
|
Erreur standard
|
Bêta
|
t
|
Sig.
|
|
1 (Constante)
|
,673
|
,171
|
|
3,942
|
,000
|
|
2
|
,873
|
,051
|
,815
|
17,119
|
,000
|
a. Variable dépendante : green_consump
For this hypothesis, the regression equation could be drawn as
followed: Green consumption = 0.673+0.873*green knowledge
For the p-value, in this case p = .000 therefore we get .000
> 0.05, as a consequence we reject H0 and we have to say that the green
knowledge is facilitating the consumption of green products.

3.3.7 H5: The intention to buy green product is positively
linked the act of purchasing green product
For this hypothesis the null hypothesis is:
H0 = The intention to buy is not explaining the consumption of
green products H1 = The intention to buy permits to explain the consumption of
green product
Table 3.35 H5 Model Summary
Récapitulatif des modèles
|
Modèle
|
R
|
R-deux
|
R-deux ajusté
|
Erreur standard de
l'estimation
|
|
1
dimensi
on0
|
,856a
|
,733
|
,731
|
,56914
|
a. Valeurs prédites : (constantes), intention
For this hypothesis, we could observe that the correlation
between the variables, the store type and the consumption of green products is
0.856, which indicates a high correlation. Moreover, R-square is equal to 0.733
this means that 73.3% of the variance of green consumption could be explained
because of the intention to buy green products; which is very large; therefore
it seems that most of the time, those who have the intention to buy green
Table 3.36 ANOVA Table
ANOVAb
|
Modèle
|
Somme des
carrés
|
ddl
|
Moyenne des
carrés
|
D
|
Sig.
|
|
1 Régression
Résidu
Total
|
131,732 47,941 179,673
|
1
148
149
|
131,732
,324
|
406,676
|
,000a
|
a. Valeurs prédites : (constantes), intention
b. Variable dépendante : green_consump
The part of variance none explain by the independent variable
is less important,
47.941, than the part explain by the independent
variable, 131.732. So it seems that

people who have the intention to buy are finally buying green
products, they are following their intention.
In this case, the D (F) value is 406.676 and is significant at
p < 0.0005. In other words, at the p = 0.05 level of significance, there
exists enough evidence to conclude that the slope of the population regression
line is not zero and, hence, that the intention to buy green is useful as a
predictor of green consumption. Therefore we reject the null hypothesis
formulated above. So there is a statistically significant relationship between
the green consumption and the intention to buy green.
We can conclude that the model with a predictor (intention to
buy green) permits to predict the variable (green consumption) better than a
model without a predictor.
Table 3.37 Coefficients Table
Coefficientsa
|
Modèle
|
|
Coefficients
|
|
|
|
Coefficients non standardisés
|
standardisés
|
|
|
|
A
|
Erreur standard
|
Bêta
|
t
|
Sig.
|
|
1 (Constante)
|
,411
|
,158
|
|
2,602
|
,010
|
|
intention
|
1,004
|
,050
|
,856
|
20,166
|
,000
|
a. Variable dépendante : green_consump
For this hypothesis, the regression equation could be drawn as
followed: Green consumption = 0.411+1.004*green knowledge
For the p-value, in this case p = .000 therefore we get .000
> 0.05, as a consequence we reject H0 and the relationship is reliable and
can be used to make predictions. (Jeff Sinn 2008)
3.4 Resume
In order to resume all the tests, the following board was
drawn and will allow the reader to have an overview of the validated and
rejected hypothesis according to the previous test. In the next chapter those
results will be discussed and analysed.

Table 3.38 Hypotheses resume
|
Hypotheses
|
Results
|
H1: socio-economical characteristics have a positive effect on
consumers buying decision of green product
|
Rejected
|
|
H1a: the gender has a positive effect on green buying.
|
Validated
|
|
H1b: the level of income or revenue is positively linked to
consumers green buying behavior.
|
Rejected
|
|
H1c: the level of education is positively linked to the
consumption of green products.
|
Rejected
|
|
H1d: employment status is positively linked to the consumption of
green product.
|
Rejected
|
|
H1e: the legal status is positively linked to green purchasing
behavior.
|
Rejected
|
H2: living condition has a positive effect on consumers green
buying decision
|
Rejected
|
H2a: The place of living is positively linked to green buying
behavior.
|
Rejected
|
H2b: The household size is positively linked to green buying
behavior.
|
Rejected
|
H3: The store type is has a positive effect on green consumer
behavior
|
|
Validated
|
|
H4: Good knowledge / high environmental knowledge lead to the
consumption of green products.
|
Validated
|
H5: The intention to buy green product is positively linked the
act of purchasing green product
|
Validated
|

Chapter IV
Conclusions and recommendations

4.1 Introduction
What are the main determinants of the demand for green
products? The answer of this question is really important since we could
observe in the recent past years, changes in our modes of consumption or
production in order to protect our natural environment, due to an increase in
public environmental concern.
Recently, the development of green marketing have unable
consumers to change their consumption habits due to their personal beliefs,
norms, environmental concern, perceived effectiveness etc.
However, not all consumers are considering themselves as
environmentally concerned and, are not consuming green products; mostly due to
a scepticism feeling against those products and against companies that are
delivering those products.
This part would present the conclusions of the obtained
results and give some for businesses recommendations in order to deal with
it.
The current study extends previous research about the
consumption of green products by incorporating personal and contextual
dimensions with the sociodemographics factors.
This study was design in order to give useful information about
green consumer.
4.2 Findings: analysis and discussion
The following discusses, interprets, and-where possible
explains the power of the socio-demographics factors. Non significant findings
are also discussed because of the importance these have in developing a
complete profile of green consumer.
4.2.1 Socio-economical factors, living condition and stores
types
The results are relevant: generally the socio-economical
characteristics don't permit to explain the consumption of green products. In
fact, the results have shown that the consumption of green products don't seem
to be facilitate by a specific consumer profile, which make their
identification more complicated.
Within the socio-economical characteristics only few seem to have
a small impact on green consumerism.

Firstly, gender appears to have a small effect on the
consumption of green products, this means that according to the gender, the
consumption tend to not be the same. Those results were surprising as the
researcher assumption tend to be not validated. Indeed, as women tend to do the
majority of the shopping (Goldman, Heath, and Smith 1991) the researcher first
though that woman tend to consume more green products than man. However it
seems that the difference is not really significant, at least for this study
and with this sample. In fact, some researchers have generally found that woman
tend to be «more willing to engage in the environmentally friendly
activities.» (Booi-Chen TAN*Teck-Chai LAU** 2009 ; Mainieri et al., 1997;
Straughan and Roberts, 1999). Moreover, Jennifer Grayson (2010) has revealed
that there is "small, but statistically significant" greater concern for women.
However the researcher said that "some other research does not find this
effect, and the effect of gender on environmental concern is somewhat
controversial in the academic literature in this area," (Jenifer Grayson 2010).
This reveals that the difference between men and women is not clear and easy to
define. Finally, those results were surprisingly as the researcher has thought
that it would be more significant, that it would appear clearly that women tend
to consume greener than men.
In addition, the level of income tends to not have an impact
on the consumption of green product. This reveals that the consumption of green
products is not link to the revenue of the consumer. Thus consumers tend to not
pay attention to the price when they are buying green products; as it was
explained by various authors (J. Ottman 1994; Roche C. 2008). That was a
surprising result as the researcher firstly assumed that green products are
perceived as more expensive, and as a consequence, are more consumed by
consumers which have a higher income. It appears that it is not a clear
barrier. This tends to show that people with a strong environmental motivation
/ intention are less sensitive to the price. This is in line with previous
studies that show «consumers who are concerned about the environment are
more willing to pay a premium for green products» (Tanner and Kast
2003).
Furthermore the findings provide little evidence that
difference in legal status,
education or employment status, have a
significant impact on the green purchases

behaviour, as it might be expected (once again this is
actually the case for this study).
The researcher has thought that a high level of education
could lead to a greater consumption of green products. In fact, the researcher
assumes that people with a greater educational level tend to be more informed
about environmental concern and green products. However, with the findings it
appears that the level of education doesn't permit to explain green
consumerism, this permit to reveal the increasing awareness about environmental
concern within the whole consumers. However, some studies have revealed that
the consumption of green products tend to be higher within people with a
greater income (Mark A. White. 2011). This tends to not be validated with this
sample and reveal that the level of education, as the gender, is mostly
discussed and still difficult to explain: it is not a clear determinant or a
clear barrier.
Those results are in line with various researches that have
shown that it is difficult to define a clear profile of green consumers
(Mcmilker 2008; Anderson 1974). Additionally, this could explain the
difficulties of defining precisely the determinants of green consumption and,
the important number of determinants that have been defined.
However, it appears that the place of shop have an impact on
the green purchase behaviour; in other words it seem that the consumption of
green product tend to be facilitated according to the place of shopping.
Indeed, the findings have shown that the respondents are mostly buying their
green products in supermarkets and organic stores. According to Tanner and Kast
(2003) «it is not surprising that what people buy is strongly related to
where they shop». Indeed in this study what was a surprise is that it
appears that supermarkets are not diminishing the intention to buy green
products. The researcher has firstly thought that people are willing to buy
green products in organic stores or farmer's market for example; due to the
specificity of those products those stores appear as more suitable than
supermarkets. However, according to the findings, supermarkets are the first
place of shop for green products; this can be explained due to the recent
development in the offer of green products by those stores. Nowadays, it is
easier to find green products in supermarkets. In fact, as it is the first
place where people are going to

shop (at least in this sample) the researcher has finally
found logical that this type of store have an impact on the consumption of
green products. However it appears that, in supermarkets, there is a particular
consideration for the production of food, but a moderate attention on other
product features that can affect sustainability (for example conservation,
packaging etc.) (Tanner and Kast 2003). As a result the development of green
products within supermarkets permits to increase organic products in term of
number to (sometimes) the detriment of the quality. (William Young 2008)
Additionally, the findings have revealed that the place of
living and the household size don't have a significant impact on the green
purchase behaviour. The researcher has first thought that consumers living in
suburbs or country sides were more willing to buy green products. However it
appears that there is no significant difference according to the place of
living; this could be explained due to the development of green products within
different types of stores (supermarkets, organic store) or farmer's market,
green products are widely available either in city center or suburbs, country
side etc.
According to the household size, the findings have revealed
that the green purchase is not directly determined by the household size. In
fact, the researcher has first thought that consumers of green products were
single or young couple with high level of income, but actually it seems that it
is not the case anymore. It is much more complicated as it appears that green
purchase behaviour doesn't depend of the household size. Some researches tend
to show that green purchasing behaviour could be influenced by the household
size and the legal status. Nowadays, the growth of green products is more and
more due to consumption by younger and family oriented group; according to
Stella Giani (2010), family contributes for example to 50% of the growth of
organic food. As a result, the researcher assumption is not validated and this
reveals the various «profiles» of green consumers.

4.2.2 Green knowledge and intention
Furthermore, this research tend to validate that consumer with
strong environmental knowledge are willing to consume more green products.
Indeed, those results tend to show that green knowledge is kind of driving
green purchase by acting on the motivation and ability to act in an
environmentally friendly way (Nicole Darnall et al. 2008). Generally, authors
agree to say that green knowledge has a significant impact on green purchasing.
However some other researchers disagree whit that and tend to demonstrate that
there isn't necessarily a link between the knowledge and the green consumption
(Chan 1999; Hines 1987; ). In this case, with this sample, it is actually true,
but in this study the researcher assumes that green knowledge refers to
«the general knowledge of facts, concepts and relationship concerning the
natural environment and its major ecosystem«(Fryxell and lo 2003 p 45); in
other words it's what consumer know about the environment issues. However, it
is existing different types of knowledge; the researcher hasn't studied them
due to a lack of time. According to Nicole Darnall et al. (2008), it is
existing two kind of green knowledge: general knowledge and action-based
knowledge. The general knowledge refers to consumers basic knowledge (Hines et
al 1987) about environmental issues (it is what the researcher has studied);
action-based knowledge refers to «consumers' understanding of activities
required to mitigate environmental problems» (Nicole Darnall et al. 2008).
As a consequence, with the decision of the researcher to not study the action
based knowledge an important part of the population was not sampled and, as a
consequence the results could have been different.
Additionally, the findings have permitted to highlight that
generally people which are willing to purchase green product are finally doing
it. It seems that people with the intention to buy green are finally
transforming their intention in act, and this is not always the case. Indeed
Dunlap, Van Liere, Mertig, & Jones (2000) and Kaplan (2000) have analyzed
that a lot of people are aware and feel concerned with environmental problem;
however this is not always reflected in their behaviours. With this study it
appears that people intention is reflected in their behaviours. With this study
the researcher has revealed that there is a gap between the

intention to buy and the act of buying. In fact, it appears
with the findings that, even if the rate is really low, some people have the
intention to buy but are finally not doing it. How can we explain that? With
the findings, it appears that due to higher price and the perceived lower
quality, consumers tend to not buy green. As a result, even people with
environmental consciousness tend to not consume green products.
Moreover, the researcher has found that if people with
intention to buy are finally not doing it, it could be due to their perception
of the company. Indeed, consumers tend to look at the corporate social
responsibility of companies before buying products. (Matthias Vollmert 2007 ;
Lois A. Mohr, Webb D., Harris K., 2001; Percy Marquina 2007) In fact, recent
studies have revealed that «there is a positive relationship between a
company's CSR and consumer's attitudes towards a company and its
products.» This is true for all different types of products or services.
(Sankar Sen and C.B. Bhattacharya 2001) As a result, in the case of green
purchasing, it appears that even consumers with strong pro-environmental
feelings are not necessarily buying green products due to the company
background. (By David Wolinsky 2011; Thomas P. Lyon* and John W. Maxwell 2008)
However, Green purchasing is not only a question of social responsibility,
nowadays it becomes a top priority for consumers, who are starting to look, not
only to the origin of the products, but also to their impact upon the
environment. Green products are very common and, as it was found in the results
part, some people may feel reluctant against those products: they think that
companies are just trying to get new consumers and are not really providing
green products; which are in line with what have been found by the
researcher.
4.3 Conclusion
The actual modes of consumption in industrial country are
responsible of the degradation of the environment; sustainable development will
need alternative consumptions. However, because of the various and relative
complexity of the involved factors, it appears that it will be difficult to
implement it. Many efforts will have to be done, in order to improve the
situation, by consumers and

manufacturers. Modification in consumers' attitudes and
behaviours may stimulate changes in lifestyles. Manufacturers can also affect
consumers by encouraging new developments. It appears that there is a great
potential for green consumption but this consumption is blocked by various
barriers. Green consumption is really difficult to evaluate and predict due to
the numbers of factors involved. This study has permitted to highlight one
aspect of those factors; with the socio-demographics factors; and the
complexity of defining precisely the determinant of green consumption.
In this particular study, it appears that the green
consumption is not driven by the socio-demographic factors. Indeed, only few
factors, seems to have a small impact on the green purchasing behaviour,
gender, type of store and the level of green knowledge. As a result to the
research question what are the determinants of green consumption? The
researcher has revealed the gap between its first assumptions and the reality
of findings; this is mostly due to the importance of others factors mostly
psychographic factors. Due to their relatively low impact, that's why only few
studies have been conducted with those factors, as they seem to be not really
significant.
However, the findings are only based on a sample of 150
respondents, which can explain the gap between the researcher's findings and
its first assumptions; generally it appears that the socio-demographics factors
don't have a significant impact on the green purchase behaviour, as much as
expected initially. As a consequence, the results could be different. Thus as
it was explained in various researches it appears that green purchase behaviour
is more link to the attitude, belief, values and to psychological factor in
general (Ken Peattie 2010; Stewart Barr 2008 (p222) ). The green purchasing
behaviour is more driven by the general attitude of the consumer rather than by
a specific «profile».
Those findings have leaded the researcher to make
recommendations for businesses in order to determine how to foster green food
purchases among consumers.

4.4 Recommendations for businesses
These findings suggest a number of implications on how to
foster sustainable food. Firstly, the findings permit to suggest that companies
should target, as a priority, women. In fact, even if it's not really
significant with this sample, women tend to be the most important consumer of
green products. Indeed, it appears that women tend to be «greener»
than men, especially on daily products, like food, cleaning products etc. It
appears that men are willing to act for the environment but with a more
significant impact, like green equipment of the house etc. As a result, for
daily products businesses should focus on women, as they are still the most
important population of doing shopping.
Concerning the household size and legal status, in the
findings this do not appear clearly, as here the researcher has found that
there are no relationship with green purchasing. However, various researches
are not in line with those results and, even if the results are not revealing
it, the researcher agrees with the fact that businesses can't only target one
segment of the population: the upper class. Nowadays, mentalities are evolving
and it appears that green products need to be more and more oriented to family
and people with lower income. Businesses have to adapt their products to the
demand which is now moving quickly and increasingly growing; adapt in term of
offer and price. Actually, it is possible to find, easily, green products at a
really affordable price (especially in supermarkets) but what about the
quality, the mode of production or the origin of such products? In fact,
consumers may not trust those products and can feel confused with it.
Indeed, according to the findings, consumers may be confused
due to the wide availability of green products. As a result, businesses will
need to explain clearly what the benefits are, the point, of buying their green
products. Would it permit to reduce waste? Would it permit to conserve energy?
Businesses need to overall, put on the front stage why using their green
products would permit to keep the environment safe. Businesses have to give
consumers specific facts about how their products can reduce waste, protect the
environment, save energy etc. Businesses should also give details about the
impact of those products; small actions could have on pollution, air quality,
water, natural resources etc. If businesses are giving

many details about their products, it would permit to improve
products visibility and consumers understanding. (Sophie Southern 2010)
In addition, people could feel confused, but also the
researcher has revealed that consumers are looking at company's social
responsibility before buying green products. Indeed, it appears that consumers
may not trust a company «green engagement». Businesses have to be
honest and truthful; they have to clearly explain the specific part,
ingredients, of the product or the process used, that make this product a green
one. This would allow businesses to be more visible and will let consumers
trust their practices. This would encourage them in purchasing green products.
Generally, it is logical to assume that it is people involved in production and
promotion of green products, who need to reflect on which products and
behaviors have a significant environmental impact. (Kim Harrison. (2011)
Finally, even if the potential of green products is
increasingly growing, it appears that many efforts are still needed, especially
on the price. The findings have revealed that the price is not so important for
consumers that have a strong environmental concern and are willing to buy green
products. For the others it could be a major obstacle. In fact, a French study
has revealed that 78% of French people, found the price as the main barrier for
the purchase of green products. (Belle au naturel, 2011)
Therefore, a question may arise: who have to initiate efforts
in order to encourage green consumption? Professionals? Or Consumers?
Indeed, in order to promote green products, is it the
responsibility of professionals? Nowadays they are already facing with the
crisis and they will need to, while respecting the sustainability goals of
course, find ways to reduce the price gap between conventional products and
green products.
In addition, the researcher has asked herself if, in order to
encourage green consumption, it is not a responsibility of the consumer rather
than professional. A consumer who have to accept a higher price for green
products because those products would be profitable over time and especially
respectful of nature and human values. They have to understand that green
products are focusing on quality of preservation at the convenience of
disposable, those products are preferring ethics against lowest price.

The question has to be asked but it clearly appears that the
answer is surely both, consumers and professionals have to make effort. Green
consumption depends of many factors and it appears that manufacturers need to
make effort in order to respect their green engagement, offering valuable green
products and make them visible; consumers by understanding the benefits of
those products and trying to consume toward sustainability.

Chapter V
Limitations and suggestions for future
research

5.1 Limitations
5.1.1 Results limitation
All the results, of this study, have to be taken with caution.
Indeed, the researcher has based its results and conclusions on a basis of 150
respondents, which do not represent the whole population. In addition, the
researcher has tried to get answers from different profile; however it appears
that the majority of the respondents were students and that could modify the
results. Indeed, getting answers from only a specific part of the population
could not give representative results for the whole population that's why the
researcher wanted these results to be taken with caution. The researcher wanted
to make some comments about the recommendations. Those recommendations were
established mostly because of these study findings and, as a consequence, these
recommendations can't be applied to all businesses. Those are general
recommendations and of course some changes could be necessary according to
business size, activity etc. Due to the limited number of answers, the
researcher suggests that those conclusions and the following recommendations
can't be generalized to the entire population. These are general indications
for businesses and don't have the pretentiousness to fit all businesses and be
able to solve problems of green products commercialization and purchasing. This
study has permitted to highlight the determinants for green consumption with a
limited sample; therefore the results have to be treated with caution.
5.1.2 Material limitation
In addition, if the researcher had more time, she would be
able to got answers from a larger sample; this would permits to get more
accurate responses. Moreover, the researcher would be able to choose other way
to gather information. The researcher has used, only, an online questionnaire
in order to gather information and, it is not the most accurate choice as it
has various disadvantages. As the researcher has explained in the methodology's
part, with online questionnaire the potential respondents must have an email
address or internet access and know how to use it in order to answer the
questionnaire. Secondly there can be an age / gender bias due to varying
experience with internet. Lastly, with online questionnaire we may not include
non-internet users.

Due to a lack of time, the researcher has found that online
questionnaire was the best choice for gathering the data. If the researcher had
more time, she would be able to gather information with for example, face to
face interview and focus group. Concerning the sampling, the researcher was
hesitated between two types; with more time, the researcher would be able to do
a quota sampling. This sampling would permits to obtain representative of the
overall population by divided it by the most important variables. This is quick
and easy to set up.
5.1.3 Initial against accomplished objectives
The initial objectives of this study were to highlight if the
socio-demographics characteristics could be seen as determinant in the
consumption of green product. The researcher has been able to reach this
objective as all the initial hypotheses have been test. However, the researcher
wanted initially to get a larger sample and wanted to use different way for
gathering the information, like face to face interview or focus group. Those
gathering techniques would allow the researcher to obtain information on their
opinions, attitudes and experiences or to explain their expectations against
green products. It is therefore a rapid qualitative method of inquiry.
The researcher was unable to do that due to the constraints that
were explained previously. This hadn't an impact of the initial objectives but
certainly this permits to explain the gap between the researcher first
assumptions and the findings. Additionally, the researcher wanted initially to
draw a green consumer profile. However, it rapidly appears that it was not
possible. Due to the findings it clearly appear to the researcher that green
consumer seem to be too heterogeneous in order to establish a specific profile.
With this sample it was not possible, that's why further research has to be
conducted in order to see if it is possible to draw a specific profile for
green consumers.
5.1.4 Unusual Results
Finally, with the finings it appears that some results are
difficult to explain. Indeed,
the research has found difficult to explain
the results for various hypotheses. With
this study, the researcher has
found that the gender has a small impact on green

consumerism, but as this is really discussed within many
studies it was difficult for the researcher to make a clear conclusion about
this hypothesis. In addition, the hypothesis about the level of education is
also really discussed and therefore, difficult to validate or not.
Due to the wide availability of results on the determinant of
green consumption, it was difficult for the researcher to make clear
conclusions about various hypotheses. As a result, the conclusions are based on
the researcher results according to its first assumptions, further researches
will be needed in order find more accurate results. Therefore, one more time,
the results can't be generalized.
5.2 Suggestions for future research
In order to find more accurate results; as in this study there
is only a sample of 150 respondents; about the socio-demographic factors,
future research should use a sample containing a wide range of ages,
educational levels, level incomes or legal status. In fact, many researchers
have found that the age is strongly related to the level of environmental
concern (Mohai and Twight; 1987). Moreover, some researchers have found that
high levels of pro-environmental behavior could be found in consumers who were
more educated and with a higher occupational status. (Diana L. Haytko and Erika
Matulich 2007)
This permits to see that others studies have found that
socio-demographic factors could have an impact upon green consumerism and
that's why further researches have to be conducted on this subject with larger
samples.
However, this study is line with various researchers that have
found sociodemographics factors as less interesting in order to explain the
consumption of green products (Mcmilker 2008; Anderson 1974). Therefore, it
seems that additional work on profiling segmentation should focus more on
psychographics factors that traditional socio-demographic one. In fact,
psychographics characteristics permit to go deeper into people's lifestyles and
behaviors, including their interests and values. As the environment is
continuously evolving it is important that segmentation criteria have to be
validated very often in order to see if they could have an impact on green
consumerism.

Additionally, due to the importance of psychographic factors,
further researches have to be conducted in order to identify new factors. It
seems reasonable and logical to spend as much effort as possible on the most
important factor, as a segmentation criterion.
There is still a lot of research that could be done to understand
and help behavior' change towards green and sustainability.

General Conclusions
According to the previous analysis and findings, the researcher
is able to draw the following conclusions:
- Environmental concern is increasingly growing and, that have
permitted to development of green marketing; this could be deducted of the
previous analysis.
- The growth of green marketing has permitted the growth of green
washing and consumers skepticism, this can be deducted from the previous
study.
- Green consumption has a big potential and is increasingly
growing, which can be deducted from the study.
-Determinant of green consumption are various and difficult to
predict, which can be deducted from the study.
- Generally, the socio-demographics factors don't seem to have
a strong impact on the green purchasing behavior, which can be deducted
according to the previous research.
- The socio-economical characteristics don't permit to explain
green purchasing behavior, which can be deducted due to the previous study.
-Only few socio-economical' factors permit to explain green
consumerism, which can be deducted from the study.
- The gender can have a small impact on green purchasing
behavior, which can be deducted due to the previous study and various
researches.
- The level of education doesn't seem to have an impact on the
green consumption; this can be deducted due to the previous research.
- The income level doesn't appear as a determinant of green
purchasing, which can be deducted from the previous study and researches.
-The legal status doesn't seem to have an impact on green
consumption, which can be deducted from the previous analysis.
- The employment status doesn't have an impact on green
consumption, which can be deducted from the previous analysis.
- The place of living doesn't seem to have an impact on green
consumption, which can be deducted from the previous analysis.

- The household size doesn't seem to have an impact on green
consumption, which can be deducted from the previous analysis.
- The store type seems to influence the green purchasing
decision, which can be deducted from the current study and previous
researches.
- Consumer with a high level of environmental concern are more
willing to consume green products, this can be deducted from the previous
research.
- The intention to buy a green product is most of the time
following by the act of buying; this was deducted with the previous
analysis.
- With this study's results it is not possible to draw a specific
profile for green consumers, which can be deducted from the previous
analysis.

References
· Afzaal Ali (2011) « Determinants of Pakistani
Consumers' Green Purchase Behavior: Some Insights from a Developing Country
» International Journal of Business and Social Science Vol. 2 No. 3
[Special Issue - January 2011]
· Alan O. Sykes. (1986). An Introduction to Regression
Analysis. Available:
http://www.law.uchicago.edu/files/files/20.Sykes_.Regression.pdf.
Last accessed 20th november 2011.
· American Marketing Association. (2011). Dictionary.
Available:
http://www.marketingpower.com/_layouts/Dictionary.aspx?dLetter=G.
Last accessed 11th July 2011.
· Anderson, W.T., Jr., Henion, K.E. & Cox III, E.P.
(1974). Socially vs. Ecologi-cally conscious consumers, Ameri-can Marketing
Association Com-bined ConferenceProceedings, 36 (Spring and Fall),
304-11.
· András Takács-Sánta, 2007.
Barriers to Environmental Concern. Human Ecology Review, Vol.
14, No. 1, 2007
· Andrew Gilg*, Stewart Barr, Nicholas Ford (2005)
Green consumption or sustainable lifestyles? Identifying the sustainable
consumer. Department of Geography, University of Exeter, Amory Building,
Rennes Drive, Exeter EX4 4RJ, UK Available online 25 January 2005
· Bang, H. K., Ellinger, A. E., Hadjimarcou, J., &
Traichal, P. A. (2000). Consumer concern, knowledge, belief, and attitude
toward renewable energy: An application of the reasoned action theory.
Psychology & Marketing, 17, 449- 468.
· Belle au naturel: rédaction. (2011). Où
en sommes-nous dans la Consommation « verte » ?!. Available:
http://www.belleaunaturel.net/ou-en-sommes-nous-dans-laconsommation-verte/.
Last accessed 20th november 2011
· Biswas, A., Licata, J.W., McKee, D., Pullig, C., &
Daughtridge, C. (2000). The Recycling Cycle: An Empirical Examination of
Consumer Waste Recycling and Recycling Shopping Behaviors. Advertising and
Environmental Issues, 19(1), p93-115.
· Booi-Chen TAN and Teck-Chai LAU. (2009). EXAMINING
SUSTAINABLE CONSUMPTION PATTERNS OF YOUNG CONSUMERS: IS THERE A CAUSE FOR
CONCERN?. The Journal of International Social Research. 2/9 (5)
· Bradbury, H., & Clair, J.A. (1999). Promoting
sustainable organizations with Sweden's Natural Step. Academy of Management
Executive. 1999, Vol. 13. No. 4, 13(4), 63-73.

· Castillo, Joan Joseph . (2009). NON-PROBABILITY
SAMPLING. Available:
http://www.experiment-resources.com/non-probability-sampling.html.
Last accessed 15th september 2011.
· Catherine Roche. (2009). What the `Green' Consumer
Wants. Available:
http://sloanreview.mit.edu/the-magazine/2009-summer/50415/what-the%E2%80%98green%E2%80%99-consumer-wants/.
Last accessed 20th July 2011.
· Cheryl D Hicks . (2011). It's Not Easy Buying Green.
Available:
http://www.europeanbusinessreview.com/?p=2834.
Last accessed 20th july 2011.
· Consumer Behavior», Journal of Social
Psychology, Volume 137, Issue 2, pp.189-204.
· Daniel Holzer. (2009). What Does Eco-Friendly Mean?.
Available:
http://greenliving.nationalgeographic.com/ecofriendly-mean-2415.html.
Last accessed 30th july 2011.
· David Wolinsky. (2011). Hidden Benefits, Challenges
in Selling a Green Product . Available:
http://www.nbcchicago.com/blogs/inc-well/The-Hidden-Benefits-andChallenges-in-Selling-a-Green-Product-125638353.html.
Last accessed 25th october 2011.
· Diana L. Haytko and Erika Matulich. (2007). Green
Advertising and Environmentally Responsible Consumer Behaviors: Linkages
Examined. Journal of Management and Marketing Researc,. 1 (7), 9.
· Dunlap, R. E. & Jones, R.E. (2002). Environmental
concern: conceptual and measurement issues.In: Handbook of Environmental
Sociology, R.E.Dunlap & W.Michelson (Eds.), (pp.482-524), Greenwood Press:
Westport,
· Dunlap, R. E., Van Liere, K. D., Mertig, A. G., &
Jones, R. E. (2000). New Trends in Measuring Environmental Attitudes: Measuring
endorsement of the New Ecological Paradigm: A revised NEP scale. Journal of
Social Issues, 56(3), 425-442.
· Eric Yergeau. (2007). Régression
linéaire simple. Available:
http://pages.usherbrooke.ca/spss/pages/statistiques-inferentielles/regressionlineaire.php.
Last accessed 5th September 2011.
· Eric Yergeau. (2009). Interprétation.
Available:
http://pages.usherbrooke.ca/spss/pages/statistiques-inferentielles/regressionlineaire/interpretation.php.
Last accessed 12th September
· FRÉDÉRIC BIANCHI. (2011). La crise n'a
pas eu raison du bio. Available:
http://www.lsaconso.fr/la-crise-n-a-pas-eu-raison-du-bio,120400.
Last accessed 2nd november 2011.
· Fryxell, G. E. & Lo, C.W. (2003). The Influence of
Environmental Knowledge and Values on Managerial Behaviours on Behalf of the
Environment, An Empirical Examination of

Managers in China. Journal of Business Ethics 46 (1),
45-69.
· Gilbert Saporta. (2009). Principes et Méthodes
de l'Analyse Conjointe. Available:
http://visionarymarketing.com/_repository/edf/analyseconjointe/saporta/analyseconjointegilbertsaporta.pdf.
Last accessed 20th november 2011.
· Gill, J.D., Crosby, L.A.& Taylor, J.R. (1986).
Ecological concern, attitudes, and social norms in voting behavior. Public
Opinion Quarterly, 50(4), 537-554.
· Grant, R. M. M.A. (2000). The Greening of Business : The
Role of Green Consumerism, the Limits of Earth, and Generation X, University of
Southern California, 1-128.
· Grunert, S. C. (1993). What's Green About Green Consumers
Besides Their Environmental Concern? 22nd Annual Conference of the European
Marketing Academy, 2.
· Hines, J. M., Hungerford, H. R., & Tomera, A. N.
(1986/87). Analysis and synthesis of research on environmental behavior. A
meta-analysis. Journal of Environmental Education, 18, 1-8.
· Hun Myoung Park, Ph.D.. (2008). Univariate Analysis
and Normality Test Using SAS, Stata, and SPSS. Available:
http://www.indiana.edu/~statmath/stat/all/normality/normality.pdf.
Last accessed 20th November 2011.
· Izabela Janecka. (2008). Green Purchasing.
Available:
http://www.eyeforprocurement.com/green/report.pdf.
Last accessed 9th November 2011.
· Jeff McIntire-Strasburg . (2009). 5 Products to Green
in Your Everyday Life. Available:
http://blog.sustainablog.org/2009/07/5-products-to-green-in-your-everyday-life/.
Last accessed 10th September 2011.
· Jenifer Grayson. (2010). Eco Etiquette: Are Women
Greener Than Men?. Available:
http://www.huffingtonpost.com/jennifer-grayson/eco-etiquette-are-womeng_b_605534.html.
Last accessed 25th
· Joe Manget, Catherine Roche, and Felix Münnich.
(2009). For Real, Not Just For Show. Available:
http://sloanreview.mit.edu/special-report/for-real-not-just-for-show/.
Last accessed 21th July 2011.
· Johan Jansson, Agneta Marell, Annika Nordlund, (2010)
"Green consumer behavior: determinants of curtailment and eco-innovation
adoption", Journal of Consumer Marketing, Vol. 27 Iss: 4, pp.358 - 370

· Ken Peattie. (2010). Green Consumption: Behavior and
Norms. Annual Review of Environment and Resources. Vol. 35: 195-228
(2), p2-3.
· Kim Harrison. (2011). Be ethical when promoting
'green' products and services . Available:
http://www.cuttingedgepr.com/articles/be-ethical-when-promotinggreen.asp.
Last accessed 10th November 2011.)
· Kinnear, Thomas and James Taylor (1973), «The Effect
of Ecological Concern on Brand Perceptions,» Journal of Marketing
Research, X, 191-197.
· Kinnear, Thomas, Taylor, James and Sadrudin Ahmed (1974),
«Ecologically Concerned Consumers: Who Are They?» Journal of
Marketing, 38, 20-24.
· Krause, D. (1993). Environmental Consciousness. An
Empirical Study. Environment and Behavior, 25(1), 126-142.
· L. Tucker (1980). Identifying the environmentally
responsible consumer: the role of internal-external control of
reinforcements. Journal of Consumer Affairs 14 (1980) 326- 340.
· Laerd Statistics. (2007). Linear Regression Analysis
using SPSS. Available:
http://statistics.laerd.com/spss-tutorials/linear-regression-using-spss-statistics.php.
Last accessed 10th September 2011.
· Laroche, M. et al. (2002). Cultural Differences in
Environmental Knowledge, Attitudes, and Behaviors of Canadian Consumers.
Canadian Journal of Administrative Sciences, 19(3), 267-283.
· Larry West. (2004). Top 10 Things You Can Do to
Reduce Global Warming. Available:
http://environment.about.com/od/globalwarming/tp/globalwarmtips.htm.
Last accessed 15th September 2011.
· Lars Perner. (1998). CONSUMER BEHAVIOR: THE
PSYCHOLOGY OF MARKETING. Available: http://www.consumerpsychologist.com/.
Last accessed 20th july 2011.
· Lois A. Mohr, Webb J. D., Harris K. E. (2001). Do
consumers expect companies to be social responsible? The impact of corporate
social responsibility on buying behavior. Available:
http://www.people.fas.harvard.edu/~hiscox/Mohr.pdf.
Last accessed 10th September 2011.
· M. Mcmilker. (2008). How to Reach Green Consumers -
Using Psychographics To Define Your Target Market Source: Ecopreneurist (
http://s.tt/12HCR).
Available:
http://ecopreneurist.com/2008/04/16/how-to-reach-green-consumers-usingpsychographics-to-define-your-target-market/.
Last accessed 20th November 2011.
· Mainieri, T., Barnett, E. G., Valdero, T. R., Unipan, J.
B., & Oskamp, S. (1997). Green buying: The influence of environmental
concern on consumer behavior. The Journal of

Social Psychology, 137, 189-204.
· Management Hub. (2011). Major Factors Influencing
Consumer Behavior. Available:
http://www.neilstoolbox.com/bibliography-creator/reference-website.htm#.
Last accessed 25th July 2011.
· Mark A. White. (2011). GREEN MARKETING .
Available:
http://www.referenceforbusiness.com/encyclopedia/Gov-Inc/Green-Marketing.html.
Last accessed 20th November 2011.
· Marquina P. (2007). Measuring the Impact of Corporate
Social Responsibility on Consumer Behavior: The Case of Peruvian Consumers.
Available:
http://www.revistaleadership.com/cladea/doctoral/coloquio_V/Marquina.pdf.
Last accessed 20th November 2011.
· Michaelyn Erickson. (2011). How Going Green Affects
Consumer Buying. Available:
http://www.ehow.com/about_6803367_going-green-affects-consumer-buying.html.
Last accessed 2nd August 2011.
· Ministry of environment of Korea. (2011). What is
Green Consumption?. Available:
http://eng.me.go.kr/content.do?method=moveContent&menuCode=res_cit_con_what
. Last accessed 12th august 2011.
· Neil Lessem and Ryan Vaughn . (2010). Image
Motivation in Green Consumption: An Investigation into the Determinants of
Demand for Green Electricity Products. Available:
http://s10.cgpublisher.com/proposals/39/index_html.
Last accessed 25th July 2011.
· O. Renaud et G. Pini. (2005). Introduction a
l'analyse exploratoire des données avec SPSS. Available:
http://tecfa.unige.ch/etu-maltt/maya/tio/stic/ex5/polycopelight.stat.pdf.
Last accessed 15th September 2011.
· Ottoman J (1994). Green Marketing: challenges and
opportunities for the new marketing age. London: McGraw-Hill/Contemporary.
88-100.
· Paul M Brown, Linda D Cameron; 1996; What can be done to
reduce overconsumption? Ecological Economics 32 (2000) 27-41
· Raphael Bemporad and Mitch Baranowski. (2007). BBMG
Conscious Consumer Report. Available:
http://www.fmi.org/docs/sustainability/BBMG_Conscious_Consumer_White_Paper.pdf
. Last accessed 20th July 2011.
· Richard Wilk. (2002). Consumption, human needs, and
global environmental change. Global Environmental Change. 12 (3),
p5-13.

· Ricky Y. K. Chan (2001) Determinants of Chinese
Consumers' Green Purchase Behavior. Psychology &Marketing. Vol. 18(4):
389-413 (April 2001)
· Sankar Sen and C.B. Bhattacharya . (2001). Does doing
good always lead to doing better? Consumers reactions to CSR. Available:
http://smgpublish.bu.edu/cb/jmr2001.pdf.
Last accessed 11th November 2011.
· Search CRM. (2007). What is green washing?.
Available:
http://searchcrm.techtarget.com/definition/greenwashing.
Last accessed 3rd august 2011.
· Shahn, J. & Holzer, E. (1990). Studies of individual
environmental concern the role of knowledge, gender and background variables.
Environment and Behavior, 22, (6), 767- 786.
· Shrum, L. J., McCarty, J. A., Lowrey, T. M. (1995). Buyer
Characteristics of the Green Consumer and Their Implications for Advertising
Strategy. Journal of Advertising, 24(2), 71-90
· Sophie Southern. (2010). How to Promote Green
Products. Available:
http://www.ehow.com/how_7550811_promote-green-products.html#ixzz1dyWTN7YY.
Last accessed 4th november 2011.
· Souad H'Mida. (2008). DETERMINANTS OF
PRO-ENVIRONMENTAL BEHAVIOURS WITHIN INDIVIDUAL CONSUMERS. Available:
http://www.up.edu.mx/files_uploads/15025_turkey.pdf.
Last accessed 12th october 2011.
· Statistical Sciences and Operations Research. (2010).
Simple Linear Regression in SPSS. Available:
http://www.stat.vcu.edu/help/SPSS/SPSS.Regression.PC.pdf.
Last accessed 6th september 2011.
· Straughan, R.D. & Roberts, J.A. (1999). Environmental
Segmentation Alternatives: A Look at Green Consumer Behavior in the New
Millennium. Journal of Consumer Marketing, 16(6), 558 - 575.
· Stella Giani. (2010). Les produits bio, verts et
équitables ne connaissent pas la crise !. Available:
http://www.bioaddict.fr/article/les-produits-bio-verts-et-equitables-neconnaissent-pas-la-crise-a535p4.html.
Last accessed 1st November 2011.
· Stern (2000) Towards a coherent theory of
environmentally significant behavior, journal of social issues, 56,
407-24
· Stewart Barr (2008). Environment and society:
sustainability, policy and the citizen. Cornwall: Ashgate Publishing
limited. p222-223.

· The good human. (2009). Can One Person Really
Make A Difference?. Available:
http://www.thegoodhuman.com/2009/09/14/can-one-person-really-make-adifference/.
Last accessed 25th July 2011
· Thomas P. Lyon and John W. Maxwell. (2008). Corporate
Social Responsibility and the Environment: A Theoretical Perspective.
Review of environmental economics and policy. 2 (5), p240-260.
· Tiffany Hsu. (2011). Skepticism grows over products
touted as eco-friendly. Available:
http://articles.latimes.com/2011/may/21/business/la-fi-greenwash-20110521.
Last accessed 25th July 2011.
· Tim Calkins . (2010). Why Green Products Don't Sell.
Available:
http://strongbrands.wordpress.com/2011/04/22/why-green-products
don%E2%80%99t-sell/. Last accessed 4th August 2011.
· Timothy McDaniels1,*, Lawrence J. Axelrod1, Paul Slovic
(1995) Characterizing Perception of Ecological Risk Volume 15, Issue 5, pages
575-588
· UCLA University. (2007). SPSS Annotated Output
Regression Analysis. Available:
http://www.ats.ucla.edu/stat/spss/output/reg_spss.htm.
Last accessed 11th September 2011.
· UCLA University. (2008). Correlation and Regression
SPSS. Available:
http://www.ats.ucla.edu/stat/spss/webbooks/reg/chapter1/spssreg1.htm.
Last accessed 3rd September 2011.
· United Nations. (1997). UN conference on environment
and development. Available:
http://www.un.org/geninfo/bp/enviro.html.
Last accessed 15th July 2011.
· William Young, Kumju Hwang, Seonaidh McDonald and
Caroline J. Oates. (2008). Sustainable consumption: green consumer
behaviour when purchasing products. Available:
http://www.idea.leeds.ac.uk/documents/Young.pdf.
Last accessed 25th October 2011.

Appendices I
Questionnaire sample
I. Personnal information
a. Gender
o Male
o Female
b. Age
|
|
|
|
o
|
18 -
|
25
|
|
o
|
26 -
|
35
|
|
o
|
36 -
|
45
|
|
o
|
46 -
|
50
|
|
o
|
50+
|
|
c. Situation
o Married o Divorced
o Single
o Other
d. Do you have Children ? o Yes
o No
e. What is your Place of living
o City center
o Country
o Suburbs
f. What is your level of Income (per month)
|
o
|
>1500
|
|
|
o
|
1500 -
|
2000
|
|
o
|
2000 -
|
2500
|
|
o
|
2500 -
|
3000
|
|
o
|
3000 -
|
4000
|
|
o
|
< 4000
|
|

g. What is your Level of education o High school
o Some College
o College degree (AS or BS) o Master degree and higher
h. What is you Socio-professional group?
o office employee
o worker in industry o Manager
o company owner o student
o corporate executive o self-employed
o other
i. What is your Employment status o Full time
o Part time
o Unemployed
j. Household size o 1 - 3 o 4 - 7 o 7+
II. Environmental conern ? / knowledge green
?
o How would you rate your knowledge about the ecology? (0 is you
don't know it
at all and 7 is you know it very well)

0 1 2 3 4 5 6 7
o If you don't know it well, what is ecology for you?
· natural product / healthy product / vegetarian / diet
/ without pesticide/respectful of the environment

o I feel concerned with environmental problems
? Strongly agree / agree / disagree / strongly disagree
o Today seriousness of environmental problem is exaggerated
? Strongly agree / agree / disagree / strongly disagree
III. Consumption of green products
o I'm aware of any products which are designed with environmental
issues ? Strongly agree / agree / disagree / strongly disagree
o I consider the effect on environment as a consumer before
purchasing ? Strongly agree / agree / disagree / strongly disagree
o I think that buying green help fighting against environmental
problems ? Strongly agree / agree / disagree / strongly disagree
o I think that companies develop sustainable product lines
primarily to attract new customers
? Strongly agree / agree / disagree / strongly disagree
o I prefer eating wealthy even if it's more expensive
? Strongly agree / agree / disagree / strongly disagree
o I will consider buying products because they are less
polluting
? Strongly agree / agree / disagree / strongly disagree
o I plan to switch to a green version of a product
? Strongly agree / agree / disagree / strongly disagree
o I will consider switching to other brands for ecological
reasons
? Strongly agree / agree / disagree / strongly disagree
o I have already consider or bought green products
? Strongly agree / agree / disagree / strongly disagree
o when buying green which criteria seem the most important? ?
health/environment/quality/efficiency/natural

o Where do you usually buy them?
· Supermarkets smaller retailers organic stores
· Farmer's market health food store internet
o What kind of products are you buying?
· Food / beauty / cleaning products
o If no, why ?
· reduced performance/don't trust/not aware/too
expensive/quality/other
IV. Consumption compatible cartridge
o How often are you buying cartridge?
· Less than every six month
· Every six month
· Every month
· More than every month
o How much are you spending for it?
· < 15€
· 16 - 20 €
· 21 - 25 €
· 26 - 30 €
· > 30€
o Generally, where are you buying it?
? Supermarkets / specialized shops / internet
o By choosing cartridge, what are the most important
criteria?
· Brand / quality / price / compatibility
o What is compatible cartridge for you?
· feat all printers/ecological/refilled/for inkjet and
laser
o Compatible cartridge can help to protect the environment
· Strongly agree / agree / disagree / strongly disagree
o Compatible cartridge are less polluting than standard
cartridge

? Strongly agree / agree / disagree / strongly disagree
o Compatible cartridge are less efficient than normal
cartridge
? Strongly agree / agree / disagree / strongly disagree
o Compatible cartridge are made of less quality than others
cartridges ? Strongly agree / agree / disagree / strongly disagree

Appendices II
Compatible cartridges results and analysis
Introduction
As the researcher was doing her internship in Pelikan France
SAS, the last part of the questionnaire was established in order to give the
company insights about the level of knowledge of consumers about the compatible
cartridges. Indeed, it is the most important source of revenue for the company.
However, Pelikan is essentially selling those products in a business to
business way; therefore the researcher has found interesting to assess the
knowledge and, eventually, the consumption of those products by b to c
consumers. This part permits to get information about the consumption of normal
cartridges and after that an assessment of consumers' knowledge about the
compatible cartridges.
Fig appendix 1 «How often are you buying
cartridges?»
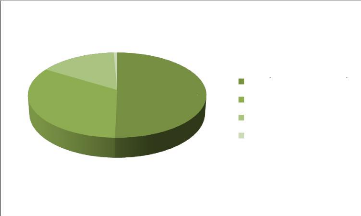
33%
16%
1%
50%
Less than every six month Every six month
Every month
More than every month
This question permits to get an overview of the frequency of
the consumption of cartridges. In that case, it appears that is not a regular
buying as 50% of the respondents are buying cartridges less than every six
months. Only 16% are buying this product every month. It is not really
surprising as it is not a buying of first necessity, and all the consumers are
not using their printers for the same purpose,

as a result some of them are going to consume much more
cartridges that the others.
Fig appendix 2 «How much are you spending for
it?»
|
< 30€
26 - 30 €
21 - 25 €
16 - 20
€
> 15€
|
|
0 10 20 30 40 50
This question permits the researcher to know if people are
paying attention to the price when they are buying cartridges or if the price
is less important. With the previous graphic it appears than the majority of
the respondents are spending less than 15 euros and between 21 to 25 euros for
those products. Obviously it seems that consumers tend to look for the best
value for money products when they are buying cartridges.

Fig appendix 3 «By choosing cartridges, what are the
most important criteria?»
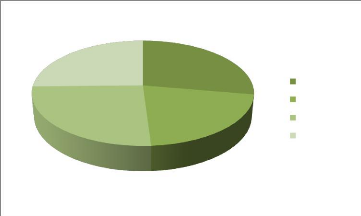
26% 21%
25%
28%
Brand
quality
price compatibility
This question has permitted to evaluate, what consumers are
looking for when they are buying cartridges. Firstly, it appears that the brand
is the most important criteria (28%). The researcher has found it logical as
generally only manufacturers' cartridges are working in a specific printer
(only compatible cartridges can work in replacement). The second one is the
price (26%), it is not surprising because due to the wide availability of
cartridges prices can vary a lot depending of the place of
Fig appendix 4 «What is compatible cartridge for
you?»
28%
feat all printers (all the different brands) ecological
refilled
for inkjet and laser
19%
20%
33%

This question was interesting because it permits to see for
the consumers what the compatible cartridges are. Firstly the researcher hasn't
given any definition before answering this question. So appears that for the
majority of the respondents, 33% of them, compatible cartridges are feasting
all the different types of printers. For 28% of the respondents of them it
means refilled cartridges (which is actually the good definition). So it
appears that the definition is of a compatible cartridge is not clear for a
large amount of the respondents.
Table Appendix 1
|
Question / Rating
|
1
|
2
|
3
|
4
|
5
|
Total
|
|
Compatible cartridge can help to protect the environment
|
10,1%
|
21,21%
|
39,4%
|
23,23%
|
6,06%
|
100%
|
|
Compatible cartridge are made of less quality than others
cartridges
|
10,1%
|
27,3%
|
37,4%
|
13,1%
|
12,1%
|
100%
|
|
Compatible cartridge are less polluting than standard
cartridge
|
18,2%
|
34,3%
|
33,3%
|
14,1%
|
0%
|
100%
|
|
Compatible cartridge are less efficient than normal cartridge
|
27,3%
|
27,3%
|
36,4%
|
8,1%
|
1,01%
|
100%
|
Those questions have permitted to assess the knowledge and
perception of this type of cartridges upon those who knew the definition of a
compatible cartridge. Firstly, we could observe that the impact of the
compatible cartridge on the environment is discussed through the respondents.
Indeed, it appears that the respondents are kind of septic upon this sentence,
because only 6,06% think that those cartridges permit to protect the
environment and the majority of the respondent disagree and have a neutral
opinion about the polluting level of those cartridges (34,4%).
However, even if the respondents don't think that those
cartridges could be
benefic for the environment, it clearly appears that
they trust the quality and
efficiency of this product. Indeed, even if
compatible cartridges are refilled

cartridges, it appears that only 12,1% think that those
cartridges are made of less quality. In addition, only 1,01% of the respondents
think that this product is less efficient that «normal» cartridge.
Conclusion
To resume it appears that compatible cartridges are not really
known by general public, as a significant part of respondents seem to don't
know it at all. Moreover, for those of who know what it is, it appears that,
some made ideas are still in mind of consumers, as in this sample a significant
part of respondents think that compatible are less efficient or made of less
quality. People are still septic about those products, even if the mentalities
against those products are evolving. Businesses which are commercializing those
kinds of products have to clearly explain why buying compatible cartridges
could be beneficial for the environment, in term of price or quality. It is
this last point that scares consumers. Indeed, as it is a recycled and refilled
cartridge they think that those cartridges are made of less quality and can
cause damages to their materials (printers etc.).

| 

