2.4. Data collection
After preparing the final draft of the questionnaire, 100
copies were produced and distributed by three undergraduate students from the
English department including the researcher. In order to sure the participants
understand the questions, the data
collectors paraphrased or translated the questions into
Tunisia Arabic sometimes. April 14th 2008, the ESC and the ISCAE
students were investigated. By April 15, 2008, students of the faculty of
Medicine Tunis and students of IPEIT and of the Faculty of Science Tunis were
covered too by the researcher and one of the above-mentioned colleagues.
Actually, the work went smoothly and there were no difficulties apart from
being obliged to enter some institutions secretly in order to investigate the
students, as the team had no official paper allowing them to enter such
institutions. When some officials in the visited institutions inhibited the
team from entering, students, who were very cooperative, were met in front of
their faculties.
2.5. Data handling
Because of lack of enough knowledge concerning statistics
packages, handling data was done manually by the researcher. Questionnaires
concerning each institution were separated and for each question, the answers
were counted and checked twice and thrice if the numbers exceeded or were less
than the total number of investigated students in each institution. The answers
collected from all students were transformed into five sets of tables each set
representing the data collected from each institution and each table contained
the answers to a particular question. Then, the five sets of tables were
gathered into one set of tables containing the answers collected from all the
institutions put together. The tables of the last set representing the total
answers collected from students were transformed into graphs using Microsoft
Excel. In the following chapter, the results will be discussed.
Chapter Three: Data analysis
3.0. Introduction
This chapter contains the results of the data collected from
the students and it aims at presenting all the percentages and figures of the
answers collected from the questionnaire item by item.
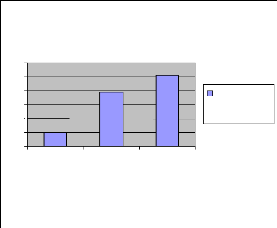
3.1. Science students' claimed proficiency in
English
The analysis of the questionnaire data indicates that
concerning the level of science students in English, which is retrieved from
their claimed marks, an important percentage of them could be classified as
`Good' since 44% of the investigated students said that they obtained more than
thirteen in their last exam. In fact, only 14% reported that they obtained less
than 7 out of twenty in their last exam as Figure 2 below indicates. Students
who obtained a mark between 8 and 12 represent 42% of the total students.
Figure 2: Categories of science students' reported
proficiency in English
14%

44%
42%
0-7
08-12 13-up

As a response to the question proposed in the questionnaire
that is «could you understand people speaking English in life or in an
authentic English film or TV program», which is summarised in figure 3
below, 52% of the students claimed they «miss few words at times» and
37% claimed they «have difficulties with understanding». 6% and 5%
are the percentages assigned respectively for «I
40
60
20
50
30
10
0
I can
Communicate perfectly
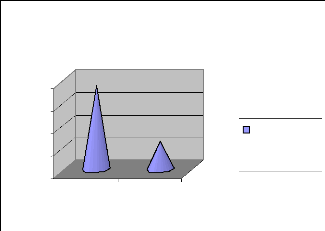
Figure 4: Ability to communicate only in English and
alternative solutions
10
Sometimes I
resort to
gestures
39
I resort to French if I can't express myself
51
Number of students and percentage
understand better British films than American films» and
«I understand every word they say». The mentioned figures are
illustrated in Figure 3 below.
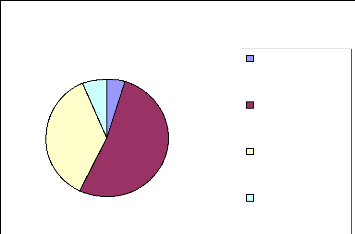
37%
Figure 3: Science students' claimed proficiency in
English
6%
5%
52%
I understand every word they say
I miss few words at times
I have difficulties with understanding
I understand better British films than American films
The ability of the students to communicate with someone using
only English which is reported in Figure 4, indicates that only 10% of them
report that they can «communicate perfectly» in comparison to 51% who
«resort to French if they can't express themselves. Those who
«sometimes resort to gestures» represent as high a percentage as 39%
of the investigated students.
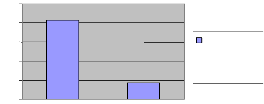
The results of the investigation of students' «choice of
language in favourite films», as it is reported in Figure 5 below, show
that 75% of them prefer the French version compared to the 25% favouring the
English version.
French version
English version
Figure 5: Choice of language in favorite
films
75
25
80
60
40
20
0
Number of students and percentage
Concerning students' use of French or English to look up
information on the internet or to download music, the results show that 83% of
the investigated students use French as language of the interface in comparison
to only 17% use English.
Figure 6: The language of the computer
interface
83
17
100
80
60
40
20
0
Number of students and percentage
French English
| 

