§ § § § § § § §
§ § § § § § § § § § §
ANNEXES
§ § § ABRÉVIATIONS DES VARIABLES
D'ÉTUDE
|
§ § AGE
|
§ : Age de l'individu
|
|
§ AGE2
|
§ : Age de l'individu au carré
|
|
§ ANC
|
§ : Ancienneté dans l'emploi actuellement
occupé
|
|
§ CATHOLIQUE
|
§ : Religion catholique
|
|
§ C
|
§ : Constante de l'estimation du modèle
|
|
§ EXPER
|
§ : Expérience professionnelle
|
|
§ EXPER2
|
§ : Expérience professionnelle au carré
|
|
§ LNREVENU
|
§ : Logarithme du revenu
|
|
§ MILRESID
|
§ : Milieu de résidence
|
|
§ MUSULMAN
|
§ : Religion musulmane
|
|
§ NBCONJCM
|
§ : Nombre de conjoints du chef de ménage
|
|
§ NETUDESTI
|
§ : Nombre d'année d'études
estimées
|
|
§ PRI
|
§ : Niveau d'études primaire
|
|
§ PROTESTANT
|
§ : Religion protestante
|
|
§ SPC
|
§ : Niveau d'études secondaire premier cycle
|
|
§ SSC
|
§ : Niveau d'études secondaire second cycle
|
|
§ STATMATRIM
|
§ : Statut matrimonial
|
|
§ STATMIGCM
|
§ : Statut migratoire
|
|
§ SUP
|
§ : Niveau d'études supérieur
|
|
§ TAILMENG
|
§ : Taille du ménage
|
|
§ TYPEDUC
|
§ : Type d'éducation reçu
|
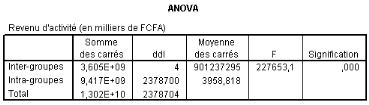
§ § § Tableau A1 :
Analyse de la variance du revenu en fonction du niveau
d'instruction
![]()
§ § Source :
INS, EESI 2005
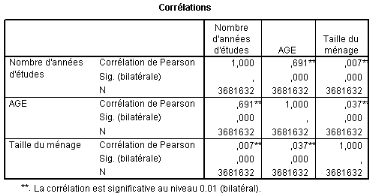
§ § Tableau A2 : Matrice
de corrélations entre le nombre d'années d'études,
l'âge de l'individu et la taille du ménage.
![]()
§ § Source :
INS, EESI 2005
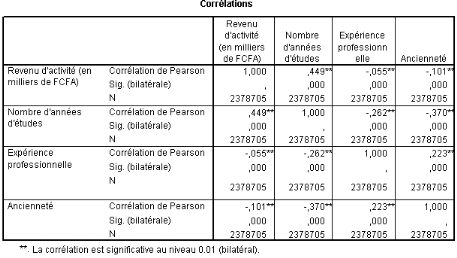
§ Tableau A3 : Matrice de
corrélations entre le revenu, le nombre d'années d'études,
l'expérience professionnelle et l'ancienneté.
![]()
§ § Source : INS, EESI
2005
§ § § § § § Tableau
A4 : Estimation de la fonction d'éducation suivant le
sexe masculin
|
§ Dependent Variable: ANETUDE
|
|
§ Method: Least Squares
|
|
§ Date: 03/21/08 Time: 06:12
|
|
§ Sample: 1 5819
|
|
§ Included observations: 5819
|
|
§ Variable
|
§ Coefficient
|
§ Std. Error
|
§ t-Statistic
|
§ Prob.
|
|
§ C
|
§ 2.734681
|
§ 0.180340
|
§ 15.16401
|
§ 0.0000
|
|
§ AGE
|
§ 0.392991
|
§ 0.005146
|
§ 76.36186
|
§ 0.0000
|
|
§ NBCONJCM
|
§ -0.203441
|
§ 0.058100
|
§ -3.501583
|
§ 0.0005
|
|
§ CATHOLIQUE
|
§ 0.437243
|
§ 0.122784
|
§ 3.561068
|
§ 0.0004
|
|
§ PROTESTANT
|
§ 0.473332
|
§ 0.128268
|
§ 3.690176
|
§ 0.0002
|
|
§ MUSULMAN
|
§ -0.558212
|
§ 0.138634
|
§ -4.026524
|
§ 0.0001
|
|
§ MILRESID
|
§ -0.866616
|
§ 0.069648
|
§ -12.44286
|
§ 0.0000
|
|
§ TAILMENG
|
§ 0.041949
|
§ 0.010845
|
§ 3.868191
|
§ 0.0001
|
|
§ STATMIGCM
|
§ -0.598770
|
§ 0.074374
|
§ -8.050786
|
§ 0.0000
|
|
§ R-squared
|
§ 0.543401
|
§ Mean dependent var
|
§ 7.169617
|
|
§ Adjusted R-squared
|
§ 0.542772
|
§ S.D. dependent var
|
§ 3.780902
|
|
§ S.E. of regression
|
§ 2.556595
|
§ Akaike info criterion
|
§ 4.716775
|
|
§ Sum squared resid
|
§ 37975.19
|
§ Schwarz criterion
|
§ 4.727089
|
|
§ Log likelihood
|
§ -13714.46
|
§ F-statistic
|
§ 864.3125
|
|
§ Durbin-Watson stat
|
§ 1.552999
|
§ Prob(F-statistic)
|
§ 0.000000
|
|
§ § § Tableau A5 :
Estimation de la fonction d'éducation suivant le sexe
feminin
|
§ Dependent Variable: ANETUDE
|
|
§ Method: Least Squares
|
|
§ Date: 03/21/08 Time: 06:42
|
|
§ Sample: 1 5194
|
|
§ Included observations: 5194
|
|
§ Variable
|
§ Coefficient
|
§ Std. Error
|
§ t-Statistic
|
§ Prob.
|
|
§ C
|
§ 3.506168
|
§ 0.181603
|
§ 19.30681
|
§ 0.0000
|
|
§ AGE
|
§ 0.360192
|
§ 0.005284
|
§ 68.16597
|
§ 0.0000
|
|
§ NBCONJCM
|
§ 0.019973
|
§ 0.065540
|
§ 0.304749
|
§ 0.7606
|
|
§ CATHOLIQUE
|
§ 0.167138
|
§ 0.134904
|
§ 1.238944
|
§ 0.2154
|
|
§ PROTESTANT
|
§ 0.313813
|
§ 0.140366
|
§ 2.235672
|
§ 0.0254
|
|
§ MUSULMAN
|
§ -1.066624
|
§ 0.157251
|
§ -6.782937
|
§ 0.0000
|
|
§ MILRESID
|
§ -0.984616
|
§ 0.063550
|
§ -15.49348
|
§ 0.0000
|
|
§ TAILMENG
|
§ 0.016027
|
§ 0.011789
|
§ 1.359480
|
§ 0.1741
|
|
§ STATMIGCM
|
§ -0.441856
|
§ 0.081515
|
§ -5.420556
|
§ 0.0000
|
|
§ R-squared
|
§ 0.535010
|
§ Mean dependent var
|
§ 7.305545
|
|
§ Adjusted R-squared
|
§ 0.534293
|
§ S.D. dependent var
|
§ 3.825988
|
|
§ S.E. of regression
|
§ 2.610959
|
§ Akaike info criterion
|
§ 4.759044
|
|
§ Sum squared resid
|
§ 35346.71
|
§ Schwarz criterion
|
§ 4.770403
|
|
§ Log likelihood
|
§ -12350.24
|
§ F-statistic
|
§ 745.7229
|
|
§ Durbin-Watson stat
|
§ 1.557862
|
§ Prob(F-statistic)
|
§ 0.000000
|
|
§ § § § § § Tableau
A6 : Estimation de la fonction d'éducation
|
§ Dependent Variable: ANETUDE
|
|
§ Method: Least Squares
|
|
§ Date: 02/22/08 Time: 11:42
|
|
§ Sample: 1 11013
|
|
§ Included observations: 11013
|
|
§ Variable
|
§ Coefficient
|
§ Std. Error
|
§ t-Statistic
|
§ Prob.
|
|
§ C
|
§ 3.307001
|
§ 0.131662
|
§ 25.11730
|
§ 0.0000
|
|
§ AGE
|
§ 0.376161
|
§ 0.003681
|
§ 102.1800
|
§ 0.0000
|
|
§ NBCONJCM
|
§ -0.088226
|
§ 0.043481
|
§ -2.029049
|
§ 0.0425
|
|
§ CATHOLIQUE
|
§ 0.311250
|
§ 0.090880
|
§ 3.424858
|
§ 0.0006
|
|
§ PROTESTANT
|
§ 0.398521
|
§ 0.094784
|
§ 4.204506
|
§ 0.0000
|
|
§ MUSULMAN
|
§ -0.806791
|
§ 0.104113
|
§ -7.749200
|
§ 0.0000
|
|
§ MILRESID
|
§ -1.030943
|
§ 0.051551
|
§ -19.99855
|
§ 0.0000
|
|
§ TAILMENG
|
§ 0.028013
|
§ 0.007990
|
§ 3.506153
|
§ 0.0005
|
|
§ STATMIGCM
|
§ -0.527709
|
§ 0.054990
|
§ -9.596379
|
§ 0.0000
|
|
§ R-squared
|
§ 0.537899
|
§ Mean dependent var
|
§ 7.233724
|
|
§ Adjusted R-squared
|
§ 0.537563
|
§ S.D. dependent var
|
§ 3.802665
|
|
§ S.E. of regression
|
§ 2.585916
|
§ Akaike info criterion
|
§ 4.738854
|
|
§ Sum squared resid
|
§ 73583.34
|
§ Schwarz criterion
|
§ 4.744825
|
|
§ Log likelihood
|
§ -26085.50
|
§ F-statistic
|
§ 1601.120
|
|
§ Durbin-Watson stat
|
§ 1.368338
|
§ Prob(F-statistic)
|
§ 0.000000
|
§ § § § § § § §
§ § § § § § § § § § §
§ § § Tableau A7 : Estimation de la fonction
de gains par les MCO
|
§ Dependent Variable: LNREVENU
|
|
§ Method: Least Squares
|
|
§ Date: 02/27/08 Time: 19:47
|
|
§ Sample: 1 458
|
|
§ Included observations: 458
|
|
§ Variable
|
§ Coefficient
|
§ Std. Error
|
§ t-Statistic
|
§ Prob.
|
|
§ C
|
§ 9.074620
|
§ 0.199679
|
§ 45.44613
|
§ 0.0000
|
|
§ NETUDESTI
|
§ 0.085143
|
§ 0.013286
|
§ 6.408301
|
§ 0.0000
|
|
§ SEXE
|
§ 0.365596
|
§ 0.084912
|
§ 4.305577
|
§ 0.0000
|
|
§ STATMATRIM
|
§ -0.167957
|
§ 0.111412
|
§ -1.507529
|
§ 0.1324
|
|
§ EXPER
|
§ 0.037909
|
§ 0.029270
|
§ 1.295127
|
§ 0.1959
|
|
§ EXPRER2
|
§ -0.002345
|
§ 0.001742
|
§ -1.346172
|
§ 0.1789
|
|
§ ANC
|
§ 0.015142
|
§ 0.011097
|
§ 1.364467
|
§ 0.1731
|
|
§ TYPEDUC
|
§ -0.098571
|
§ 0.087774
|
§ -1.123013
|
§ 0.2620
|
|
§ R-squared
|
§ 0.128129
|
§ Mean dependent var
|
§ 10.03969
|
|
§ Adjusted R-squared
|
§ 0.114567
|
§ S.D. dependent var
|
§ 0.921164
|
|
§ S.E. of regression
|
§ 0.866792
|
§ Akaike info criterion
|
§ 2.569279
|
|
§ Sum squared resid
|
§ 338.0981
|
§ Schwarz criterion
|
§ 2.641364
|
|
§ Log likelihood
|
§ -580.3648
|
§ F-statistic
|
§ 9.447338
|
|
§ Durbin-Watson stat
|
§ 1.895379
|
§ Prob(F-statistic)
|
§ 0.000000
|
§ Tableau A8 : Estimation de la
fonction de gains par les DMC
|
§ Dependent Variable: LNREVENU
|
|
§ Method: Least Squares
|
|
§ Date: 02/23/08 Time: 11:58
|
|
§ Sample: 1 458
|
|
§ Included observations: 458
|
|
§ Variable
|
§ Coefficient
|
§ Std. Error
|
§ t-Statistic
|
§ Prob.
|
|
§ C
|
§ 8.126517
|
§ 0.287037
|
§ 28.31172
|
§ 0.0000
|
|
§ NETUDESTI
|
§ 0.125604
|
§ 0.017008
|
§ 7.384876
|
§ 0.0000
|
|
§ SEXE
|
§ 0.491577
|
§ 0.085729
|
§ 5.734051
|
§ 0.0000
|
|
§ STATMATRIM
|
§ 0.181827
|
§ 0.117437
|
§ 1.548302
|
§ 0.1223
|
|
§ EXPER
|
§ 0.014085
|
§ 0.028357
|
§ 0.496703
|
§ 0.6196
|
|
§ EXPRER2
|
§ -0.002311
|
§ 0.001714
|
§ -1.348420
|
§ 0.1782
|
|
§ ANC
|
§ -0.009401
|
§ 0.011588
|
§ -0.811293
|
§ 0.4176
|
|
§ TYPEDUC
|
§ -0.000613
|
§ 0.088480
|
§ -0.006928
|
§ 0.9945
|
|
§ R-squared
|
§ 0.151406
|
§ Mean dependent var
|
§ 10.03969
|
|
§ Adjusted R-squared
|
§ 0.138206
|
§ S.D. dependent var
|
§ 0.921164
|
|
§ S.E. of regression
|
§ 0.855143
|
§ Akaike info criterion
|
§ 2.542218
|
|
§ Sum squared resid
|
§ 329.0716
|
§ Schwarz criterion
|
§ 2.614303
|
|
§ Log likelihood
|
§ -574.1679
|
§ F-statistic
|
§ 11.46985
|
|
§ Durbin-Watson stat
|
§ 1.639674
|
§ Prob(F-statistic)
|
§ 0.000000
|
§ Source :
INS, EESI 2005
§ Tableau A9 : Test de Hausman
d'exogénéité de l'éducation
|
§ r"
|
§ r'
|
§ V(r'')
|
§ V(r')
|
§ H
|
§ ÷1 2au seuil de 5%
|
|
§ 0,08514
|
§ 0,12560
|
§ 0,0001765
|
§ 0,0002892
|
§ 14,5254*
|
§ 3,841
|
§ *Résultat donné en valeur absolue
§ Source : INS, EESI
2005
§ Tableau A10 : Estimation de la
fonction de gains dans le secteur informel
|
§ Dependent Variable: LNREVENU
|
|
§ Method: Least Squares
|
|
§ Date: 02/22/08 Time: 23:43
|
|
§ Sample: 1 388
|
|
§ Included observations: 388
|
|
§ Variable
|
§ Coefficient
|
§ Std. Error
|
§ t-Statistic
|
§ Prob.
|
|
§ C
|
§ 8.194635
|
§ 0.305369
|
§ 26.83518
|
§ 0.0000
|
|
§ NETUDESTI
|
§ 0.104518
|
§ 0.018562
|
§ 5.630659
|
§ 0.0000
|
|
§ SEXE
|
§ 0.490743
|
§ 0.091234
|
§ 5.378967
|
§ 0.0000
|
|
§ STATMATRIM
|
§ 0.201946
|
§ 0.122377
|
§ 1.650200
|
§ 0.0997
|
|
§ EXPER
|
§ 0.054677
|
§ 0.029946
|
§ 1.825853
|
§ 0.0687
|
|
§ EXPRER2
|
§ -0.004378
|
§ 0.001830
|
§ -2.392896
|
§ 0.0172
|
|
§ ANC
|
§ -0.017504
|
§ 0.012202
|
§ -1.434556
|
§ 0.1522
|
|
§ TYPEDUC
|
§ -0.026839
|
§ 0.093156
|
§ -0.288107
|
§ 0.7734
|
|
§ R-squared
|
§ 0.126038
|
§ Mean dependent var
|
§ 9.892423
|
|
§ Adjusted R-squared
|
§ 0.109939
|
§ S.D. dependent var
|
§ 0.879524
|
|
§ S.E. of regression
|
§ 0.829770
|
§ Akaike info criterion
|
§ 2.485066
|
|
§ Sum squared resid
|
§ 261.6368
|
§ Schwarz criterion
|
§ 2.566736
|
|
§ Log likelihood
|
§ -474.1028
|
§ F-statistic
|
§ 7.828810
|
|
§ Durbin-Watson stat
|
§ 1.882490
|
§ Prob(F-statistic)
|
§ 0.000000
|
§
§ Tableau A11 : Estimation de la
fonction de gains dans le secteur formel
|
§ Dependent Variable: LNREVENU
|
|
§ Method: Least Squares
|
|
§ Date: 02/22/08 Time: 23:41
|
|
§ Sample: 1 70
|
|
§ Included observations: 70
|
|
§ Variable
|
§ Coefficient
|
§ Std. Error
|
§ t-Statistic
|
§ Prob.
|
|
§ C
|
§ 10.08527
|
§ 0.599008
|
§ 16.83663
|
§ 0.0000
|
|
§ NETUDESTI
|
§ 0.058066
|
§ 0.033451
|
§ 1.735873
|
§ 0.0876
|
|
§ SEXE
|
§ 0.131159
|
§ 0.163757
|
§ 0.800939
|
§ 0.4262
|
|
§ STATMATRIM
|
§ 0.024901
|
§ 0.271670
|
§ 0.091661
|
§ 0.9273
|
|
§ EXPER
|
§ -0.078856
|
§ 0.056074
|
§ -1.406299
|
§ 0.1646
|
|
§ EXPRER2
|
§ 0.003914
|
§ 0.003123
|
§ 1.253029
|
§ 0.2149
|
|
§ ANC
|
§ 0.049309
|
§ 0.026105
|
§ 1.888899
|
§ 0.0636
|
|
§ TYPEDUC
|
§ -0.171799
|
§ 0.174242
|
§ -0.985977
|
§ 0.3280
|
|
§ R-squared
|
§ 0.272071
|
§ Mean dependent var
|
§ 10.85600
|
|
§ Adjusted R-squared
|
§ 0.189885
|
§ S.D. dependent var
|
§ 0.695281
|
|
§ S.E. of regression
|
§ 0.625797
|
§ Akaike info criterion
|
§ 2.007630
|
|
§ Sum squared resid
|
§ 24.28058
|
§ Schwarz criterion
|
§ 2.264601
|
|
§ Log likelihood
|
§ -62.26705
|
§ F-statistic
|
§ 3.310443
|
|
§ Durbin-Watson stat
|
§ 1.476065
|
§ Prob(F-statistic)
|
§ 0.004672
|
§
§ § § § Tableau A12 :
Rendement des niveaux d'éducation dans l'ensemble du
marché
|
§ Dependent Variable: LNREVENU
|
|
§ Method: Least Squares
|
|
§ Date: 03/20/08 Time: 19:03
|
|
§ Sample: 1 6894
|
|
§ Included observations: 6894
|
|
§ Variable
|
§ Coefficient
|
§ Std. Error
|
§ t-Statistic
|
§ Prob.
|
|
§ C
|
§ 7.875408
|
§ 0.093828
|
§ 83.93437
|
§ 0.0000
|
|
§ AGE
|
§ 0.088975
|
§ 0.004624
|
§ 19.24123
|
§ 0.0000
|
|
§ AGE2
|
§ -0.000927
|
§ 5.25E-05
|
§ -17.65869
|
§ 0.0000
|
|
§ EXPER
|
§ -0.012881
|
§ 0.003212
|
§ -4.010586
|
§ 0.0001
|
|
§ EXPER2
|
§ 0.000124
|
§ 6.67E-05
|
§ 1.861980
|
§ 0.0626
|
|
§ ANCI
|
§ -0.006339
|
§ 0.001642
|
§ -3.861008
|
§ 0.0001
|
|
§ STATMATRI
|
§ 0.159560
|
§ 0.024264
|
§ 6.575896
|
§ 0.0000
|
|
§ PRI
|
§ 0.311878
|
§ 0.036395
|
§ 8.569305
|
§ 0.0000
|
|
§ SPC
|
§ 0.710282
|
§ 0.040055
|
§ 17.73254
|
§ 0.0000
|
|
§ SSC
|
§ 1.216964
|
§ 0.045243
|
§ 26.89813
|
§ 0.0000
|
|
§ SUP
|
§ 1.980148
|
§ 0.054286
|
§ 36.47608
|
§ 0.0000
|
|
§ R-squared
|
§ 0.320566
|
§ Mean dependent var
|
§ 10.35329
|
|
§ Adjusted R-squared
|
§ 0.319579
|
§ S.D. dependent var
|
§ 1.141999
|
|
§ S.E. of regression
|
§ 0.942008
|
§ Akaike info criterion
|
§ 2.719988
|
|
§ Sum squared resid
|
§ 6107.830
|
§ Schwarz criterion
|
§ 2.730900
|
|
§ Log likelihood
|
§ -9364.800
|
§ F-statistic
|
§ 324.7487
|
|
§ Durbin-Watson stat
|
§ 1.667254
|
§ Prob(F-statistic)
|
§ 0.000000
|
|
§ §
§ Tableau A13 : Rendement des niveaux
d'éducation dans le secteur formel
|
§ Dependent Variable: LNREVENU
|
|
§ Method: Least Squares
|
|
§ Date: 03/20/08 Time: 18:58
|
|
§ Sample: 1 1463
|
|
§ Included observations: 1463
|
|
§ Variable
|
§ Coefficient
|
§ Std. Error
|
§ t-Statistic
|
§ Prob.
|
|
§ C
|
§ 8.141769
|
§ 0.271398
|
§ 29.99934
|
§ 0.0000
|
|
§ AGE
|
§ 0.103391
|
§ 0.012491
|
§ 8.277275
|
§ 0.0000
|
|
§ AGE2
|
§ -0.000984
|
§ 0.000151
|
§ -6.533438
|
§ 0.0000
|
|
§ EXPER
|
§ -0.000945
|
§ 0.004927
|
§ -0.191716
|
§ 0.8480
|
|
§ EXPER2
|
§ 3.07E-05
|
§ 7.99E-05
|
§ 0.383920
|
§ 0.7011
|
|
§ ANCI
|
§ 0.010543
|
§ 0.003688
|
§ 2.858851
|
§ 0.0043
|
|
§ STATMATRI
|
§ 0.157929
|
§ 0.040591
|
§ 3.890756
|
§ 0.0001
|
|
§ PRI
|
§ 0.182894
|
§ 0.136302
|
§ 1.341829
|
§ 0.1799
|
|
§ SPC
|
§ 0.464945
|
§ 0.134260
|
§ 3.463018
|
§ 0.0005
|
|
§ SSC
|
§ 0.757239
|
§ 0.133667
|
§ 5.665104
|
§ 0.0000
|
|
§ SUP
|
§ 1.294287
|
§ 0.134725
|
§ 9.606893
|
§ 0.0000
|
|
§ R-squared
|
§ 0.412218
|
§ Mean dependent var
|
§ 11.47118
|
|
§ Adjusted R-squared
|
§ 0.408169
|
§ S.D. dependent var
|
§ 0.857151
|
|
§ S.E. of regression
|
§ 0.659411
|
§ Akaike info criterion
|
§ 2.012550
|
|
§ Sum squared resid
|
§ 631.3622
|
§ Schwarz criterion
|
§ 2.052311
|
|
§ Log likelihood
|
§ -1461.180
|
§ F-statistic
|
§ 101.8302
|
|
§ Durbin-Watson stat
|
§ 1.745510
|
§ Prob(F-statistic)
|
§ 0.000000
|
|
§ §
§ § Tableau A14 : Rendement des
niveaux d'éducation dans le secteur informel
|
§ Dependent Variable: LNREVENU
|
|
§ Method: Least Squares
|
|
§ Date: 03/20/08 Time: 18:53
|
|
§ Sample: 1 5431
|
|
§ Included observations: 5431
|
|
§ Variable
|
§ Coefficient
|
§ Std. Error
|
§ t-Statistic
|
§ Prob.
|
|
§ C
|
§ 8.388880
|
§ 0.099626
|
§ 84.20410
|
§ 0.0000
|
|
§ AGE
|
§ 0.067537
|
§ 0.004884
|
§ 13.82784
|
§ 0.0000
|
|
§ AGE2
|
§ -0.000730
|
§ 5.50E-05
|
§ -13.26776
|
§ 0.0000
|
|
§ EXPER
|
§ -0.012353
|
§ 0.003744
|
§ -3.299013
|
§ 0.0010
|
|
§ EXPER2
|
§ 0.000128
|
§ 8.42E-05
|
§ 1.519367
|
§ 0.1287
|
|
§ ANCI
|
§ -0.005323
|
§ 0.001738
|
§ -3.063231
|
§ 0.0022
|
|
§ STATMATRI
|
§ 0.087586
|
§ 0.026972
|
§ 3.247296
|
§ 0.0012
|
|
§ PRI
|
§ 0.239919
|
§ 0.037324
|
§ 6.428011
|
§ 0.0000
|
|
§ SPC
|
§ 0.543835
|
§ 0.042351
|
§ 12.84104
|
§ 0.0000
|
|
§ SSC
|
§ 0.858084
|
§ 0.053723
|
§ 15.97238
|
§ 0.0000
|
|
§ SUP
|
§ 1.299595
|
§ 0.093867
|
§ 13.84508
|
§ 0.0000
|
|
§ R-squared
|
§ 0.140822
|
§ Mean dependent var
|
§ 10.05216
|
|
§ Adjusted R-squared
|
§ 0.139237
|
§ S.D. dependent var
|
§ 1.015049
|
|
§ S.E. of regression
|
§ 0.941736
|
§ Akaike info criterion
|
§ 2.719839
|
|
§ Sum squared resid
|
§ 4806.814
|
§ Schwarz criterion
|
§ 2.733207
|
|
§ Log likelihood
|
§ -7374.723
|
§ F-statistic
|
§ 88.83552
|
|
§ Durbin-Watson stat
|
§ 1.641915
|
§ Prob(F-statistic)
|
§ 0.000000
|
|
|
|
|
|
§ § § § § § § Tableau
A15 : Rendement des niveaux d'éducation chez les
travailleurs dépendants
|
§ Dependent Variable: LNREVENU
|
|
§ Method: Least Squares
|
|
§ Date: 03/20/08 Time: 18:43
|
|
§ Sample: 1 2812
|
|
§ Included observations: 2812
|
|
§ Variable
|
§ Coefficient
|
§ Std. Error
|
§ t-Statistic
|
§ Prob.
|
|
§ C
|
§ 7.362814
|
§ 0.157543
|
§ 46.73514
|
§ 0.0000
|
|
§ AGE
|
§ 0.110729
|
§ 0.008380
|
§ 13.21303
|
§ 0.0000
|
|
§ AGE2
|
§ -0.001085
|
§ 0.000107
|
§ -10.17633
|
§ 0.0000
|
|
§ EXPER
|
§ -0.005646
|
§ 0.004611
|
§ -1.224440
|
§ 0.2209
|
|
§ EXPER2
|
§ 6.77E-05
|
§ 0.000110
|
§ 0.612434
|
§ 0.5403
|
|
§ ANCI
|
§ 0.007982
|
§ 0.003305
|
§ 2.414744
|
§ 0.0158
|
|
§ STATMATRI
|
§ 0.159647
|
§ 0.033458
|
§ 4.771589
|
§ 0.0000
|
|
§ PRI
|
§ 0.513496
|
§ 0.067950
|
§ 7.556946
|
§ 0.0000
|
|
§ SPC
|
§ 0.880508
|
§ 0.068487
|
§ 12.85655
|
§ 0.0000
|
|
§ SSC
|
§ 1.261762
|
§ 0.070636
|
§ 17.86292
|
§ 0.0000
|
|
§ SUP
|
§ 1.875227
|
§ 0.074710
|
§ 25.10021
|
§ 0.0000
|
|
§ R-squared
|
§ 0.464946
|
§ Mean dependent var
|
§ 10.84779
|
|
§ Adjusted R-squared
|
§ 0.463035
|
§ S.D. dependent var
|
§ 1.048139
|
|
§ S.E. of regression
|
§ 0.768054
|
§ Akaike info criterion
|
§ 2.313991
|
|
§ Sum squared resid
|
§ 1652.330
|
§ Schwarz criterion
|
§ 2.337233
|
|
§ Log likelihood
|
§ -3242.471
|
§ F-statistic
|
§ 243.3981
|
|
§ Durbin-Watson stat
|
§ 1.658266
|
§ Prob(F-statistic)
|
§ 0.000000
|
|
§ §
§ § § Tableau A16 : Rendement
des niveaux d'éducation chez les travailleurs
indépendants
|
§ Dependent Variable: LNREVENU
|
|
§ Method: Least Squares
|
|
§ Date: 03/20/08 Time: 18:32
|
|
§ Sample: 1 4082
|
|
§ Included observations: 4082
|
|
§ Variable
|
§ Coefficient
|
§ Std. Error
|
§ t-Statistic
|
§ Prob.
|
|
§ C
|
§ 8.337980
|
§ 0.124307
|
§ 67.07588
|
§ 0.0000
|
|
§ AGE
|
§ 0.067140
|
§ 0.005846
|
§ 11.48463
|
§ 0.0000
|
|
§ AGE2
|
§ -0.000737
|
§ 6.37E-05
|
§ -11.56068
|
§ 0.0000
|
|
§ EXPER
|
§ -0.009847
|
§ 0.004161
|
§ -2.366819
|
§ 0.0180
|
|
§ EXPER2
|
§ 0.000123
|
§ 8.30E-05
|
§ 1.480211
|
§ 0.1389
|
|
§ ANCI
|
§ -0.002477
|
§ 0.001946
|
§ -1.272739
|
§ 0.2032
|
|
§ STATMATRI
|
§ 0.123095
|
§ 0.032455
|
§ 3.792842
|
§ 0.0002
|
|
§ PRI
|
§ 0.205282
|
§ 0.043164
|
§ 4.755829
|
§ 0.0000
|
|
§ SPC
|
§ 0.522441
|
§ 0.050428
|
§ 10.36005
|
§ 0.0000
|
|
§ SSC
|
§ 0.911936
|
§ 0.066205
|
§ 13.77444
|
§ 0.0000
|
|
§ SUP
|
§ 1.634647
|
§ 0.113094
|
§ 14.45389
|
§ 0.0000
|
|
§ R-squared
|
§ 0.147156
|
§ Mean dependent var
|
§ 10.01265
|
|
§ Adjusted R-squared
|
§ 0.145061
|
§ S.D. dependent var
|
§ 1.077737
|
|
§ S.E. of regression
|
§ 0.996507
|
§ Akaike info criterion
|
§ 2.833570
|
|
§ Sum squared resid
|
§ 4042.610
|
§ Schwarz criterion
|
§ 2.850586
|
|
§ Log likelihood
|
§ -5772.316
|
§ F-statistic
|
§ 70.24421
|
|
§ Durbin-Watson stat
|
§ 1.651489
|
§ Prob(F-statistic)
|
§ 0.000000
|
|
|
|
|
§ § § § § § § §
| 

