4.4 Environmental Health Hazards
Table 18 in Appendix A and Figure 11 present a synopsis of the
results by health hazard included in the model. As can be seen, waste
pollution portrays the factor whose severity reaches the greatest physical
extent, 53.4% of high and very high risks. Following this were pollution from
streams (49.1%), high density housing (45.7%), and traffic (42.1%) (Table 18,
Appendix A). The ranking of six factors coincides both for the percent of area
covered and the proportion of area at high and very high risks. This would
indicate a strong association between the physical extent of the factors and
their perceived strength. Indeed the correlation coefficient between these two
outputs exceeds 0.98. Correlation between EOW and Own weights over these two
results was also tested. This yielded to a coefficient of regression
(R2) of 41% (Table 20, Appendix A) and 33% (Table 21, Appendix A)
when running successively single regressions of the EOW (column 2, Table 19)
and the own weighting (column 3, Table 19) over the proportion of high/very
high risk areas (column 6, Table 18). For both regressions the t-statistic was
insignificant at 95% confidence limits and the p values significantly greater
than zero. This result would suggest that the weight assigned by the experts
had little to do with the perceived strength of these hazards. Similarly, when
we ran a regression with the percent of study area covered by each factor
(column 4, Table 19) as independent variable, correlations of 46% and 35% were
found respectively for EOW and Own weighting with the t-statistic significant
and p values acceptably low (close to zero) (see regression results in Tables
22 & 23, Appendix A). This would signify that the experts' judgment and our
perception were more correlated to the physical extent of health hazards, which
can be more easily quantified, than the perceived influence of those hazards.
Although the participants in the expert opinion survey were not cautioned to
provide their rankings based on the physical occurrence of these hazards, this
result implies that this characteristic had to a certain extent influenced the
weight the respondents attributed. Consequently, the experts did a better job
than us in ranking the factors.
If we were to average the results obtained by individual factor,
52% of the study area would be at risk at all levels, of which 47% at high and
very high risk. However, what these percentages did not unveil is the
population exposed, though housing density is an unambiguous surrogate of
population. Applying the 47% rate on the total population would be misleading
since the areas at high risk are also the most populated. Not only are
locations with high and very high housing density inherently exposed to high
risks, the superimposition of low and moderate housing density areas to any
other hazards where the vulnerability is high induces a high risk for the
populations living in these areas. This was one of the issues the maximum
approach attempted to address. Endless combinations could be done to put in
evidence the severity of health risks in the study area. But for now, let's
look at individual hazards and their associated risk levels.
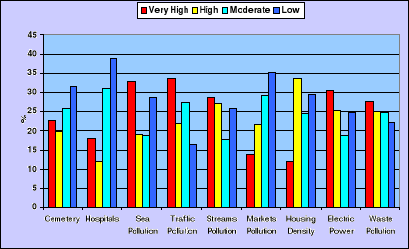
Figure 11: Factors
affecting environmental health in Port-au-Prince.
Percent of area by risk level
4.4.1 Traffic Pollution
Vehicle traffic forms a major source of indoor and outdoor air
pollution in the study area. It is due to high population density that exposes
both, to an increasing number of public and private vehicles using road
surfaces not designed for this volume of traffic, and to the disorganized
development of informal commercial activities which take over the streets. In
addition to these environmental and physical settings, conditions of
maintenance, regulation, and controls of the vehicle fleet exacerbates
pollution. Nevertheless there is no obvious sign of concern either from the
exposed population or from the entities in charge of the environment and
traffic regulation and management, or again public and private organizations
promoting health.
As displayed on Table 18 in Appendix A, about 76% percent of the
area was found exposed to low to very high pollution risks. Neighborhoods with
high and very high risks accounts for 42% of the study area while low and
moderate risk amount to 13% and 21% respectively. The north-northeast section
of the map displayed in Figure 12 makes abstraction of high traffic activities
in some sections of Delmas Road adjacent to the border of Port-au-Prince. Only
when Delmas Road intersects or crosses the border of the study area risks
originated from this road appeared in the analysis. Nevertheless, most of this
boundary section was found prone to high risk from traffic pollution.
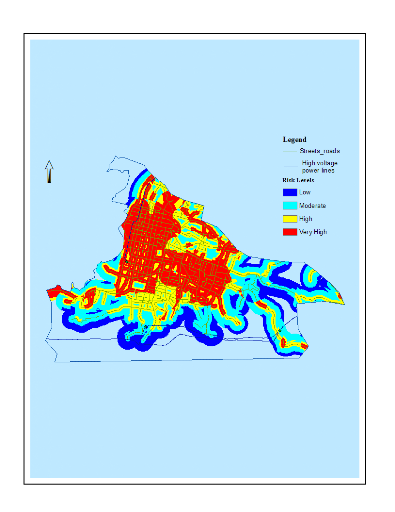
Figure 12: Risks of traffic
pollution in Port-au-Prince
| 

