5.5.3. The data
modelling
The data model presents the logical organization of data
without indicating how the data are stored, created, or manipulated. Entity
relationship (ER) diagram will be used for the data model.(Dennis et al.,
2012)The database modelling approach in the study, will be based on the three
main phases of the database design methodology: conceptual, logical, and
physical database design.
Conceptual data design
The conceptual data design is the process of constructing a
model of the data independent of all physical considerations. This process
involve building the first ER diagram based on the functional requirements. The
following steps are used in the conceptual data modelling: (CONNOLLY &
BEGG, 2005)
§ Entity identification: In this step, we have identified
the main objects that the users are interested in, based on business and
functional requirements. The attributes of each entity are also identified.
§ Attribute domain determination: A domain is a pool of
values for an attributes. The objective of this step is to determine domains
for all the attributes in the model. Simple, composite, single, multi-valued,
and derived attributes are also identified.
§ Relationship identification: we search for the
relationship that exist between entities and we determine the cardinality
constraints for each relationship. The cardinality constraints are used to
check and maintain data quality since it precises how many instances of each
entity participate in the relationship.
§ Design the first ER diagram showing entity and their
relationship
The figure 3.15 below shows the first ER diagram. The
different attributes of the entities are listed in the table 3.3.
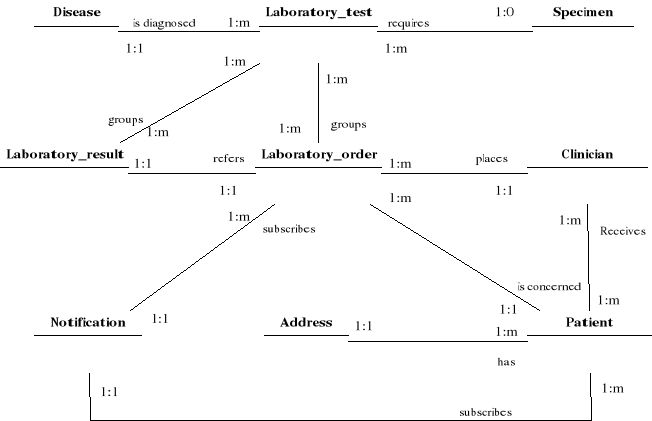
Figure 3.14: First ER diagram
|
N°
|
Entity set
|
Attribute name
|
|
1
|
Disease
|
Name
|
|
2
|
Laboratory_test
|
Name
Description
|
|
3
|
Specimen
|
name
|
|
4
|
Patient
|
Id number
Names
Date of birth
Sex
Phone
email
|
|
5
|
Clinician
|
Names
License number
Phone
email
|
|
6
|
Address
|
Suburb
Town
District
Region
|
|
7
|
Notification
|
Type
|
|
8
|
Laboratory order
|
Date of order
Date reception specimen
|
|
9
|
Laboratory result
|
Date of final result
Date notification clinician
Date notification patient
Treatment guideline
|
Table3.3: List of attributes of
the first ER diagram
Logical data design
The logical data model provides the physical database designer
with a vehicle for making tradeoffs that are very important to the design of an
efficient database. The main objective is to translate the conceptual data
model into a logical data model and, then to validate this model bychecking
whether it is structurally correct and able to support the required
transactions. The following steps are used in the logicaldata modelling:
(CONNOLLY & BEGG, 2005)
§ Relationship derivation for logical data model: We
identify many to many relationships to derive new entity followed by foreign
key identification. At this step parent and child entities are determined to
manage the foreign key mechanism.
§ Normalization: The purpose of normalization is to
ensure that the set of relations has a minimal and yet sufficient number of
attributes necessary to support the data requirements of the enterprise.The
relations should have minimal data redundancy to avoid the problems of update,
delete and insert anomalies. The third Normal Form (3NF) rules has been chosen
as sufficient level of optimization of the database schema.
After going through the conceptual and logical design, we have
obtained the final ER diagram shown in the Figure 3.16 below, only primary and
foreign keys will be represented to make the diagram simpler, other attributes
are illustrated in the Table3.4.

Figure 3.15: Final ER diagram
|
N°
|
Entity set
|
Attribute name
|
|
1
|
Disease
|
Disease id
Name
|
|
2
|
Laboratory_test
|
Test id
Name
Description
Specimen id
|
|
3
|
Specimen
|
Specimen_id
Name
|
|
4
|
Patient
|
Patient_id
Id number
First name
Las tname
Date of birth
Sex
Phone
email
Notification_id
|
|
5
|
Clinician
|
Clinician_id
Licence_number
Firstname
lastname
Phone
email
|
|
6
|
Referring_list
|
Clinician_id
Patient_id
date
|
|
7
|
Suburb
|
Suburb_id
name
|
|
8
|
Town
|
Town_id
name
|
|
9
|
District
|
District_id
name
|
|
10
|
region
|
Region_id
name
|
|
11
|
Notification
|
Notification_id
type
|
|
12
|
Laboratory_order
|
Order_id
Clinician_id
Patient_id
Date
Notification_id
date_of_order
|
|
13
|
Order_test_list
|
Order_id
Test_id
Date_specimen_reception
|
|
14
|
Laboratory_result
|
Lab_result_id
Order_id
Date of final result
Treatment guideline
|
|
15
|
Result_test_list
|
Result id
Test id
Date notification clinician
Date notification patient
notes
|
Table3.4: List of attributes of
the final ER diagram
| 

