PART IV: ANALYSIS AND PRESENTATION OF RESULTS
This chapter concerns the presentation of results on survey
conducted in Huye district, Sector Maraba, Cell Shanga and on soil analysis.
The results are shown in the tables and figures:
IV.1 SURVEY RESULTS
IV.1.1.BACK GROUND INFORMATION
IV.1.1.1.Farmer wealth categories
The 65 surveyed farmers in Shanga cell are categorized in
their different wealth groups as presented in the pie chart below. Well off
farmers represent 13.8%, middle farmers 33.8% and poor farmers 52.3%.
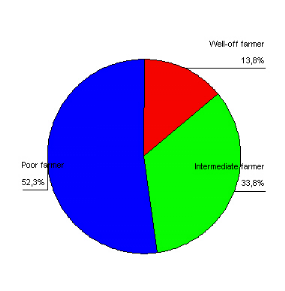
Figure 2. Farmers in wealth categories
The high number of poor farmers compared to other groups is
due to many constraints that they face, such as limited resource availability,
ignorance, etc.
IV.1.1.2.Farm types according to household head sex
Based on the results, the table below shows that male headed
household represents 69.2 % of all surveyed households. In all wealth groups,
male headed families are majority (88, 9 % in well off farmers, 68, 2 % in
middle farmers, 69, 7% in poor farmers category).
Table 3: Households head
according to sex in wealth categories
|
Household head: M/F
Wealth category
|
|
|
Total
|
|
Male
|
Female
|
|
Well-off farmer
Intermediate farmer
Poor farmer
|
8
88,9%
15
68,2%
22
64,7%
|
1
11,1%
7
31,8%
12
35,3%
|
9
100,0%
22
100,0%
34
100,0%
|
|
Total
|
45
69,2%
|
20
30,8%
|
65
100,0%
|
The reason for low number of female headed families is that a
well-off female household, once she lost her husband or divorce can easily find
another husband and the later becomes automatically responsible of the
family.
IV.1.1.3.Education and skills level
The table 4 shows globally that the majority of surveyed
farmers (61.6%) have no primary education level, 29.2% have no formal
education, 26.2% have not completed primary school while 6.2 % have acquired
other skills though they have not completed primary school. Only 38.4% appear
to have completed primary in general, and if we try to look in the respective
wealth groups, we have 55.5 % of the well-off farmer, 40.9 % of the
intermediate group, and 32.3 % of the poor farmers have completed their primary
school.
|
Education literacy
Wealth category
|
No formal education
|
Has not completed primary school
|
Has completed primary school
|
Has completed primary school and acquired other skills
|
has not completed primary school but acquired other skills
|
Total
|
|
Well-off farmer
|
1
|
2
|
3
|
2
|
1
|
9
|
|
|
11,1%
|
22,2%
|
33,3%
|
22,2%
|
11,1%
|
100,0%
|
|
Intermediate farmer
|
5
|
7
|
6
|
3
|
1
|
22
|
|
|
22,7%
|
31,8%
|
27,3%
|
13,6%
|
4,5%
|
100,0%
|
|
Poor farmer
|
13
|
8
|
10
|
1
|
2
|
34
|
|
|
38,2%
|
23,5%
|
29,4%
|
2,9%
|
5,9%
|
100,0%
|
|
Total
|
19
|
17
|
19
|
6
|
4
|
65
|
|
29,2%
|
26,2%
|
29,2%
|
9,2%
|
6,2%
|
100,0%
|
Table 4: Education and skills
level of farmers in relation to wealth status
From these results, one can conclude that there is a positive
correlation between education level and resource endowment, which means that a
farmers level of education and training influence greatly his resource
allocation.
|
|


