3.3.4 Definition of relationships and referential
integrity
From the conceptual model of the irrigation system developed
we can easily recognize how the different entities of the irrigation system
could be related. Most of the relationships retained at the level of the
physical model were many-to-one relationships as seen in Figure 3.3. Where we
had relationships of the type many to many, we had to breakdown the
relationship into two one-to-many relationships. This was done by creating a
table between the relationships. For the relationship to be correct, there must
be fields in the two tables to link them, even if they have different names,
they should contain the same data. Each table has a primary key which is
responsible for assuring that there exists some referential integrity between
the two tables being linked together. The two tables now become related and
this helps easy access and storage of data regarding the irrigation system.
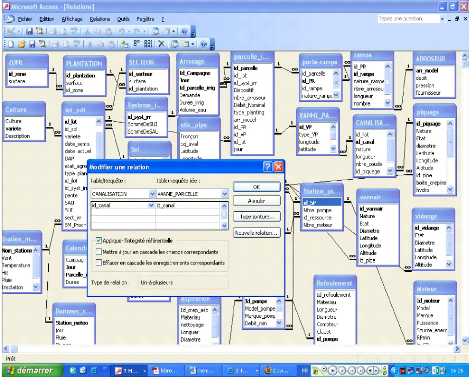
Figure 3.7: Definition of relationships
in the physical data model 3.3.5 Creation of data entry and
retrieval forms
The procedure for the creation of forms under MS access 2003 has
been used for the creation of forms for the irrigation system. This constituted
the following procedure:
1) In the Navigation pane, the tables or queries that were
needed for the form were selected to use as the form record source.
2) Then we chose Create> More> Forms> Form Wizard.
Access displays the first Form Wizard dialog box.
3) For each field we wanted to include in the form, we
clicked on the field in the Available Fields list and clicked on the >
button. (To select all the fields, we clicked on the >> button.)
4) The next Form Wizard dialog box permitted us to choose the
layout of the fields. Four choices are available for this:
· Columnar--the fields are arranged in
columns, and only one record is shown at a time.
· Tabular--the fields are arranged in a
table, with the field names at the top and the records in rows.
· Datasheet--the fields are arranged in a
datasheet layout.
· Justified--the fields are arranged
across and down the form with the field names above their respective
controls.
5) The next wizard dialog box enabled us to select one of the
predefined AutoFormat styles. Click the style you want to use and then click
Next.
6) The fourth and last wizard dialog box modifies the name of
the form. A suggestion is already in place in the What Title Do You Want for
Your Form?? Text box; it is based on the name of the underlying table or query,
but the name was entered so that it doesn`t conflict with an existing form.
Figure 3.4 shows a form under construction in MS access
environment.
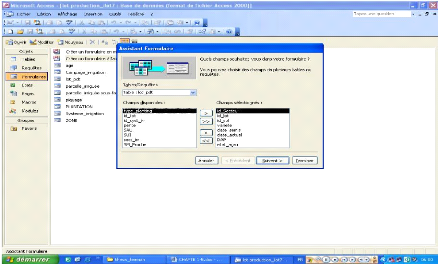
Figure 3.8: Selecting fields to be included in the
production plot form under the form assistant mode
3.4 Development of thematic layers for the GIS
The GIS was developed using MapInfo software and AUTOCAD, a
computer aided drawing (CAD) software. This type of system gives the
possibility of combining methods of simulation of spatial data and the
presentation of the results in a graphical manner that will be adapted to the
irrigation system of the PHP group. The global architecture of the system will
comprise three modules:
· Data entry and update module;
· Water balance module;
· Simulation module;
The thematic layers of the GIS were developed by reviewing the
type of data that needed to be entered in the database to meet the specific
objectives of the GIS project.
A land use map was developed for the plantation and
constituted the main thematic layer for the GIS. The plantation borders,
sector, and production plots where been represented. The procedure for creating
the land use map with the GPS involved collecting waypoints and extracting the
data to a computer. This was done through the following procedure:
1. Creating a folder on the hard drive C\MAPDATA for the data
related to the map project. This folder was not stored on the desktop as the
files are too large. A permanent folder (not to be moved or renamed) was
created, in which the data will remain, as when the maps are saved they
reference a pathway to the original data folder.
2. A data cable was connected to the GARMIN 72 GPS unit and to
the computer and the GPS unit (simulator mode is fine) was turned on.
3. The DNRGarmin program was then opened. On menu at top, GPS?
was been selected, and then Set port? tab to USB
4. Next, the type data we wished to download was clicked, such
as waypoint, track or route, then Properties? and then on the tab marked
projection?.
5. Once these points have been inserted into the program, we
then connect the points to form polygons of the various items we wished to
identify in the map.
6. The map was saved on the hard drive and then used later for
representation of the various layers which could be shown on the map..
| 

