3.6.4 Calculation of piezometric elevations
The piezometric elevations are calculated based on the following
formula proposed by Zoungrana, 2002
. piezometric elevation required downstream
(3.13)
Where,
piezometric elevation required downstream (m)
required pressure downstream (m) downstream elevation (m)
. piezometric elevation required upstream
(3.14)
Where,
required piezometric elevation upstream (m)
required pressure downstream (m) upstream elevation (m)
. available piezometric elevation upstream
(3.15)
Where,
available piezometric elevation upstream (m)
required piezometric elevation downstream (m)
= head losses in the given branch (m) . piezometric elevation
retained upstream
max ( , ) (3.16)
Where,
piezometric elevation retained (m)
3.7 Spatial Representation of some Aspects on the
Irrigation System
Spatial representation of some aspects on the irrigation
system was done under MapInfo and AutoCAD software. Multiple queries on the MS
access data base was carried out to be able to obtain the data that needed to
be represented spatially. An ODBC connection between the database and the
MapInfo software was created to be able to represent these aspects of the
irrigation system. Queries led to the creation of tables in database formats
(dbf) which helped to link them to the land use map of the plantation. This
is because tables are linked by the plot ID which is a common
denominator to both tables. For example, to represent spatially the plots which
have the microjet irrigation system, a query was created on the plot table
which has one of its columns being the plot ID same as that for the map
table.
CHAPTER IV
RESULTS AND DISCUSSIONS
4.1 Database for the Irrigation System
The process of development of a database for the system led to
the realization of a model for the data concerning the irrigation system.
4.1.1 Physical model
The physical model of data shows how the various tables of the
database have been linked based on the relationships that exist between the
various entities in the tables (Figure 4.1). It could be seen from this model
that a zone for example, will comprise several plantations, a plantation will
comprise several sectors etc. These relationships thus developed govern the
mode of querying data for the irrigation system. Based on the information that
is required at any point in time, the irrigation manager could query tables
that are linked to the information that is required for the system.
The relationship between the different tables is presented as
it was lastly defined and thus, is not standard. The fields of the different
tables are equally not final and modifications could be envisaged after a trial
period of the GIS database. This method of organizing data will greatly improve
management of the irrigation system as the irrigation manager could simulate
any field situation and obtain the information that is required.
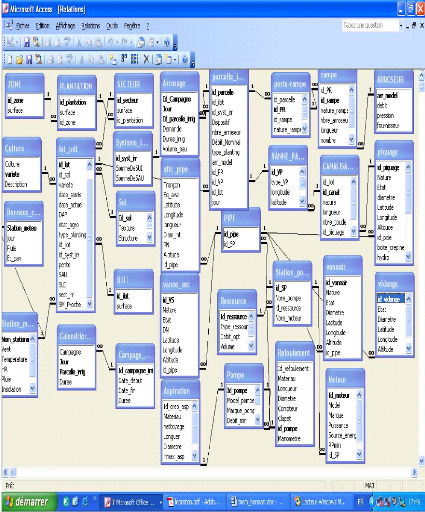
Figure 4.1: Presentation of the physical model of data as
developed in MS Access
4.1.2 Creation of forms
Ten forms for the irrigation system were created and the layout
of one of these forms is presented in Figure 4.3.
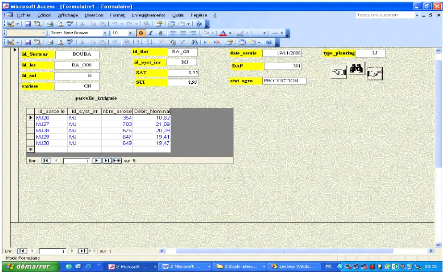
Figure 4.2: Form for data entry and retrieval for the
production plot
Forms bring a number of advantages to the data entry table:
· Because the form shows only one record at a time, the
irrigation manager can almost always see all the table fields at once,
contrary, to datasheets were it is only possible to see only four or five
columns at a time.
· Controls such as drop-down lists reduce the possibility
of data entry errors by giving the users a limited set of choices for a
field.
· Access will give irrigation managers a number of
customization options. These features let them create Access forms that look
exactly like paper forms, and they can add graphics and other objects to make
the forms more interesting.
· The irrigation manager will not be distracted by other
data in the table, and thus give full attention to the task at hand.
Specifically to the irrigation database, the forms give users
the possibility to enter and retrieve information without having to open the
tables involved. One could for example want to know the plots that are
irrigated in a particular production plot, to replace a plot that is now under
fallow, to enter a new irrigation plot etc. This will be easily done with the
use of forms. Some of the forms created included that of the irrigation plots,
production plots, the age of the plantation and a total of 10 forms were
created to enhance data entry and retrieval.
| 

