CONCLUSION
En conclusion nous obtenons un modèle instable. Nous
pouvons l'expliquer par la présence d'auto-corrélation dans le
modèle. Nous pouvons dire que notre modèle n'est pas efficace
malgré le fait qu'il soit homoscédastique et non
colinéaire. Le faible R2 du modèle pouvait nous
laisser penser à une telle conclusion, tout comme la présence
d'auto-corrélation dans le modèle. Les moindres carrés
généralisés ne peuvent donc pas être appliqué
à un tel modèle et donc aucune conclusion ne peut être
tirée dessus.
Le mieux serait d'essayer de faire un modèle VAR pour
essayer de corriger le modèle mais ce test n'ayant jamais
été vu en cours nous ne pouvons pas l'appliquer.
ENTREE RATS
*********************************DONNEES****************************
**********************************************************************
cal 1990 1 12
all 2008:9
open data i:suede.xls
data(for=xls, org=col) / CPI TAUX_3_MOIS TAUX_10_ANS DEFICIT
PRODUCTION_INDUSTRIELLE MSCI_SUEDE TAUX_LONG_US
table
print(picture='*.##')
********************************************************************
****************************BRUTE OU
LOG**************************
********************************************************************
*/modele lineaire*/
lin TAUX_10_ANS / res
# CONSTANT TAUX_3_MOIS CPI DEFICIT PRODUCTION_INDUSTRIELLE
MSCI_SUEDE TAUX_LONG_US
com s1 = sqrt(%seesq)
*/modele en LOG*/
set LTAUX_10_ANS = LOG(TAUX_10_ANS)
set LTAUX_3_MOIS = LOG(TAUX_3_MOIS)
set LCPI = LOG(CPI)
set LDEFICIT = LOG(DEFICIT)
set LPRODUCTION_INDUSTRIELLE = LOG(PRODUCTION_INDUSTRIELLE)
set LMSCI_SUEDE = LOG(MSCI_SUEDE)
set LTAUX_LONG_US = LOG(TAUX_LONG_US)
lin LTAUX_10_ANS / RES
# CONSTANT LTAUX_3_MOIS LCPI LDEFICIT LPRODUCTION_INDUSTRIELLE
LMSCI_SUEDE LTAUX_LONG_US
com s2 = sqrt(%seesq)*exp(%mean)
dis ' s du modele lineaire = ' s1
dis ' s du modele en LOG = ' s2
*********************************************************************************************************GRAPHES*****************************************************************************************************************
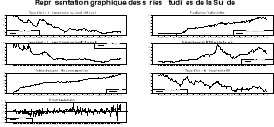
spgraph(header="Représentation graphique des
séries étudiées de la
Suède",vfields=4,hfields=2)
graph(header="Taux d'intérêt à long terme
national (10 ans)",key=lol) 1
# TAUX_10_ANS 1990:1 2008:9
graph(header="Taux d'intérêt à court terme
national (3 mois)",key=upr) 1
# TAUX_3_MOIS 1990:1 2008:9
graph(header="Indice des prix à la
consommation",key=lor) 1
# CPI 1990:1 2008:9
graph(header="Déficit budgetaire",key=lol) 1
# deficit 1990:1 2008:9
graph(header="Production Industrielle",key=lor) 1
# production_industrielle 1990:1 2008:9
graph(header="Indice boursier MSCI de la
Suède",key=lor) 1
# MSCI_Suede 1990:1 2008:9
graph(header="Taux d'intérêt à long terme
US",key=lol) 1
# TAUX_LONG_US 1990:1 2008:9
spgraph(done)
****************************************************************************
**********************TEST DE DICKEY-FULLER
AUGMENTÉ******************
****************************************************************************
source adfautoselect.src
@ADFAutoSelect(MAXLAG=12,PRINT) TAUX_10_ANS 1990:1 2008:9
source dfunit5.src
@dfunit5(LAGS=1) TAUX_10_ANS 1990:1 2008:9
source adfautoselect.src
@ADFAutoSelect(MAXLAG=12,PRINT) TAUX_3_MOIS 1990:1 2008:9
source dfunit5.src
@dfunit5(LAGS=1) TAUX_3_MOIS 1990:1 2008:9
source adfautoselect.src
@ADFAutoSelect(MAXLAG=15,PRINT) CPI 1990:1 2008:9
source dfunit5.src
@dfunit5(LAGS=12) CPI 1990:1 2008:9
source adfautoselect.src
@ADFAutoSelect(MAXLAG=15,PRINT) DEFICIT 1990:1 2008:9
source dfunit5.src
@dfunit5(LAGS=11) DEFICIT 1990:1 2008:9
source adfautoselect.src
@ADFAutoSelect(MAXLAG=12,PRINT) PRODUCTION_INDUSTRIELLE 1990:1
2008:9
source dfunit5.src
@dfunit5(LAGS=2) PRODUCTION_INDUSTRIELLE 1990:1 2008:9
source adfautoselect.src
@ADFAutoSelect(MAXLAG=12,PRINT) MSCI_SUEDE 1990:1 2008:9
source dfunit5.src
@dfunit5(LAGS=0) MSCI_SUEDE 1990:1 2008:9
source adfautoselect.src
@ADFAutoSelect(MAXLAG=12,PRINT) TAUX_LONG_US 1990:1 2008:9
source dfunit5.src
@dfunit5(LAGS=0) TAUX_LONG_US 1990:1 2008:9
***************************************************************************
*****************************DIFFERENCE
PREMIERE************************
difference TAUX_10_ANS / DTAUX_10_ANS
difference TAUX_3_MOIS / DTAUX_3_MOIS
difference CPI / DCPI
difference DEFICIT / DDEFICIT
difference PRODUCTION_INDUSTRIELLE /
DPRODUCTION_INDUSTRIELLE
difference MSCI_SUEDE / DMSCI_SUEDE
difference TAUX_LONG_US / DTAUX_LONG_US
****************************************************************************
***************************ADF DIFFERENCE
PREMIERE**********************
****************************************************************************
source adfautoselect.src
@ADFAutoSelect(MAXLAG=12,PRINT) DTAUX_10_ANS 1990:1 2008:9
source dfunit5.src
@dfunit5(LAGS=0) DTAUX_10_ANS 1990:1 2008:9
source adfautoselect.src
@ADFAutoSelect(MAXLAG=12,PRINT) DTAUX_3_MOIS 1990:1 2008:9
source dfunit5.src
@dfunit5(LAGS=0) DTAUX_3_MOIS 1990:1 2008:9
source adfautoselect.src
@ADFAutoSelect(MAXLAG=20,PRINT) DCPI 1990:1 2008:9
source dfunit5.src
@dfunit5(LAGS=11) DCPI 1990:1 2008:9
source adfautoselect.src
@ADFAutoSelect(MAXLAG=12,PRINT) DDEFICIT 1990:1 2008:9
source dfunit5.src
@dfunit5(LAGS=10) DDEFICIT 1990:1 2008:9
source adfautoselect.src
@ADFAutoSelect(MAXLAG=20,PRINT) DPRODUCTION_INDUSTRIELLE
1990:1 2008:9
source dfunit5.src
@dfunit5(LAGS=1) DPRODUCTION_INDUSTRIELLE 1990:1 2008:9
source adfautoselect.src
@ADFAutoSelect(MAXLAG=12,PRINT) DMSCI_SUEDE 1990:1 2008:9
source dfunit5.src
@dfunit5(LAGS=0) DMSCI_SUEDE 1990:1 2008:9
source adfautoselect.src
@ADFAutoSelect(MAXLAG=12,PRINT) DTAUX_LONG_US 1990:1 2008:9
source dfunit5.src
@dfunit5(LAGS=0) DTAUX_LONG_US 1990:1 2008:9
****************************************************************************
**********************Étude de la cointégration
de Engle-Granger*******************
****************************************************************************
smpl 1990:1 2008:9
lin TAUX_10_ANS / RESIDUS
# CONSTANT TAUX_3_MOIS CPI DEFICIT PRODUCTION_INDUSTRIELLE
MSCI_SUEDE TAUX_LONG_US
********************************************************
graph(header="Graphe des Résidus",key=upr) 2
# TAUX_10_ANS 1990:01 2008:9
# RESIDUS 1990:01 2008:9
********************************************************
source adfautoselect.src
@ADFAutoSelect(MAXLAG=12,PRINT) RESIDUS 1990:1 2008:9
set RESIDUS1 = RESIDUS+%beta(2)
source dfunit5.src
@dfunit5(lags = 0) RESIDUS1 1990:1 2008:9
***************************************************************************
**************************CHOIX DES
VARIABLES***************************
***************************************************************************
**************************REGRESSION
DESCENDANTE**********************
****************************************************************************
lin DTAUX_10_ANS / res
# CONSTANT DTAUX_3_MOIS DCPI DDEFICIT DPRODUCTION_INDUSTRIELLE
DMSCI_SUEDE DTAUX_LONG_US
com s = sqrt(%seesq)
dis ' s du modele = ' s
*********************sans
DPRODUCTION_INDUSTRIELLE*****************
lin DTAUX_10_ANS / res
# CONSTANT DTAUX_3_MOIS DCPI DDEFICIT DMSCI_SUEDE
DTAUX_LONG_US
com s = sqrt(%seesq)
dis ' s du modele = ' s
************sans DPRODUCTION_INDUSTRIELLE et
DDEFICIT*****************
lin DTAUX_10_ANS / res
# CONSTANT DTAUX_3_MOIS DCPI DMSCI_SUEDE DTAUX_LONG_US
com s = sqrt(%seesq)
dis ' s du modele = ' s
*********sans DCPI DPRODUCTION_INDUSTRIELLE et
DDEFICIT****************
lin DTAUX_10_ANS / res
# CONSTANT DTAUX_3_MOIS DMSCI_SUEDE DTAUX_LONG_US
com s = sqrt(%seesq)
dis ' s du modele = ' s
****************************************************************************
********CHOIX AUTOMATIQUE DU MEILLEUR MODELE
(CONFIRMATION)******
****************************************************************************
source(noecho) select3.src
@select3 DTAUX_10_ANS 1990:1 2008:9
# CONSTANT DCPI DTAUX_3_MOIS DPRODUCTION_INDUSTRIELLE
DMSCI_SUEDE DTAUX_LONG_US DDEFICIT
dis '*******************MODELE EN
ECART****************************'
********************Recherche des points aberrants dans les
résidus*************
dis '*/points aberrants/*'
source(noecho) points_ab.src
@points_ab DTAUX_10_ANS 1990:1 2008:9
#CONSTANT DCPI DTAUX_3_MOIS DMSCI_SUEDE DTAUX_LONG_US
*******************************************************************
*/correction des points aberrants*/
set du1 = T ==1992:08
set du2 = T ==1992:09
set du3 = T ==1992:10
set du4 = T ==1993:01
set du5 = T ==1994:04
set du6 = T ==1994:06
set du7 = T ==1994:07
set du8 = T ==1994:08
set du9 = T ==1994:10
set du10 = T ==1996:02
set du11 = T ==1999:07
lin DTAUX_10_ANS / res1
# CONSTANT DCPI DTAUX_3_MOIS DMSCI_SUEDE DTAUX_LONG_US du1 du2
du3 du4 du5 du6 du7 du8 du9 du10 du11
corr(qstat,noprint) res1
dis ' statistique Q(' fix(%min(%nobs/4.,2.*sqrt(%nobs))) ')'
@22 ###.##### %cdstat @35 'niveau de significativité' ###.####
%signif
com s = sqrt(%seesq)
dis ' s du modele corrigé = ' s
******************vérfication s'il y a encore des
points aberrants*********************
*/verification/*
source(noecho) points_ab.src
@points_ab DTAUX_10_ANS 1990:1 2008:09
#constant DCPI DTAUX_3_MOIS DMSCI_SUEDE DTAUX_LONG_US du1 du2
du3 du4 du5 du6 du7 du8 du9 du10 du11
*print / du1 du2 du3 du4 du5 du6 du7 du8 du9 du10 du11
****************************************************************************
****************************Test de
normarlite*********************************
****************************************************************************
dis ' test normalite en ecart'
sta res1 1990:1 2008:9
dis 'les erreurs suivent une loi normale'
****************************************************************************
***************************Test
d'autocorrelation*******************************
****************************************************************************
smpl 1990:1 2008:9
lin DTAUX_10_ANS / res1
# CONSTANT DCPI DTAUX_3_MOIS DMSCI_Suede DTAUX_LONG_US DU1 DU2
DU3 DU4 DU5 DU5 DU6 DU7 DU8 DU9 DU10 DU11
corr(qstat,span=4) res1 2008:9-%nobs+1 2008:9
****************************************************************************
**********************correction
autocorrelation*********************************
****************************************************************************
ar1(method = corc) DTAUX_10_ANS
# CONSTANT DCPI DTAUX_3_MOIS DMSCI_SUEDE DTAUX_LONG_US
****************************************************************************
**************************Test
d'heteroscedasticite******************************
****************************************************************************
***** test de white *****
source(noecho) white.src
@white res1 1990:01 2008:9
# DCPI DTAUX_3_MOIS DMSCI_Suede DTAUX_LONG_US
****************************************************************************
***********************test de stabilite (test de chow AVEC
DUMMIES)*************
****************************************************************************
source(noecho) chow.src
@chow DTAUX_10_ANS 1990:01 2008:9
# CONSTANT DCPI DTAUX_3_MOIS DMSCI_SUEDE DTAUX_LONG_US du1 du2
du3 du4 du5 du6 du7 du8 du9 du10 du11
****************************************************************************
**********************test de stabilite (test de chow SANS
DUMMIES)**************
****************************************************************************
source(noecho) chow.src
@chow DTAUX_10_ANS 1990:01 2008:9
# CONSTANT DCPI DTAUX_3_MOIS DMSCI_SUEDE DTAUX_LONG_US
****************************************************************************
*/Verification de l'hypothese*/
com start = 1990:01
com end = 2008:9
smpl start end
lin DTAUX_10_ANS / res1
# CONSTANT DCPI DTAUX_3_MOIS DMSCI_SUEDE DTAUX_LONG_US
corr(qstat,noprint) res1
dis ' statistique Q(' fix(%min(%nobs/4.,2.*sqrt(%nobs))) ')'
@22 ###.##### %cdstat @35 'niveau de significativité' ###.####
%signif
****************************************************************************
*****************************Étude de la
colinéarité*****************************
****************************************************************************
source(noecho) bkw.src
@bkw DTAUX_10_ANS 1990:1 2008:9
# CONSTANT DCPI DTAUX_3_MOIS DMSCI_Suede DTAUX_LONG_US
SORTIES RATS
Series Obs Mean Std Error
Minimum Maximum
CPI 225 260.276622 22.175984
199.000000 305.080000
TAUX_3_MOIS 225 5.731105 3.601416
1.473600 14.935500
TAUX_10_ANS 225 6.739778 2.891478
2.980000 13.780000
DEFICIT 225 -1267.937778 18605.834160
-84800.000000 61483.000000
PRODUCTION_INDUS 225 91.418667 17.870731
62.800000 120.700000
MSCI_SUEDE 225 620.549867 346.750432
134.140000 1473.530000
TAUX_LONG_US 225 5.714889 1.357450
3.330000 8.890000
ENTRY CPI TAUX_3_MOIS TAUX_10_ANS
DEFICIT PRODUCTION_INDUS MSCI_SUEDE TAUX_LONG_US
1990:01 199.00 12.67 12.90
4535.00 66.20 206.98 8.21
1990:02 199.90 14.93 13.74
-4570.00 66.60 194.91 8.47
1990:03 205.40 14.73 13.78
-4836.00 67.10 190.60 8.59
1990:04 205.20 13.79 13.67
8051.00 66.50 192.95 8.79
1990:05 206.40 13.02 13.31
847.00 66.80 213.06 8.76
1990:06 206.20 12.61 12.92
5526.00 66.90 222.91 8.48
1990:07 208.20 12.63 12.84
-3807.00 64.60 226.63 8.47
1990:08 209.60 13.04 13.29
13171.00 66.40 195.29 8.75
1990:09 212.00 13.12 13.38
-14262.00 66.30 158.00 8.89
1990:10 213.40 14.72 13.28
-1723.00 66.50 161.09 8.72
1990:11 214.10 14.94 12.83
-4201.00 66.50 139.27 8.39
1990:12 213.90 14.41 12.33
-12708.00 67.30 148.74 8.08
1991:01 218.90 13.42 11.88
-6128.00 66.60 157.30 8.09
1991:02 225.00 12.10 11.18
-2949.00 66.40 186.96 7.85
1991:03 225.80 12.15 11.36
-16202.00 65.80 193.22 8.11
1991:04 227.10 12.32 11.37
5290.00 65.90 186.37 8.04
1991:05 227.30 11.81 10.82
-6230.00 65.50 197.33 8.07
1991:06 227.00 10.66 10.63
-4754.00 65.00 203.44 8.28
1991:07 227.10 10.62 10.64
1156.00 64.80 199.90 8.27
1991:08 226.70 10.75 10.65
7764.00 64.00 198.60 7.90
1991:09 229.20 10.32 10.21
-21390.00 64.70 187.40 7.65
1991:10 230.10 10.80 10.03
-3595.00 65.00 182.42 7.53
1991:11 231.10 11.11 9.87
-13390.00 65.70 168.54 7.42
1991:12 230.80 13.70 10.03
-20701.00 64.10 165.74 7.09
1992:01 230.20 12.54 9.54
-14177.00 66.10 179.58 7.03
1992:02 230.30 12.28 9.45
13074.00 65.40 172.93 7.34
1992:03 231.30 11.75 9.42
-16687.00 64.50 183.16 7.54
1992:04 231.90 11.90 9.55
10219.00 65.60 180.20 7.48
1992:05 232.00 11.71 9.54
-19573.00 65.20 181.71 7.39
1992:06 231.50 11.64 9.65
-3462.00 64.70 170.41 7.26
1992:07 231.20 11.97 9.86
-13183.00 66.80 156.08 6.84
1992:08 231.30 13.32 10.60
-1912.00 66.90 147.70 6.59
1992:09 234.60 12.11 11.22
-29688.00 64.90 134.14 6.42
1992:10 235.10 14.50 10.98
-6679.00 64.40 139.86 6.59
1992:11 234.00 12.56 10.63
-30208.00 63.20 174.18 6.87
1992:12 234.90 10.63 9.79
-30116.00 63.60 180.67 6.77
1993:01 241.00 9.81 10.17
-47077.00 63.20 174.05 6.60
1993:02 241.60 9.37 9.83
16063.00 62.80 194.00 6.26
1993:03 242.70 9.76 9.40
-29487.00 64.00 191.87 5.98
1993:04 243.70 9.53 9.44
3790.00 63.40 195.23 5.97
1993:05 243.10 8.79 9.12
-17786.00 64.40 213.62 6.04
1993:06 242.30 8.37 8.71
-1678.00 64.70 206.73 5.96
1993:07 241.90 8.26 8.27
-2458.00 65.60 227.85 5.81
1993:08 242.30 7.64 7.66
-14480.00 65.90 247.54 5.68
1993:09 244.50 7.58 7.82
-42001.00 66.30 252.25 5.36
1993:10 245.20 7.50 7.59
-6561.00 66.50 274.02 5.33
1993:11 245.30 7.27 7.52
-18944.00 66.90 255.25 5.72
1993:12 244.30 6.94 7.30
-47459.00 68.40 271.10 5.77
1994:01 245.10 7.01 7.05
-22547.00 68.60 299.42 5.75
1994:02 245.90 7.03 7.15
7622.00 69.90 292.82 5.97
1994:03 246.80 7.08 7.87
-5430.00 71.20 275.15 6.48
1994:04 247.80 7.12 8.64
5951.00 71.30 283.55 6.97
1994:05 248.30 7.03 8.91
8526.00 72.10 292.22 7.18
1994:06 248.40 7.02 10.01
-37306.00 73.80 258.17 7.10
1994:07 248.40 7.35 10.90
-10705.00 71.50 282.80 7.30
1994:08 248.50 7.72 11.44
11644.00 73.40 283.27 7.24
1994:09 250.70 7.74 11.43
-39637.00 77.10 276.88 7.46
1994:10 251.00 7.98 11.13
1977.00 77.50 284.80 7.74
1994:11 250.80 8.14 11.12
-24994.00 78.60 290.65 7.96
1994:12 250.40 8.00 10.86
-18287.00 79.60 286.00 7.81
1995:01 251.30 8.05 11.03
-37734.00 80.20 290.20 7.78
1995:02 252.30 7.93 10.74
20328.00 81.00 289.17 7.47
1995:03 253.30 8.70 11.20
-25161.00 81.80 283.13 7.20
1995:04 255.00 8.81 11.44
-3515.00 82.10 301.75 7.06
1995:05 255.30 8.80 10.77
-17172.00 81.80 310.42 6.63
1995:06 255.10 9.19 10.61
-7683.00 82.20 320.35 6.17
1995:07 254.80 9.29 10.58
-10025.00 82.10 343.13 6.28
1995:08 254.50 9.18 10.25
-14337.00 82.40 344.72 6.49
1995:09 256.20 8.95 9.66
-18148.00 82.10 356.95 6.20
1995:10 256.90 8.89 9.33
-4463.00 83.20 331.45 6.04
1995:11 256.80 8.87 9.02
-15041.00 82.50 345.92 5.93
1995:12 256.00 8.64 8.63
-20231.00 80.90 338.92 5.71
1996:01 255.60 8.22 8.25
-26959.00 82.00 332.39 5.65
1996:02 255.80 7.69 8.78
25811.00 82.30 371.35 5.81
1996:03 257.00 7.11 8.79
1209.00 81.10 379.70 6.27
1996:04 257.60 6.28 8.36
-4412.00 81.50 379.32 6.51
1996:05 257.30 6.22 8.46
-5636.00 83.50 389.74 6.74
1996:06 256.30 5.82 8.37
1484.00 83.30 380.41 6.91
1996:07 255.70 5.46 8.29
-10696.00 84.00 358.75 6.87
1996:08 254.50 5.20 8.13
-2600.00 84.70 390.85 6.64
1996:09 256.00 4.83 7.82
803.00 82.50 403.95 6.83
1996:10 255.90 4.64 7.22
-3959.00 82.40 425.08 6.53
1996:11 255.30 4.46 7.29
-9264.00 84.00 439.84 6.20
1996:12 254.90 3.91 6.88
-23805.00 86.00 463.58 6.30
1997:01 254.60 3.79 6.77
-3318.00 86.30 494.10 6.58
1997:02 254.20 3.96 6.71
25319.00 85.50 525.20 6.42
1997:03 255.20 4.16 7.13
-1122.00 85.30 546.02 6.69
1997:04 257.00 4.06 7.27
-2065.00 87.20 512.40 6.89
1997:05 257.00 4.12 7.04
6613.00 86.80 566.37 6.71
1997:06 257.40 4.08 6.83
-7058.00 86.20 606.47 6.49
1997:07 257.30 4.09 6.47
-9162.00 88.50 652.32 6.22
1997:08 257.40 4.20 6.56
4954.00 87.90 619.01 6.30
1997:09 259.80 4.13 6.41
6859.00 88.80 652.45 6.21
1997:10 259.60 4.26 6.25
-7886.00 89.30 576.97 6.03
1997:11 259.20 4.33 6.33
-8514.00 89.30 603.20 5.88
1997:12 259.10 4.45 6.06
-10848.00 91.50 567.25 5.81
1998:01 256.90 4.44 5.69
3963.00 90.00 621.58 5.54
1998:02 256.60 4.36 5.56
28271.00 89.70 683.34 5.57
1998:03 257.00 4.51 5.38
-3953.00 90.30 733.43 5.65
1998:04 257.70 4.50 5.24
1560.00 91.30 718.76 5.64
1998:05 258.10 4.52 5.23
4981.00 89.50 767.63 5.65
1998:06 257.60 4.23 5.00
-9291.00 91.90 773.91 5.50
1998:07 257.00 4.14 4.91
1586.00 92.40 776.50 5.46
1998:08 255.70 4.23 4.83
-5403.00 93.50 672.40 5.34
1998:09 256.80 4.22 4.82
1883.00 92.10 595.37 4.81
1998:10 257.30 4.20 4.75
-6489.00 92.30 619.83 4.53
1998:11 256.70 3.82 4.59
8069.00 92.50 722.34 4.83
1998:12 256.20 3.45 4.25
-15515.00 91.80 701.88 4.65
1999:01 256.20 3.27 4.02
-1168.00 90.80 700.17 4.72
1999:02 256.30 3.14 4.18
11203.00 92.80 732.73 5.00
1999:03 257.30 3.13 4.44
13483.00 93.80 731.88 5.23
1999:04 257.90 2.87 4.24
14428.00 91.90 788.96 5.18
1999:05 258.30 2.92 4.50
-4012.00 92.90 774.46 5.54
1999:06 258.70 2.97 4.87
9459.00 93.60 830.57 5.90
1999:07 257.60 3.01 5.26
5925.00 93.50 816.56 5.79
1999:08 257.60 3.00 5.49
-599.00 91.90 865.95 5.94
1999:09 259.40 3.05 5.69
16089.00 95.60 845.73 5.92
1999:10 259.70 3.23 5.92
1421.00 95.40 890.81 6.11
1999:11 259.00 3.38 5.56
4244.00 96.00 1041.31 6.03
1999:12 259.60 3.41 5.59
9485.00 94.90 1154.56 6.28
2000:01 257.50 3.57 5.95
206.00 94.10 1214.75 6.66
2000:02 258.70 3.90 5.90
28789.00 96.90 1427.61 6.52
2000:03 259.90 4.06 5.51
11832.00 97.40 1473.53 6.26
2000:04 260.00 3.99 5.42
6145.00 100.00 1403.81 5.99
2000:05 261.30 3.96 5.34
8893.00 100.40 1315.76 6.44
2000:06 261.20 3.94 5.13
61483.00 100.80 1305.73 6.10
2000:07 260.00 4.03 5.31
14453.00 100.30 1301.19 6.05
2000:08 260.20 4.00 5.31
-3577.00 100.20 1321.90 5.83
2000:09 262.00 3.94 5.26
15081.00 100.70 1243.76 5.80
2000:10 262.60 3.99 5.23
-6651.00 101.80 1158.84 5.74
2000:11 262.70 4.00 5.13
-30974.00 103.10 1126.00 5.72
2000:12 262.50 4.07 4.92
-3748.00 100.20 1059.60 5.24
2001:01 261.70 4.07 4.89
-19294.00 102.60 1073.34 5.16
2001:02 262.60 4.10 4.86
45291.00 100.30 979.82 5.10
2001:03 264.60 4.06 4.75
4258.00 100.10 906.51 4.89
2001:04 266.90 3.94 4.93
-17878.00 97.20 910.58 5.14
2001:05 268.70 4.01 5.27
10398.00 99.30 956.06 5.39
2001:06 268.30 4.17 5.38
9375.00 98.10 849.83 5.28
2001:07 266.90 4.31 5.42
5361.00 99.00 837.10 5.24
2001:08 267.60 4.28 5.15
-5852.00 99.60 836.98 4.97
2001:09 269.90 4.01 5.26
34255.00 98.10 684.92 4.73
2001:10 269.10 3.70 5.17
3696.00 98.50 777.14 4.57
2001:11 269.20 3.70 4.96
1891.00 98.30 841.51 4.65
2001:12 269.50 3.71 5.24
-32778.00 99.70 839.23 5.09
2002:01 268.80 3.74 5.27
4557.00 99.10 789.55 5.04
2002:02 269.40 3.87 5.36
19339.00 101.30 785.91 4.91
2002:03 271.80 4.09 5.63
-1749.00 101.20 792.53 5.28
2002:04 272.90 4.25 5.69
2442.00 100.20 717.83 5.21
2002:05 273.60 4.29 5.69
3518.00 100.20 689.24 5.16
2002:06 273.20 4.28 5.52
21464.00 99.20 594.96 4.93
2002:07 272.30 4.26 5.37
3891.00 100.50 484.34 4.65
2002:08 272.40 4.19 5.13
-11896.00 100.00 539.06 4.26
2002:09 274.50 4.17 4.97
-1216.00 100.30 474.69 3.87
2002:10 275.40 4.07 5.07
-1096.00 100.70 495.53 3.94
2002:11 274.70 3.91 5.05
201.00 101.10 578.25 4.05
2002:12 275.10 3.67 4.89
-37945.00 102.20 494.37 4.03
2003:01 276.00 3.65 4.70
-32006.00 102.90 475.65 4.05
2003:02 278.40 3.61 4.47
25364.00 100.40 464.00 3.90
2003:03 279.80 3.40 4.57
-9083.00 101.10 478.90 3.81
2003:04 278.80 3.42 4.72
-1280.00 103.90 497.92 3.96
2003:05 278.50 3.18 4.37
11534.00 102.20 502.35 3.57
2003:06 277.70 2.81 4.20
1091.00 102.60 536.54 3.33
2003:07 276.80 2.68 4.51
385.00 104.70 552.78 3.98
2003:08 276.70 2.71 4.70
-12409.00 103.90 588.06 4.45
2003:09 278.70 2.71 4.73
-637.00 104.10 581.65 4.27
2003:10 278.90 2.73 4.85
-5256.00 103.60 613.35 4.29
2003:11 278.30 2.72 4.98
-258.00 103.30 617.02 4.30
2003:12 278.60 2.69 4.86
-23795.00 105.50 628.11 4.27
2004:01 278.00 2.60 4.65
-33028.00 106.00 675.18 4.15
2004:02 277.30 2.46 4.55
9292.00 105.90 698.18 4.08
2004:03 279.40 2.27 4.31
-635.00 104.80 679.57 3.83
2004:04 279.40 2.02 4.55
7835.00 107.80 714.29 4.35
2004:05 280.10 2.00 4.68
13895.00 107.50 671.79 4.72
2004:06 278.90 1.98 4.72
3004.00 107.00 697.54 4.73
2004:07 278.50 1.99 4.57
-302.00 104.00 671.95 4.50
2004:08 278.20 2.02 4.42
-15697.00 109.10 690.92 4.28
2004:09 280.20 2.00 4.37
-7648.00 108.20 693.55 4.13
2004:10 281.00 1.99 4.24
-4061.00 107.30 701.36 4.10
2004:11 279.40 1.99 4.13
529.00 108.10 743.52 4.19
2004:12 279.40 1.99 3.90
-25887.00 105.00 741.89 4.23
2005:01 277.90 2.00 3.84
-23616.00 105.80 741.92 4.22
2005:02 279.20 1.97 3.76
15430.00 109.30 769.89 4.17
2005:03 279.80 1.97 3.86
19625.00 110.00 770.48 4.50
2005:04 280.20 1.99 3.58
12923.00 107.00 757.05 4.34
2005:05 280.30 1.90 3.34
11467.00 107.60 790.72 4.14
2005:06 280.40 1.65 3.11
2439.00 110.30 809.91 4.00
2005:07 279.40 1.48 3.06
10921.00 112.20 861.49 4.18
2005:08 279.90 1.48 3.14
-8419.00 106.50 833.86 4.26
2005:09 281.90 1.47 2.98
-9397.00 109.50 882.77 4.20
2005:10 282.40 1.49 3.17
-4014.00 111.60 862.86 4.46
2005:11 281.70 1.51 3.38
7203.00 109.50 919.65 4.54
2005:12 281.80 1.69 3.37
-18632.00 109.10 964.64 4.47
2006:01 279.59 1.83 3.32
-17408.00 113.00 959.35 4.42
2006:02 280.90 1.93 3.42
29700.00 110.70 1015.71 4.57
2006:03 282.89 1.96 3.55
9000.00 111.10 1056.92 4.72
2006:04 284.32 2.05 3.84
17400.00 113.60 1050.03 4.99
2006:05 284.76 2.11 3.89
27000.00 115.00 972.79 5.11
2006:06 284.68 2.21 3.93
-1069.00 113.50 915.98 5.11
2006:07 284.19 2.28 3.96
1900.00 113.00 951.98 5.09
2006:08 284.38 2.43 3.84
-4900.00 115.70 972.59 4.88
2006:09 286.04 2.54 3.70
-2800.00 117.40 1040.65 4.72
2006:10 286.07 2.74 3.73
-3800.00 116.50 1088.30 4.73
2006:11 286.43 2.90 3.62
5500.00 116.50 1058.07 4.60
2006:12 286.43 3.00 3.65
-42300.00 119.80 1150.25 4.56
2007:01 285.01 3.21 3.90
9300.00 116.70 1177.35 4.76
2007:02 286.45 3.29 3.93
34600.00 118.40 1183.07 4.72
2007:03 288.33 3.26 3.79
7100.00 119.50 1214.63 4.56
2007:04 289.79 3.34 4.04
29920.00 118.10 1264.61 4.69
2007:05 289.48 3.40 4.15
50362.00 119.10 1269.04 4.75
2007:06 289.95 3.45 4.44
-4600.00 119.50 1241.22 5.10
2007:07 289.49 3.53 4.45
12400.00 118.90 1215.46 5.00
2007:08 289.41 3.58 4.25
9600.00 119.80 1200.75 4.67
2007:09 292.30 3.62 4.22
19400.00 119.90 1217.24 4.52
2007:10 293.85 3.81 4.31
1200.00 118.60 1173.31 4.53
2007:11 295.75 4.02 4.22
1860.00 120.70 1058.63 4.15
2007:12 296.32 4.12 4.31
-84800.00 120.40 1073.66 4.10
2008:01 294.09 4.11 4.08
25000.00 120.20 961.69 3.74
2008:02 295.28 4.21 4.02
56200.00 119.20 986.30 3.74
2008:03 298.08 4.24 3.92
10200.00 118.50 952.99 3.51
2008:04 299.67 4.14 4.06
23300.00 118.10 998.83 3.68
2008:05 300.99 4.11 4.18
13522.00 117.10 993.00 3.88
2008:06 302.45 4.17 4.43
13824.00 117.60 862.65 4.10
2008:07 302.11 4.34 4.37
51502.00 119.10 858.29 4.01
2008:08 301.98 4.40 4.11
100.00 117.30 862.93 3.89
2008:09 305.08 4.49 3.90
54035.00 114.90 821.38 3.69
Linear Regression - Estimation by Least Squares
Dependent Variable TAUX_10_ANS
Monthly Data From 1990:01 To 2008:09
Usable Observations 225 Degrees of Freedom 218
Centered R**2 0.960184 R Bar **2 0.959088
Uncentered R**2 0.993834 T x R**2 223.613
Mean of Dependent Variable 6.7397777778
Std Error of Dependent Variable 2.8914775394
Standard Error of Estimate 0.5848516116
Sum of Squared Residuals 74.567206864
Regression F(6,218) 876.1922
Significance Level of F 0.00000000
Log Likelihood -195.01622
Durbin-Watson Statistic 0.238221
Variable Coeff Std Error
T-Stat Signif
*******************************************************************************
1. Constant -6.653606464 1.580955568
-4.20860 0.00003756
2. TAUX_3_MOIS 0.361912318 0.024325796
14.87772 0.00000000
3. CPI 0.017997736 0.006326675
2.84474 0.00486809
4. DEFICIT -0.000003113 0.000002281
-1.36467 0.17376470
5. PRODUCTION_INDUS 0.014824249 0.008566591
1.73047 0.08496104
6. MSCI_SUEDE -0.002421413 0.000254604
-9.51049 0.00000000
7. TAUX_LONG_US 1.186074485 0.068102117
17.41612 0.00000000
Linear Regression - Estimation by Least Squares
Dependent Variable LTAUX_10_ANS
Monthly Data From 1990:01 To 2008:09
Usable Observations 106 Degrees of Freedom 99
Total Observations 225 Skipped/Missing 119
Centered R**2 0.956662 R Bar **2 0.954035
Uncentered R**2 0.998063 T x R**2 105.795
Mean of Dependent Variable 1.6991656832
Std Error of Dependent Variable 0.3692421999
Standard Error of Estimate 0.0791635284
Sum of Squared Residuals 0.6204195582
Regression F(6,99) 364.2241
Significance Level of F 0.00000000
Log Likelihood 122.05483
Durbin-Watson Statistic 0.524207
Variable Coeff Std Error
T-Stat Signif
*******************************************************************************
1. Constant 0.341426516 1.312753259
0.26008 0.79533889
2. LTAUX_3_MOIS 0.265689388 0.026881877
9.88359 0.00000000
3. LCPI 0.127110479 0.267243222
0.47564 0.63538161
4. LDEFICIT -0.010941434 0.006245397
-1.75192 0.08288417
5. LPRODUCTION_INDU 0.092177250 0.184784604
0.49884 0.61900138
6. LMSCI_SUEDE -0.203444846 0.036010874
-5.64954 0.00000015
7. LTAUX_LONG_US 0.763112431 0.082162844
9.28780 0.00000000
s du modele lineaire = 0.58485
s du modele en LOG = 0.43298
Information Criteria for ADF Lag Lengths, Series
TAUX_10_ANS
Lags AIC BIC HQ MAIC
0 -2.542 -2.512 -2.530 -2.372
1 -2.726* -2.680* -2.707* -2.439
2 -2.713 -2.652 -2.688 -2.447
3 -2.706 -2.629 -2.675 -2.430
4 -2.698 -2.605 -2.660 -2.463
5 -2.686 -2.578 -2.642 -2.476*
6 -2.676 -2.552 -2.626 -2.449
7 -2.699 -2.559 -2.643 -2.344
8 -2.685 -2.529 -2.622 -2.314
9 -2.673 -2.500 -2.603 -2.304
10 -2.678 -2.490 -2.602 -2.395
11 -2.668 -2.463 -2.585 -2.421
12 -2.668 -2.446 -2.578 -2.446
TEST UTILISANT LA PROCEDURE DFUNIT5.SRC
***************************************************
ETUDE DE L INTEGRATION DE LA SERIE TAUX_10_ANS
***************************************************
********* avec trend et constante
Linear Regression - Estimation by Least Squares
Dependent Variable dTAUX_10_ANS
Monthly Data From 1990:03 To 2008:09
Usable Observations 223 Degrees of Freedom 219
Centered R**2 0.170889 R Bar **2 0.159531
Uncentered R**2 0.191726 T x R**2 42.755
Mean of Dependent Variable -0.044125561
Std Error of Dependent Variable 0.275437445
Standard Error of Estimate 0.252513031
Sum of Squared Residuals 13.964059907
Regression F(3,219) 15.0461
Significance Level of F 0.00000001
Log Likelihood -7.49193
Durbin-Watson Statistic 2.013781
Variable Coeff Std Error
T-Stat Signif
*******************************************************************************
1. TAUX_10_ANS{1} -0.039282117 0.013616926
-2.88480 0.00430782
2. Constant 0.373229679 0.158151933
2.35994 0.01915640
3. TENDANCE -0.001216502 0.000607883
-2.00121 0.04660385
4. dTAUX_10_ANS{1} 0.368018142 0.060902037
6.04279 0.00000001
valeur de la statistique de Durbin h= -0.24747
statistique Q( 29 )= 36.23670 niveau de
significativité 0.1668
statistique Q modifiée
statistique Q( 29 - 1 )= 36.23670 niveau de
significativité 0.1367
calcul de phi3 avec H0 (a,0,1) : 5.10791
*****modele sans le trend avec la constante
Linear Regression - Estimation by Least Squares
Dependent Variable dTAUX_10_ANS
Monthly Data From 1990:03 To 2008:09
Usable Observations 223 Degrees of Freedom 220
Centered R**2 0.155727 R Bar **2 0.148052
Uncentered R**2 0.176945 T x R**2 39.459
Mean of Dependent Variable -0.044125561
Std Error of Dependent Variable 0.275437445
Standard Error of Estimate 0.254231644
Sum of Squared Residuals 14.219420374
Regression F(2,220) 20.2896
Significance Level of F 0.00000001
Log Likelihood -9.51251
Durbin-Watson Statistic 1.989878
Variable Coeff Std Error
T-Stat Signif
*******************************************************************************
1. TAUX_10_ANS{1} -0.014734293 0.005952439
-2.47534 0.01406609
2. Constant 0.068764351 0.043483132
1.58140 0.11522252
3. dTAUX_10_ANS{1} 0.350189795 0.060656967
5.77328 0.00000003
calcul de phi1 avec H0 (0,0,1) : 4.59659
******** sans trend ni constante
Linear Regression - Estimation by Least Squares
Dependent Variable dTAUX_10_ANS
Monthly Data From 1990:03 To 2008:09
Usable Observations 223 Degrees of Freedom 221
Centered R**2 0.146130 R Bar **2 0.142266
Uncentered R**2 0.167589 T x R**2 37.372
Mean of Dependent Variable -0.044125561
Std Error of Dependent Variable 0.275437445
Standard Error of Estimate 0.255093441
Sum of Squared Residuals 14.381058676
Log Likelihood -10.77283
Durbin-Watson Statistic 1.980581
Variable Coeff Std Error
T-Stat Signif
*******************************************************************************
1. TAUX_10_ANS{1} -0.006088013 0.002361328
-2.57822 0.01058064
2. dTAUX_10_ANS{1} 0.348205177 0.060849554
5.72239 0.00000003
Information Criteria for ADF Lag Lengths, Series
TAUX_3_MOIS
Lags AIC BIC HQ MAIC
0 -1.544 -1.513 -1.531 -1.471
1 -1.666 -1.621* -1.648 -1.492
2 -1.659 -1.597 -1.634 -1.484
3 -1.679 -1.602 -1.648 -1.556
4 -1.671 -1.579 -1.634 -1.562*
5 -1.658 -1.550 -1.615 -1.549
6 -1.645 -1.521 -1.595 -1.530
7 -1.641 -1.501 -1.585 -1.496
8 -1.715 -1.559 -1.652 -1.542
9 -1.745 -1.572 -1.675* -1.480
10 -1.741 -1.552 -1.665 -1.411
11 -1.740 -1.534 -1.657 -1.459
12 -1.748* -1.526 -1.659 -1.513
TEST UTILISANT LA PROCEDURE DFUNIT5.SRC
***************************************************
ETUDE DE L INTEGRATION DE LA SERIE TAUX_3_MOIS
***************************************************
********* avec trend et constante
Linear Regression - Estimation by Least Squares
Dependent Variable dTAUX_3_MOIS
Monthly Data From 1990:03 To 2008:09
Usable Observations 223 Degrees of Freedom 219
Centered R**2 0.035493 R Bar **2 0.022281
Uncentered R**2 0.046475 T x R**2 10.364
Mean of Dependent Variable -0.046839910
Std Error of Dependent Variable 0.437431998
Standard Error of Estimate 0.432531435
Sum of Squared Residuals 40.971273929
Regression F(3,219) 2.6863
Significance Level of F 0.04743311
Log Likelihood -127.50878
Durbin-Watson Statistic 2.002672
Variable Coeff Std Error
T-Stat Signif
*******************************************************************************
1. TAUX_3_MOIS{1} -0.028688093 0.015893913
-1.80497 0.07245237
2. Constant 0.166523389 0.187756120
0.88691 0.37609854
3. TENDANCE -0.000422283 0.000887460
-0.47583 0.63466774
4. dTAUX_3_MOIS{1} 0.041556306 0.063699461
0.65238 0.51483971
valeur de la statistique de Durbin h= -0.06467
statistique Q( 29 )= 69.54982 niveau de
significativité 0.0000
statistique Q modifiée
statistique Q( 29 - 1 )= 69.54982 niveau de
significativité 0.0000
calcul de phi3 avec H0 (a,0,1) : 3.86732
*****modele sans le trend avec la constante
Linear Regression - Estimation by Least Squares
Dependent Variable dTAUX_3_MOIS
Monthly Data From 1990:03 To 2008:09
Usable Observations 223 Degrees of Freedom 220
Centered R**2 0.034496 R Bar **2 0.025718
Uncentered R**2 0.045489 T x R**2 10.144
Mean of Dependent Variable -0.046839910
Std Error of Dependent Variable 0.437431998
Standard Error of Estimate 0.431770313
Sum of Squared Residuals 41.013632790
Regression F(2,220) 3.9301
Significance Level of F 0.02103577
Log Likelihood -127.62399
Durbin-Watson Statistic 2.001382
Variable Coeff Std Error
T-Stat Signif
*******************************************************************************
1. TAUX_3_MOIS{1} -0.022179475 0.008080121
-2.74494 0.00655223
2. Constant 0.081039074 0.054470738
1.48775 0.13824760
3. dTAUX_3_MOIS{1} 0.035926701 0.062480973
0.57500 0.56587733
calcul de phi1 avec H0 (0,0,1) : 4.99859
******** sans trend ni constante
Linear Regression - Estimation by Least Squares
Dependent Variable dTAUX_3_MOIS
Monthly Data From 1990:03 To 2008:09
Usable Observations 223 Degrees of Freedom 221
Centered R**2 0.024782 R Bar **2 0.020369
Uncentered R**2 0.035886 T x R**2 8.003
Mean of Dependent Variable -0.046839910
Std Error of Dependent Variable 0.437431998
Standard Error of Estimate 0.432954020
Sum of Squared Residuals 41.426269613
Log Likelihood -128.74019
Durbin-Watson Statistic 1.992870
Variable Coeff Std Error
T-Stat Signif
*******************************************************************************
1. TAUX_3_MOIS{1} -0.012004423 0.004314547
-2.78231 0.00586400
2. dTAUX_3_MOIS{1} 0.031842595 0.062591766
0.50873 0.61144579
Information Criteria for ADF Lag Lengths, Series CPI
Lags AIC BIC HQ MAIC
0 0.435 0.465 0.447 8.553
1 0.418 0.463 0.436 6.734
2 0.330 0.391 0.355 4.893
3 0.320 0.397 0.351 7.528
4 0.322 0.415 0.360 7.266
5 0.313 0.421 0.357 6.237
6 0.215 0.339 0.265 1.868
7 0.218 0.358 0.275 1.366
8 0.229 0.385 0.292 1.355
9 0.241 0.413 0.311 1.600
10 0.251 0.440 0.328 1.754
11 0.258 0.463 0.341 1.467
12 0.059 0.281 0.149 0.721*
13 -0.035 0.204* 0.062 2.319
14 -0.032 0.223 0.071 1.365
15 -0.050* 0.222 0.060* 1.731
TEST UTILISANT LA PROCEDURE DFUNIT5.SRC
***************************************************
ETUDE DE L INTEGRATION DE LA SERIE CPI
***************************************************
********* avec trend et constante
Linear Regression - Estimation by Least Squares
Dependent Variable dCPI
Monthly Data From 1991:02 To 2008:09
Usable Observations 212 Degrees of Freedom 197
Centered R**2 0.342998 R Bar **2 0.296307
Uncentered R**2 0.413036 T x R**2 87.564
Mean of Dependent Variable 0.4065094340
Std Error of Dependent Variable 1.1796027466
Standard Error of Estimate 0.9895260611
Sum of Squared Residuals 192.89487964
Regression F(14,197) 7.3462
Significance Level of F 0.00000000
Log Likelihood -290.80423
Durbin-Watson Statistic 2.049369
Variable Coeff Std Error
T-Stat Signif
*******************************************************************************
1. CPI{1} -0.032426297 0.017156388
-1.89004 0.06022066
2. Constant 7.433152605 3.914249183
1.89900 0.05902608
3. TENDANCE 0.010754268 0.005197456
2.06914 0.03983810
4. dCPI{1} 0.172187102 0.063704770
2.70289 0.00747431
5. dCPI{2} -0.160341736 0.064729103
-2.47712 0.01408690
6. dCPI{3} 0.046186345 0.065376015
0.70647 0.48072918
7. dCPI{4} -0.083206843 0.065584401
-1.26870 0.20604561
8. dCPI{5} 0.072265777 0.065671451
1.10041 0.27249463
9. dCPI{6} 0.127029214 0.065677414
1.93414 0.05452877
10. dCPI{7} 0.111761023 0.065257293
1.71262 0.08835566
11. dCPI{8} -0.066372627 0.065583604
-1.01203 0.31276470
12. dCPI{9} 0.039110703 0.065616402
0.59605 0.55182558
13. dCPI{10} -0.114495129 0.064993761
-1.76163 0.07968256
14. dCPI{11} 0.061092617 0.062484246
0.97773 0.32940783
15. dCPI{12} 0.292979890 0.062002093
4.72532 0.00000436
valeur de la statistique de Durbin h= -0.96180
statistique Q( 29 )= 44.03594 niveau de
significativité 0.0364
statistique Q modifiée
statistique Q( 29 - 12 )= 44.03594 niveau de
significativité 0.0003
calcul de phi3 avec H0 (a,0,1) : 2.29181
*****modele sans le trend avec la constante
Linear Regression - Estimation by Least Squares
Dependent Variable dCPI
Monthly Data From 1991:02 To 2008:09
Usable Observations 212 Degrees of Freedom 198
Centered R**2 0.328720 R Bar **2 0.284646
Uncentered R**2 0.400280 T x R**2 84.859
Mean of Dependent Variable 0.4065094340
Std Error of Dependent Variable 1.1796027466
Standard Error of Estimate 0.9976917990
Sum of Squared Residuals 197.08700732
Regression F(13,198) 7.4584
Significance Level of F 0.00000000
Log Likelihood -293.08322
Durbin-Watson Statistic 2.075345
Variable Coeff Std Error
T-Stat Signif
*******************************************************************************
1. CPI{1} 0.002143748 0.003931285
0.54530 0.58615770
2. Constant -0.367065314 1.062287599
-0.34554 0.73005354
3. dCPI{1} 0.169243237 0.064214452
2.63559 0.00906429
4. dCPI{2} -0.170173726 0.065087171
-2.61455 0.00962174
5. dCPI{3} 0.043260726 0.065900091
0.65646 0.51229087
6. dCPI{4} -0.085607951 0.066115262
-1.29483 0.19688714
7. dCPI{5} 0.074380823 0.066205361
1.12349 0.26259131
8. dCPI{6} 0.126308426 0.066218464
1.90745 0.05790961
9. dCPI{7} 0.111013824 0.065794800
1.68727 0.09312547
10. dCPI{8} -0.070942573 0.066087304
-1.07347 0.28436793
11. dCPI{9} 0.037411897 0.066152701
0.56554 0.57234786
12. dCPI{10} -0.120085921 0.065473448
-1.83412 0.06813763
13. dCPI{11} 0.068156160 0.062905783
1.08346 0.27992007
14. dCPI{12} 0.295899021 0.062497560
4.73457 0.00000418
calcul de phi1 avec H0 (0,0,1) : 2.37535
******** sans trend ni constante
Linear Regression - Estimation by Least Squares
Dependent Variable dCPI
Monthly Data From 1991:02 To 2008:09
Usable Observations 212 Degrees of Freedom 199
Centered R**2 0.328315 R Bar **2 0.287811
Uncentered R**2 0.399918 T x R**2 84.783
Mean of Dependent Variable 0.4065094340
Std Error of Dependent Variable 1.1796027466
Standard Error of Estimate 0.9954818945
Sum of Squared Residuals 197.20585625
Log Likelihood -293.14713
Durbin-Watson Statistic 2.070030
Variable Coeff Std Error
T-Stat Signif
*******************************************************************************
1. CPI{1} 0.000791277 0.000366872
2.15682 0.03221873
2. dCPI{1} 0.168562957 0.064042096
2.63206 0.00915229
3. dCPI{2} -0.170630484 0.064929608
-2.62793 0.00926042
4. dCPI{3} 0.042546598 0.065721779
0.64737 0.51813575
5. dCPI{4} -0.086534489 0.065914540
-1.31283 0.19075268
6. dCPI{5} 0.073145189 0.065962286
1.10889 0.26881420
7. dCPI{6} 0.124847963 0.065937063
1.89344 0.05975017
8. dCPI{7} 0.108283350 0.065173878
1.66145 0.09819701
9. dCPI{8} -0.073898664 0.065386098
-1.13019 0.25975686
10. dCPI{9} 0.034692704 0.065537486
0.52936 0.59714808
11. dCPI{10} -0.122482910 0.064960722
-1.88549 0.06082050
12. dCPI{11} 0.064931885 0.062072082
1.04607 0.29679660
13. dCPI{12} 0.292505269 0.061584293
4.74967 0.00000389
Information Criteria for ADF Lag Lengths, Series DEFICIT
Lags AIC BIC HQ MAIC
0 19.659 19.690 19.672 21.065
1 19.661 19.707 19.679 20.781
2 19.653 19.714 19.678 20.458
3 19.652 19.729 19.683 20.268
4 19.666 19.758 19.703 20.302
5 19.670 19.778 19.714 20.170
6 19.673 19.797 19.723 20.318
7 19.658 19.798 19.715 20.053
8 19.662 19.818 19.725 19.954
9 19.676 19.849 19.746 19.964
10 19.662 19.851 19.738 19.834
11 19.203* 19.408* 19.286* 19.190*
12 19.214 19.436 19.304 19.199
13 19.227 19.465 19.323 19.214
14 19.239 19.494 19.342 19.226
15 19.250 19.522 19.360 19.242
TEST UTILISANT LA PROCEDURE DFUNIT5.SRC
***************************************************
ETUDE DE L INTEGRATION DE LA SERIE DEFICIT
***************************************************
********* avec trend et constante
Linear Regression - Estimation by Least Squares
Dependent Variable dDEFICIT
Monthly Data From 1991:01 To 2008:09
Usable Observations 213 Degrees of Freedom 199
Centered R**2 0.688280 R Bar **2 0.667916
Uncentered R**2 0.688330 T x R**2 146.614
Mean of Dependent Variable 313.347418
Std Error of Dependent Variable 24638.300796
Standard Error of Estimate 14198.242610
Sum of Squared Residuals 40116428547
Regression F(13,199) 33.7995
Significance Level of F 0.00000000
Log Likelihood -2331.45931
Durbin-Watson Statistic 2.014634
Variable Coeff Std Error
T-Stat Signif
*******************************************************************************
1. DEFICIT{1} -0.319399 0.175610
-1.81879 0.07044633
2. Constant -5857.583003 2983.352622
-1.96342 0.05099008
3. TENDANCE 50.609064 21.576127
2.34560 0.01998058
4. dDEFICIT{1} -0.693973 0.170907
-4.06052 0.00007037
5. dDEFICIT{2} -0.676218 0.163698
-4.13087 0.00005319
6. dDEFICIT{3} -0.686915 0.157265
-4.36788 0.00002017
7. dDEFICIT{4} -0.640868 0.147643
-4.34064 0.00002260
8. dDEFICIT{5} -0.644131 0.136123
-4.73198 0.00000421
9. dDEFICIT{6} -0.616464 0.127652
-4.82926 0.00000273
10. dDEFICIT{7} -0.706987 0.116596
-6.06355 0.00000001
11. dDEFICIT{8} -0.695660 0.111427
-6.24319 0.00000000
12. dDEFICIT{9} -0.701659 0.102373
-6.85392 0.00000000
13. dDEFICIT{10} -0.776299 0.085957
-9.03126 0.00000000
14. dDEFICIT{11} -0.687134 0.064237
-10.69679 0.00000000
valeur de la statistique de Durbin h= NA
dans le modèle residusaic en fonction de residusaic{1}
et des variables explicatives du modèle
on regarde le t de student de residusaic{1} t=
-0.55237
statistique Q( 29 )= 16.32986 niveau de
significativité 0.9716
statistique Q modifiée
statistique Q( 29 - 11 )= 16.32986 niveau de
significativité 0.5695
calcul de phi3 avec H0 (a,0,1) : 2.80128
*****modele sans le trend avec la constante
Linear Regression - Estimation by Least Squares
Dependent Variable dDEFICIT
Monthly Data From 1991:01 To 2008:09
Usable Observations 213 Degrees of Freedom 200
Centered R**2 0.679662 R Bar **2 0.660441
Uncentered R**2 0.679714 T x R**2 144.779
Mean of Dependent Variable 313.347418
Std Error of Dependent Variable 24638.300796
Standard Error of Estimate 14357.149667
Sum of Squared Residuals 41225549313
Regression F(12,200) 35.3616
Significance Level of F 0.00000000
Log Likelihood -2334.36380
Durbin-Watson Statistic 2.014462
Variable Coeff Std Error
T-Stat Signif
*******************************************************************************
1. DEFICIT{1} -0.041080 0.130909
-0.31381 0.75399484
2. Constant 726.858298 1021.432449
0.71161 0.47753746
3. dDEFICIT{1} -0.944739 0.134833
-7.00672 0.00000000
4. dDEFICIT{2} -0.899839 0.134561
-6.68720 0.00000000
5. dDEFICIT{3} -0.884755 0.134219
-6.59186 0.00000000
6. dDEFICIT{4} -0.812186 0.129748
-6.25970 0.00000000
7. dDEFICIT{5} -0.792341 0.121919
-6.49893 0.00000000
8. dDEFICIT{6} -0.741720 0.117243
-6.32633 0.00000000
9. dDEFICIT{7} -0.811673 0.108922
-7.45187 0.00000000
10. dDEFICIT{8} -0.778273 0.106898
-7.28055 0.00000000
11. dDEFICIT{9} -0.764050 0.099964
-7.64326 0.00000000
12. dDEFICIT{10} -0.818040 0.085036
-9.61995 0.00000000
13. dDEFICIT{11} -0.705951 0.064448
-10.95385 0.00000000
calcul de phi1 avec H0 (0,0,1) : 0.38909
******** sans trend ni constante
Linear Regression - Estimation by Least Squares
Dependent Variable dDEFICIT
Monthly Data From 1991:01 To 2008:09
Usable Observations 213 Degrees of Freedom 201
Centered R**2 0.678850 R Bar **2 0.661275
Uncentered R**2 0.678903 T x R**2 144.606
Mean of Dependent Variable 313.347418
Std Error of Dependent Variable 24638.300796
Standard Error of Estimate 14339.509689
Sum of Squared Residuals 41329929161
Log Likelihood -2334.63311
Durbin-Watson Statistic 2.008139
Variable Coeff Std Error
T-Stat Signif
*******************************************************************************
1. DEFICIT{1} -0.065801012 0.126060203
-0.52198 0.60225841
2. dDEFICIT{1} -0.920743473 0.130388357
-7.06155 0.00000000
3. dDEFICIT{2} -0.876871556 0.130472694
-6.72073 0.00000000
4. dDEFICIT{3} -0.863268389 0.130618160
-6.60910 0.00000000
5. dDEFICIT{4} -0.792796366 0.126699343
-6.25730 0.00000000
6. dDEFICIT{5} -0.774845065 0.119267047
-6.49672 0.00000000
7. dDEFICIT{6} -0.726318540 0.115086846
-6.31105 0.00000000
8. dDEFICIT{7} -0.798462506 0.107196438
-7.44859 0.00000000
9. dDEFICIT{8} -0.767941588 0.105776894
-7.26001 0.00000000
10. dDEFICIT{9} -0.757151619 0.099370512
-7.61948 0.00000000
11. dDEFICIT{10} -0.813312442 0.084671680
-9.60548 0.00000000
12. dDEFICIT{11} -0.703673101 0.064289115
-10.94545 0.00000000
Information Criteria for ADF Lag Lengths, Series
PRODUCTION_INDUS
Lags AIC BIC HQ MAIC
0 0.778 0.808 0.790 0.884
1 0.706 0.752 0.725 0.760
2 0.603 0.665* 0.628 0.610*
3 0.615 0.692 0.646 0.627
4 0.597 0.690 0.634 0.634
5 0.610 0.719 0.654 0.656
6 0.599 0.723 0.649 0.728
7 0.598 0.738 0.654 0.756
8 0.603 0.759 0.666 0.831
9 0.603 0.776 0.673 0.903
10 0.611 0.800 0.687 0.841
11 0.579 0.784 0.662 0.972
12 0.505* 0.727 0.595* 0.685
TEST UTILISANT LA PROCEDURE DFUNIT5.SRC
***************************************************
ETUDE DE L INTEGRATION DE LA SERIE PRODUCTION_INDUS
***************************************************
********* avec trend et constante
Linear Regression - Estimation by Least Squares
Dependent Variable dPRODUCTION_INDU
Monthly Data From 1990:04 To 2008:09
Usable Observations 222 Degrees of Freedom 217
Centered R**2 0.197082 R Bar **2 0.182281
Uncentered R**2 0.213941 T x R**2 47.495
Mean of Dependent Variable 0.2153153153
Std Error of Dependent Variable 1.4735494868
Standard Error of Estimate 1.3324984473
Sum of Squared Residuals 385.29480829
Regression F(4,217) 13.3160
Significance Level of F 0.00000000
Log Likelihood -376.20214
Durbin-Watson Statistic 1.979995
Variable Coeff Std Error
T-Stat Signif
*******************************************************************************
1. PRODUCTION_INDUS{1} -0.055787886 0.029494035
-1.89150 0.05988985
2. Constant 3.740936707 1.784529266
2.09632 0.03721299
3. TENDANCE 0.015183630 0.008141068
1.86507 0.06352200
4. dPRODUCTION_INDU{1} -0.357191470 0.066614047
-5.36210 0.00000021
5. dPRODUCTION_INDU{2} -0.318289509 0.065384321
-4.86798 0.00000217
valeur de la statistique de Durbin h= 1.22134
statistique Q( 29 )= 69.61881 niveau de
significativité 0.0000
statistique Q modifiée
statistique Q( 29 - 2 )= 69.61881 niveau de
significativité 0.0000
calcul de phi3 avec H0 (a,0,1) : 1.78892
*****modele sans le trend avec la constante
Linear Regression - Estimation by Least Squares
Dependent Variable dPRODUCTION_INDU
Monthly Data From 1990:04 To 2008:09
Usable Observations 222 Degrees of Freedom 218
Centered R**2 0.184211 R Bar **2 0.172984
Uncentered R**2 0.201340 T x R**2 44.698
Mean of Dependent Variable 0.2153153153
Std Error of Dependent Variable 1.4735494868
Standard Error of Estimate 1.3400517171
Sum of Squared Residuals 391.47101580
Regression F(3,218) 16.4086
Significance Level of F 0.00000000
Log Likelihood -377.96734
Durbin-Watson Statistic 1.992366
Variable Coeff Std Error
T-Stat Signif
*******************************************************************************
1. PRODUCTION_INDUS{1} -0.001594050 0.005085326
-0.31346 0.75423029
2. Constant 0.530458015 0.473211454
1.12097 0.26353200
3. dPRODUCTION_INDU{1} -0.389245881 0.064723556
-6.01398 0.00000001
4. dPRODUCTION_INDU{2} -0.337115635 0.064966645
-5.18906 0.00000048
calcul de phi1 avec H0 (0,0,1) : 8.58537
******** sans trend ni constante
Linear Regression - Estimation by Least Squares
Dependent Variable dPRODUCTION_INDU
Monthly Data From 1990:04 To 2008:09
Usable Observations 222 Degrees of Freedom 219
Centered R**2 0.179509 R Bar **2 0.172016
Uncentered R**2 0.196737 T x R**2 43.676
Mean of Dependent Variable 0.2153153153
Std Error of Dependent Variable 1.4735494868
Standard Error of Estimate 1.3408365007
Sum of Squared Residuals 393.72751226
Log Likelihood -378.60532
Durbin-Watson Statistic 1.989685
Variable Coeff Std Error
T-Stat Signif
*******************************************************************************
1. PRODUCTION_INDUS{1} 0.003994852 0.001001990
3.98692 0.00009122
2. dPRODUCTION_INDU{1} -0.390361356 0.064753806
-6.02839 0.00000001
3. dPRODUCTION_INDU{2} -0.337314236 0.065004450
-5.18909 0.00000048
Information Criteria for ADF Lag Lengths, Series MSCI_SUEDE
Lags AIC BIC HQ MAIC
0 7.599 7.630* 7.612 7.640*
1 7.589* 7.635 7.607* 7.645
2 7.591 7.652 7.616 7.661
3 7.590 7.666 7.621 7.678
4 7.603 7.695 7.640 7.689
5 7.615 7.724 7.659 7.709
6 7.627 7.751 7.677 7.732
7 7.637 7.777 7.693 7.755
8 7.646 7.802 7.709 7.781
9 7.657 7.830 7.727 7.809
10 7.667 7.856 7.744 7.845
11 7.671 7.876 7.754 7.811
12 7.681 7.903 7.771 7.845
TEST UTILISANT LA PROCEDURE DFUNIT5.SRC
***************************************************
ETUDE DE L INTEGRATION DE LA SERIE MSCI_SUEDE
***************************************************
********* avec trend et constante
Linear Regression - Estimation by Least Squares
Dependent Variable dMSCI_SUEDE
Monthly Data From 1990:02 To 2008:09
Usable Observations 224 Degrees of Freedom 221
Centered R**2 0.009555 R Bar **2 0.000592
Uncentered R**2 0.013313 T x R**2 2.982
Mean of Dependent Variable 2.742857143
Std Error of Dependent Variable 44.545441220
Standard Error of Estimate 44.532251790
Sum of Squared Residuals 438269.84034
Regression F(2,221) 1.0661
Significance Level of F 0.34612764
Log Likelihood -1166.68396
Durbin-Watson Statistic 1.684602
Variable Coeff Std Error
T-Stat Signif
*******************************************************************************
1. MSCI_SUEDE{1} -0.019755536 0.014628812
-1.35045 0.17825170
2. Constant 8.157755504 6.292599038
1.29640 0.19618814
3. TENDANCE 0.060147001 0.078387376
0.76730 0.44371935
statistique Q( 29 ) 54.66247 niveau de
significativité 0.0027
calcul de phi3 avec H0 (a,0,1) : 1.06606
*****modele sans le trend avec la constante
Linear Regression - Estimation by Least Squares
Dependent Variable dMSCI_SUEDE
Monthly Data From 1990:02 To 2008:09
Usable Observations 224 Degrees of Freedom 222
Centered R**2 0.006917 R Bar **2 0.002443
Uncentered R**2 0.010685 T x R**2 2.393
Mean of Dependent Variable 2.742857143
Std Error of Dependent Variable 44.545441220
Standard Error of Estimate 44.490985823
Sum of Squared Residuals 439437.41593
Regression F(1,222) 1.5462
Significance Level of F 0.21500552
Log Likelihood -1166.98194
Durbin-Watson Statistic 1.695379
Variable Coeff Std Error
T-Stat Signif
*******************************************************************************
1. MSCI_SUEDE{1} -0.010668267 0.008579419
-1.24347 0.21500552
2. Constant 9.353483823 6.090935829
1.53564 0.12605069
calcul de phi1 avec H0 (0,0,1) : 1.19879
******** sans trend ni constante
Linear Regression - Estimation by Least Squares
Dependent Variable dMSCI_SUEDE
Monthly Data From 1990:02 To 2008:09
Usable Observations 224 Degrees of Freedom 223
Centered R**2 -0.003632 R Bar **2 -0.003632
Uncentered R**2 0.000176 T x R**2 0.039
Mean of Dependent Variable 2.742857143
Std Error of Dependent Variable 44.545441220
Standard Error of Estimate 44.626267151
Sum of Squared Residuals 444105.32953
Log Likelihood -1168.16538
Durbin-Watson Statistic 1.696903
Variable Coeff Std Error
T-Stat Signif
*******************************************************************************
1. MSCI_SUEDE{1} 0.0008309936 0.0041999142
0.19786 0.84333511
Information Criteria for ADF Lag Lengths, Series
TAUX_LONG_US
Lags AIC BIC HQ MAIC
0 -3.006 -2.976 -2.994 -2.698*
1 -3.084 -3.039* -3.066* -2.500
2 -3.085* -3.024 -3.060 -2.541
3 -3.082 -3.005 -3.051 -2.374
4 -3.068 -2.976 -3.031 -2.375
5 -3.076 -2.968 -3.033 -2.572
6 -3.074 -2.949 -3.023 -2.414
7 -3.071 -2.930 -3.014 -2.243
8 -3.065 -2.909 -3.002 -2.030
9 -3.053 -2.881 -2.984 -2.055
10 -3.046 -2.857 -2.970 -2.243
11 -3.036 -2.830 -2.953 -2.285
12 -3.059 -2.838 -2.970 -2.368
TEST UTILISANT LA PROCEDURE DFUNIT5.SRC
***************************************************
ETUDE DE L INTEGRATION DE LA SERIE TAUX_LONG_US
***************************************************
********* avec trend et constante
Linear Regression - Estimation by Least Squares
Dependent Variable dTAUX_LONG_US
Monthly Data From 1990:02 To 2008:09
Usable Observations 224 Degrees of Freedom 221
Centered R**2 0.031285 R Bar **2 0.022518
Uncentered R**2 0.039255 T x R**2 8.793
Mean of Dependent Variable -0.020178571
Std Error of Dependent Variable 0.222038990
Standard Error of Estimate 0.219524820
Sum of Squared Residuals 10.650243419
Regression F(2,221) 3.5686
Significance Level of F 0.02983172
Log Likelihood 23.31686
Durbin-Watson Statistic 1.407650
Variable Coeff Std Error
T-Stat Signif
*******************************************************************************
1. TAUX_LONG_US{1} -0.060979521 0.022925293
-2.65992 0.00838848
2. Constant 0.449772970 0.181523348
2.47777 0.01396977
3. TENDANCE -0.001065279 0.000478859
-2.22462 0.02711802
statistique Q( 29 ) 74.32314 niveau de
significativité 0.0000
calcul de phi3 avec H0 (a,0,1) : 3.56860
*****modele sans le trend avec la constante
Linear Regression - Estimation by Least Squares
Dependent Variable dTAUX_LONG_US
Monthly Data From 1990:02 To 2008:09
Usable Observations 224 Degrees of Freedom 222
Centered R**2 0.009592 R Bar **2 0.005131
Uncentered R**2 0.017741 T x R**2 3.974
Mean of Dependent Variable -0.020178571
Std Error of Dependent Variable 0.222038990
Standard Error of Estimate 0.221468660
Sum of Squared Residuals 10.888737515
Regression F(1,222) 2.1500
Significance Level of F 0.14398237
Log Likelihood 20.83648
Durbin-Watson Statistic 1.439229
Variable Coeff Std Error
T-Stat Signif
*******************************************************************************
1. TAUX_LONG_US{1} -0.016064385 0.010955749
-1.46630 0.14398237
2. Constant 0.071772820 0.064432141
1.11393 0.26651428
calcul de phi1 avec H0 (0,0,1) : 2.00478
******** sans trend ni constante
Linear Regression - Estimation by Least Squares
Dependent Variable dTAUX_LONG_US
Monthly Data From 1990:02 To 2008:09
Usable Observations 224 Degrees of Freedom 223
Centered R**2 0.004056 R Bar **2 0.004056
Uncentered R**2 0.012250 T x R**2 2.744
Mean of Dependent Variable -0.020178571
Std Error of Dependent Variable 0.222038990
Standard Error of Estimate 0.221588219
Sum of Squared Residuals 10.949598566
Log Likelihood 20.21221
Durbin-Watson Statistic 1.448291
Variable Coeff Std Error
T-Stat Signif
*******************************************************************************
1. TAUX_LONG_US{1} -0.004186660 0.002517458
-1.66305 0.09770704
Information Criteria for ADF Lag Lengths, Series
DTAUX_10_ANS
Lags AIC BIC HQ MAIC
0 -2.707* -2.677* -2.695* -1.813
1 -2.697 -2.651 -2.679 -1.843
2 -2.690 -2.629 -2.666 -1.968
3 -2.686 -2.609 -2.655 -1.990*
4 -2.677 -2.584 -2.639 -1.969
5 -2.666 -2.557 -2.622 -1.875
6 -2.680 -2.555 -2.630 -1.921
7 -2.666 -2.525 -2.609 -1.890
8 -2.654 -2.497 -2.591 -1.816
9 -2.667 -2.494 -2.597 -1.659
10 -2.659 -2.470 -2.583 -1.583
11 -2.661 -2.455 -2.578 -1.298
12 -2.658 -2.435 -2.568 -1.406
TEST UTILISANT LA PROCEDURE DFUNIT5.SRC
***************************************************
ETUDE DE L INTEGRATION DE LA SERIE DTAUX_10_ANS
***************************************************
********* avec trend et constante
Linear Regression - Estimation by Least Squares
Dependent Variable dDTAUX_10_ANS
Monthly Data From 1990:02 To 2008:09
Usable Observations 223 Degrees of Freedom 220
Total Observations 224 Skipped/Missing 1
Centered R**2 0.338630 R Bar **2 0.332617
Uncentered R**2 0.338779 T x R**2 75.548
Mean of Dependent Variable -0.004708520
Std Error of Dependent Variable 0.314199656
Standard Error of Estimate 0.256680727
Sum of Squared Residuals 14.494698991
Regression F(2,220) 56.3213
Significance Level of F 0.00000000
Log Likelihood -11.65044
Durbin-Watson Statistic 1.975990
Variable Coeff Std Error
T-Stat Signif
*******************************************************************************
1. DTAUX_10_ANS{1} -0.652321898 0.061490941
-10.60842 0.00000000
2. Constant -0.071826478 0.035372057
-2.03060 0.04349883
3. TENDANCE 0.000363205 0.000268287
1.35379 0.17719145
statistique Q( 29 ) 39.41266 niveau de
significativité 0.0940
calcul de phi3 avec H0 (a,0,1) : 56.32130
*****modele sans le trend avec la constante
Linear Regression - Estimation by Least Squares
Dependent Variable dDTAUX_10_ANS
Monthly Data From 1990:02 To 2008:09
Usable Observations 223 Degrees of Freedom 221
Total Observations 224 Skipped/Missing 1
Centered R**2 0.333120 R Bar **2 0.330102
Uncentered R**2 0.333270 T x R**2 74.319
Mean of Dependent Variable -0.004708520
Std Error of Dependent Variable 0.314199656
Standard Error of Estimate 0.257163875
Sum of Squared Residuals 14.615450136
Regression F(1,221) 110.3939
Significance Level of F 0.00000000
Log Likelihood -12.57547
Durbin-Watson Statistic 1.975734
Variable Coeff Std Error
T-Stat Signif
*******************************************************************************
1. DTAUX_10_ANS{1} -0.644216622 0.061313973
-10.50685 0.00000000
2. Constant -0.030101633 0.017389730
-1.73100 0.08484735
calcul de phi1 avec H0 (0,0,1) : 55.23431
******** sans trend ni constante
Linear Regression - Estimation by Least Squares
Dependent Variable dDTAUX_10_ANS
Monthly Data From 1990:02 To 2008:09
Usable Observations 223 Degrees of Freedom 222
Total Observations 224 Skipped/Missing 1
Centered R**2 0.324078 R Bar **2 0.324078
Uncentered R**2 0.324231 T x R**2 72.303
Mean of Dependent Variable -0.004708520
Std Error of Dependent Variable 0.314199656
Standard Error of Estimate 0.258317576
Sum of Squared Residuals 14.813609397
Log Likelihood -14.07705
Durbin-Watson Statistic 1.978649
Variable Coeff Std Error
T-Stat Signif
*******************************************************************************
1. DTAUX_10_ANS{1} -0.629466102 0.060991338
-10.32058 0.00000000
Information Criteria for ADF Lag Lengths, Series
DTAUX_3_MOIS
Lags AIC BIC HQ MAIC
0 -1.642 -1.611* -1.629 -0.027
1 -1.635 -1.589 -1.617 -0.271
2 -1.665 -1.604 -1.640 -0.082
3 -1.660 -1.583 -1.629 0.101
4 -1.647 -1.554 -1.610 0.003
5 -1.634 -1.525 -1.590 0.094
6 -1.626 -1.501 -1.575 0.194
7 -1.696 -1.556 -1.639 -0.681*
8 -1.714 -1.557 -1.650 -0.493
9 -1.703 -1.530 -1.633 -0.474
10 -1.710 -1.521 -1.633 -0.319
11 -1.726 -1.520 -1.642 0.009
12 -1.744* -1.522 -1.655* 0.183
TEST UTILISANT LA PROCEDURE DFUNIT5.SRC
***************************************************
ETUDE DE L INTEGRATION DE LA SERIE DTAUX_3_MOIS
***************************************************
********* avec trend et constante
Linear Regression - Estimation by Least Squares
Dependent Variable dDTAUX_3_MOIS
Monthly Data From 1990:02 To 2008:09
Usable Observations 223 Degrees of Freedom 220
Total Observations 224 Skipped/Missing 1
Centered R**2 0.521116 R Bar **2 0.516763
Uncentered R**2 0.521233 T x R**2 116.235
Mean of Dependent Variable -0.009739013
Std Error of Dependent Variable 0.625395449
Standard Error of Estimate 0.434745373
Sum of Squared Residuals 41.580778588
Regression F(2,220) 119.7008
Significance Level of F 0.00000000
Log Likelihood -129.15528
Durbin-Watson Statistic 1.990643
Variable Coeff Std Error
T-Stat Signif
*******************************************************************************
1. DTAUX_3_MOIS{1} -0.976915413 0.063193834
-15.45903 0.00000000
2. Constant -0.154998119 0.059648120
-2.59854 0.00999490
3. TENDANCE 0.000956269 0.000454274
2.10505 0.03642172
statistique Q( 29 ) 73.65630 niveau de
significativité 0.0000
calcul de phi3 avec H0 (a,0,1) : 119.70078
*****modele sans le trend avec la constante
Linear Regression - Estimation by Least Squares
Dependent Variable dDTAUX_3_MOIS
Monthly Data From 1990:02 To 2008:09
Usable Observations 223 Degrees of Freedom 221
Total Observations 224 Skipped/Missing 1
Centered R**2 0.511470 R Bar **2 0.509260
Uncentered R**2 0.511589 T x R**2 114.084
Mean of Dependent Variable -0.009739013
Std Error of Dependent Variable 0.625395449
Standard Error of Estimate 0.438107286
Sum of Squared Residuals 42.418296592
Regression F(1,221) 231.3780
Significance Level of F 0.00000000
Log Likelihood -131.37879
Durbin-Watson Statistic 1.977806
Variable Coeff Std Error
T-Stat Signif
*******************************************************************************
1. DTAUX_3_MOIS{1} -0.964352733 0.063397904
-15.21111 0.00000000
2. Constant -0.045517365 0.029431972
-1.54653 0.12340790
calcul de phi1 avec H0 (0,0,1) : 115.74409
******** sans trend ni constante
Linear Regression - Estimation by Least Squares
Dependent Variable dDTAUX_3_MOIS
Monthly Data From 1990:02 To 2008:09
Usable Observations 223 Degrees of Freedom 222
Total Observations 224 Skipped/Missing 1
Centered R**2 0.506183 R Bar **2 0.506183
Uncentered R**2 0.506304 T x R**2 112.906
Mean of Dependent Variable -0.009739013
Std Error of Dependent Variable 0.625395449
Standard Error of Estimate 0.439478417
Sum of Squared Residuals 42.877363997
Log Likelihood -132.57900
Durbin-Watson Statistic 1.973279
Variable Coeff Std Error
T-Stat Signif
*******************************************************************************
1. DTAUX_3_MOIS{1} -0.956517126 0.063392907
-15.08871 0.00000000
Information Criteria for ADF Lag Lengths, Series DCPI
Lags AIC BIC HQ MAIC
0 0.431 0.461 0.443 1.462
1 0.336 0.382 0.355 1.945
2 0.334 0.395 0.359 2.130
3 0.334 0.411 0.365 2.393
4 0.321 0.414 0.359 1.787
5 0.210 0.319 0.254 1.053
6 0.212 0.336 0.262 0.882
7 0.223 0.363 0.280 0.974
8 0.235 0.392 0.298 1.065
9 0.246 0.419 0.316 1.195
10 0.252 0.441 0.328 1.027
11 0.051 0.257 0.134 0.872*
12 -0.039 0.183* 0.051 1.630
13 -0.039 0.200 0.058 1.305
14 -0.056 0.200 0.048* 1.953
15 -0.053 0.220 0.058 2.093
16 -0.040 0.250 0.077 2.260
17 -0.056 0.251 0.068 1.532
18 -0.070* 0.254 0.061 0.969
19 -0.059 0.283 0.079 1.120
20 -0.044 0.315 0.101 1.108
TEST UTILISANT LA PROCEDURE DFUNIT5.SRC
***************************************************
ETUDE DE L INTEGRATION DE LA SERIE DCPI
***************************************************
********* avec trend et constante
Linear Regression - Estimation by Least Squares
Dependent Variable dDCPI
Monthly Data From 1991:01 To 2008:09
Usable Observations 212 Degrees of Freedom 198
Total Observations 213 Skipped/Missing 1
Centered R**2 0.578610 R Bar **2 0.550943
Uncentered R**2 0.578626 T x R**2 122.669
Mean of Dependent Variable -0.008962264
Std Error of Dependent Variable 1.486207317
Standard Error of Estimate 0.995932891
Sum of Squared Residuals 196.39269993
Regression F(13,198) 20.9134
Significance Level of F 0.00000000
Log Likelihood -292.70914
Durbin-Watson Statistic 2.079083
Variable Coeff Std Error
T-Stat Signif
*******************************************************************************
1. DCPI{1} -0.495565168 0.178292824
-2.77950 0.00596891
2. Constant 0.043960789 0.193232249
0.22750 0.82026789
3. TENDANCE 0.001187914 0.001188867
0.99920 0.31891797
4. dDCPI{1} -0.334453193 0.175056258
-1.91055 0.05750766
5. dDCPI{2} -0.503362104 0.169019728
-2.97813 0.00326249
6. dDCPI{3} -0.459324079 0.165435559
-2.77645 0.00602301
7. dDCPI{4} -0.543929791 0.161322052
-3.37170 0.00089831
8. dDCPI{5} -0.468679901 0.158426544
-2.95834 0.00346974
9. dDCPI{6} -0.340914579 0.152567481
-2.23452 0.02656694
10. dDCPI{7} -0.226853327 0.139359287
-1.62783 0.10515098
11. dDCPI{8} -0.294046293 0.122027805
-2.40967 0.01688217
12. dDCPI{9} -0.253474347 0.104200385
-2.43257 0.01588093
13. dDCPI{10} -0.370391464 0.082904363
-4.46770 0.00001328
14. dDCPI{11} -0.299387462 0.062310180
-4.80479 0.00000305
valeur de la statistique de Durbin h= NA
dans le modèle residusaic en fonction de residusaic{1}
et des variables explicatives du modèle
on regarde le t de student de residusaic{1} t=
-0.18458
statistique Q( 29 )= 42.82841 niveau de
significativité 0.0472
statistique Q modifiée
statistique Q( 29 - 11 )= 42.82841 niveau de
significativité 0.0008
calcul de phi3 avec H0 (a,0,1) : 5.79176
*****modele sans le trend avec la constante
Linear Regression - Estimation by Least Squares
Dependent Variable dDCPI
Monthly Data From 1991:01 To 2008:09
Usable Observations 212 Degrees of Freedom 199
Total Observations 213 Skipped/Missing 1
Centered R**2 0.576485 R Bar **2 0.550947
Uncentered R**2 0.576501 T x R**2 122.218
Mean of Dependent Variable -0.008962264
Std Error of Dependent Variable 1.486207317
Standard Error of Estimate 0.995928882
Sum of Squared Residuals 197.38299342
Regression F(12,199) 22.5731
Significance Level of F 0.00000000
Log Likelihood -293.24230
Durbin-Watson Statistic 2.066896
Variable Coeff Std Error
T-Stat Signif
*******************************************************************************
1. DCPI{1} -0.551132548 0.169397204
-3.25349 0.00133933
2. Constant 0.209665967 0.099178438
2.11403 0.03575820
3. dDCPI{1} -0.280153125 0.166406859
-1.68354 0.09383801
4. dDCPI{2} -0.450555676 0.160544288
-2.80643 0.00550729
5. dDCPI{3} -0.407876229 0.157218311
-2.59433 0.01018260
6. dDCPI{4} -0.494427528 0.153525923
-3.22048 0.00149480
7. dDCPI{5} -0.421458114 0.151212800
-2.78719 0.00583183
8. dDCPI{6} -0.296912551 0.146073200
-2.03263 0.04341858
9. dDCPI{7} -0.189693681 0.134304918
-1.41241 0.15939106
10. dDCPI{8} -0.264789492 0.118462393
-2.23522 0.02651431
11. dDCPI{9} -0.231182155 0.101783583
-2.27131 0.02419828
12. dDCPI{10} -0.354533578 0.081370781
-4.35701 0.00002111
13. dDCPI{11} -0.291021226 0.061744810
-4.71329 0.00000457
calcul de phi1 avec H0 (0,0,1) : 5.35371
******** sans trend ni constante
Linear Regression - Estimation by Least Squares
Dependent Variable dDCPI
Monthly Data From 1991:01 To 2008:09
Usable Observations 212 Degrees of Freedom 200
Total Observations 213 Skipped/Missing 1
Centered R**2 0.566974 R Bar **2 0.543158
Uncentered R**2 0.566990 T x R**2 120.202
Mean of Dependent Variable -0.008962264
Std Error of Dependent Variable 1.486207317
Standard Error of Estimate 1.004529223
Sum of Squared Residuals 201.81579214
Log Likelihood -295.59649
Durbin-Watson Statistic 2.065956
Variable Coeff Std Error
T-Stat Signif
*******************************************************************************
1. DCPI{1} -0.291896054 0.117876983
-2.47628 0.01410638
2. dDCPI{1} -0.516757749 0.124209179
-4.16038 0.00004715
3. dDCPI{2} -0.666761672 0.124822022
-5.34170 0.00000025
4. dDCPI{3} -0.601397486 0.128922999
-4.66478 0.00000565
5. dDCPI{4} -0.666309876 0.131353638
-5.07264 0.00000089
6. dDCPI{5} -0.570800340 0.134851258
-4.23281 0.00003515
7. dDCPI{6} -0.423512327 0.134383778
-3.15151 0.00187384
8. dDCPI{7} -0.294335602 0.125928761
-2.33732 0.02041155
9. dDCPI{8} -0.347501021 0.112780449
-3.08122 0.00235190
10. dDCPI{9} -0.293068165 0.098324795
-2.98061 0.00323355
11. dDCPI{10} -0.394426357 0.079835956
-4.94046 0.00000164
12. dDCPI{11} -0.311681183 0.061492976
-5.06857 0.00000091
Information Criteria for ADF Lag Lengths, Series DDEFICIT
Lags AIC BIC HQ MAIC
0 19.935 19.966 19.948 25.528*
1 19.801 19.847 19.820 31.989
2 19.746 19.807 19.771 40.406
3 19.750 19.827 19.781 45.023
4 19.726 19.819 19.764 57.013
5 19.739 19.848 19.783 55.769
6 19.690 19.815 19.741 79.001
7 19.681 19.821 19.738 97.655
8 19.693 19.850 19.757 105.113
9 19.668 19.841 19.738 152.711
10 19.194* 19.384* 19.271* 652.528
11 19.205 19.411 19.289 715.764
12 19.218 19.440 19.308 651.231
TEST UTILISANT LA PROCEDURE DFUNIT5.SRC
***************************************************
ETUDE DE L INTEGRATION DE LA SERIE DDEFICIT
***************************************************
********* avec trend et constante
Linear Regression - Estimation by Least Squares
Dependent Variable dDDEFICIT
Monthly Data From 1990:12 To 2008:09
Usable Observations 213 Degrees of Freedom 200
Total Observations 214 Skipped/Missing 1
Centered R**2 0.891932 R Bar **2 0.885448
Uncentered R**2 0.891937 T x R**2 189.983
Mean of Dependent Variable 293.154930
Std Error of Dependent Variable 42191.494938
Standard Error of Estimate 14279.931650
Sum of Squared Residuals 40783289588
Regression F(12,200) 137.5574
Significance Level of F 0.00000000
Log Likelihood -2333.21512
Durbin-Watson Statistic 2.033019
Variable Coeff Std Error
T-Stat Signif
*******************************************************************************
1. DDEFICIT{1} -10.277904 0.690409
-14.88669 0.00000000
2. Constant -2048.439577 2136.887025
-0.95861 0.33891304
3. TENDANCE 24.093926 15.997443
1.50611 0.13361641
4. dDDEFICIT{1} 8.290597 0.662078
12.52208 0.00000000
5. dDDEFICIT{2} 7.347844 0.618142
11.88698 0.00000000
6. dDDEFICIT{3} 6.421141 0.558457
11.49801 0.00000000
7. dDDEFICIT{4} 5.568953 0.491724
11.32536 0.00000000
8. dDDEFICIT{5} 4.739557 0.426035
11.12481 0.00000000
9. dDDEFICIT{6} 3.963741 0.355194
11.15936 0.00000000
10. dDDEFICIT{7} 3.122293 0.286456
10.89974 0.00000000
11. dDDEFICIT{8} 2.320104 0.208933
11.10453 0.00000000
12. dDDEFICIT{9} 1.540511 0.131734
11.69414 0.00000000
13. dDDEFICIT{10} 0.711782 0.063153
11.27079 0.00000000
valeur de la statistique de Durbin h= NA
dans le modèle residusaic en fonction de residusaic{1}
et des variables explicatives du modèle
on regarde le t de student de residusaic{1} t=
-0.63890
statistique Q( 29 )= 15.84692 niveau de
significativité 0.9772
statistique Q modifiée
statistique Q( 29 - 10 )= 15.84692 niveau de
significativité 0.6675
calcul de phi3 avec H0 (a,0,1) : 110.84185
*****modele sans le trend avec la constante
Linear Regression - Estimation by Least Squares
Dependent Variable dDDEFICIT
Monthly Data From 1990:12 To 2008:09
Usable Observations 213 Degrees of Freedom 201
Total Observations 214 Skipped/Missing 1
Centered R**2 0.890706 R Bar **2 0.884725
Uncentered R**2 0.890712 T x R**2 189.722
Mean of Dependent Variable 293.154930
Std Error of Dependent Variable 42191.494938
Standard Error of Estimate 14324.916136
Sum of Squared Residuals 41245847683
Regression F(11,201) 148.9167
Significance Level of F 0.00000000
Log Likelihood -2334.41623
Durbin-Watson Statistic 2.018857
Variable Coeff Std Error
T-Stat Signif
*******************************************************************************
1. DDEFICIT{1} -10.1911338 0.6901683
-14.76616 0.00000000
2. Constant 811.9186845 982.5990505
0.82630 0.40961536
3. dDDEFICIT{1} 8.2080669 0.6618853
12.40104 0.00000000
4. dDDEFICIT{2} 7.2728762 0.6180757
11.76697 0.00000000
5. dDDEFICIT{3} 6.3559029 0.5585284
11.37973 0.00000000
6. dDDEFICIT{4} 5.5149480 0.4919601
11.21015 0.00000000
7. dDDEFICIT{5} 4.6971387 0.4264420
11.01472 0.00000000
8. dDDEFICIT{6} 3.9332372 0.3557334
11.05670 0.00000000
9. dDDEFICIT{7} 3.1027227 0.2870623
10.80853 0.00000000
10. dDDEFICIT{8} 2.3094815 0.2094718
11.02526 0.00000000
11. dDDEFICIT{9} 1.5347237 0.1320923
11.61857 0.00000000
12. dDDEFICIT{10} 0.7094513 0.0633327
11.20197 0.00000000
calcul de phi1 avec H0 (0,0,1) : 109.08199
******** sans trend ni constante
Linear Regression - Estimation by Least Squares
Dependent Variable dDDEFICIT
Monthly Data From 1990:12 To 2008:09
Usable Observations 213 Degrees of Freedom 202
Total Observations 214 Skipped/Missing 1
Centered R**2 0.890335 R Bar **2 0.884906
Uncentered R**2 0.890341 T x R**2 189.643
Mean of Dependent Variable 293.154930
Std Error of Dependent Variable 42191.494938
Standard Error of Estimate 14313.663352
Sum of Squared Residuals 41385953629
Log Likelihood -2334.77738
Durbin-Watson Statistic 2.014406
Variable Coeff Std Error
T-Stat Signif
*******************************************************************************
1. DDEFICIT{1} -10.17284377 0.68927134
-14.75884 0.00000000
2. dDDEFICIT{1} 8.19089519 0.66103929
12.39094 0.00000000
3. dDDEFICIT{2} 7.25774023 0.61731884
11.75687 0.00000000
4. dDDEFICIT{3} 6.34328909 0.55788115
11.37032 0.00000000
5. dDDEFICIT{4} 5.50482985 0.49142133
11.20185 0.00000000
6. dDDEFICIT{5} 4.68962806 0.42601026
11.00825 0.00000000
7. dDDEFICIT{6} 3.92819328 0.35540161
11.05283 0.00000000
8. dDDEFICIT{7} 3.09992833 0.28681688
10.80804 0.00000000
9. dDDEFICIT{8} 2.30827853 0.20930216
11.02845 0.00000000
10. dDDEFICIT{9} 1.53406671 0.13198615
11.62294 0.00000000
11. dDDEFICIT{10} 0.70924490 0.06328249
11.20760 0.00000000
Information Criteria for ADF Lag Lengths, Series
DPRODUCTION_INDU
Lags AIC BIC HQ MAIC
0 0.699 0.729 0.711 4.242
1 0.595 0.641* 0.613 7.781
2 0.607 0.668 0.631 8.181
3 0.589 0.666 0.620 5.859
4 0.602 0.695 0.640 5.824
5 0.593 0.701 0.637 5.188
6 0.591 0.716 0.642 4.110
7 0.598 0.739 0.655 3.549
8 0.599 0.756 0.663 2.848
9 0.606 0.779 0.676 3.387
10 0.576 0.765 0.653 2.256*
11 0.499* 0.705 0.582* 3.946
12 0.507 0.730 0.597 4.619
13 0.518 0.757 0.614 4.388
14 0.523 0.779 0.626 5.360
15 0.527 0.800 0.637 4.887
16 0.541 0.831 0.658 4.966
17 0.527 0.834 0.651 6.994
18 0.538 0.862 0.669 6.828
19 0.552 0.893 0.690 6.238
20 0.562 0.921 0.708 7.126
TEST UTILISANT LA PROCEDURE DFUNIT5.SRC
***************************************************
ETUDE DE L INTEGRATION DE LA SERIE DPRODUCTION_INDU
***************************************************
********* avec trend et constante
Linear Regression - Estimation by Least Squares
Dependent Variable dDPRODUCTION_IND
Monthly Data From 1990:03 To 2008:09
Usable Observations 222 Degrees of Freedom 218
Total Observations 223 Skipped/Missing 1
Centered R**2 0.680635 R Bar **2 0.676240
Uncentered R**2 0.680645 T x R**2 151.103
Mean of Dependent Variable -0.013063063
Std Error of Dependent Variable 2.355634544
Standard Error of Estimate 1.340353423
Sum of Squared Residuals 391.64731098
Regression F(3,218) 154.8683
Significance Level of F 0.00000000
Log Likelihood -378.01732
Durbin-Watson Statistic 1.992358
Variable Coeff Std Error
T-Stat Signif
*******************************************************************************
1. DPRODUCTION_INDU{1} -1.728474444 0.104517074
-16.53772 0.00000000
2. Constant 0.383564567 0.185440560
2.06840 0.03978258
3. TENDANCE 0.000012827 0.001403989
0.00914 0.99271901
4. dDPRODUCTION_IND{1} 0.338056231 0.064924269
5.20693 0.00000044
valeur de la statistique de Durbin h= 0.22464
statistique Q( 29 )= 68.83192 niveau de
significativité 0.0000
statistique Q modifiée
statistique Q( 29 - 1 )= 68.83192 niveau de
significativité 0.0000
calcul de phi3 avec H0 (a,0,1) : 136.78988
*****modele sans le trend avec la constante
Linear Regression - Estimation by Least Squares
Dependent Variable dDPRODUCTION_IND
Monthly Data From 1990:03 To 2008:09
Usable Observations 222 Degrees of Freedom 219
Total Observations 223 Skipped/Missing 1
Centered R**2 0.680635 R Bar **2 0.677719
Uncentered R**2 0.680645 T x R**2 151.103
Mean of Dependent Variable -0.013063063
Std Error of Dependent Variable 2.355634544
Standard Error of Estimate 1.337290010
Sum of Squared Residuals 391.64746093
Regression F(2,219) 233.3680
Significance Level of F 0.00000000
Log Likelihood -378.01736
Durbin-Watson Statistic 1.992368
Variable Coeff Std Error
T-Stat Signif
*******************************************************************************
1. DPRODUCTION_INDU{1} -1.728457237 0.104261265
-16.57813 0.00000000
2. Constant 0.385029198 0.092992834
4.14042 0.00004948
3. dDPRODUCTION_IND{1} 0.338045431 0.064765144
5.21956 0.00000042
calcul de phi1 avec H0 (0,0,1) : 137.43807
******** sans trend ni constante
Linear Regression - Estimation by Least Squares
Dependent Variable dDPRODUCTION_IND
Monthly Data From 1990:03 To 2008:09
Usable Observations 222 Degrees of Freedom 220
Total Observations 223 Skipped/Missing 1
Centered R**2 0.655636 R Bar **2 0.654070
Uncentered R**2 0.655646 T x R**2 145.553
Mean of Dependent Variable -0.013063063
Std Error of Dependent Variable 2.355634544
Standard Error of Estimate 1.385485082
Sum of Squared Residuals 422.30516055
Log Likelihood -386.38299
Durbin-Watson Statistic 1.953628
Variable Coeff Std Error
T-Stat Signif
*******************************************************************************
1. DPRODUCTION_INDU{1} -1.615517089 0.104256402
-15.49562 0.00000000
2. dDPRODUCTION_IND{1} 0.280742587 0.065549301
4.28292 0.00002756
Information Criteria for ADF Lag Lengths, Series
DMSCI_SUEDE
Lags AIC BIC HQ MAIC
0 7.589* 7.619* 7.601* 9.045
1 7.592 7.638 7.611 8.780
2 7.593 7.654 7.618 8.534
3 7.606 7.683 7.637 8.545
4 7.619 7.711 7.656 8.502
5 7.631 7.740 7.675 8.445
6 7.642 7.767 7.692 8.470
7 7.653 7.794 7.710 8.493
8 7.665 7.822 7.729 8.428
9 7.678 7.851 7.748 8.391*
10 7.677 7.867 7.754 8.615
11 7.689 7.895 7.773 8.518
12 7.697 7.920 7.787 8.658
TEST UTILISANT LA PROCEDURE DFUNIT5.SRC
***************************************************
ETUDE DE L INTEGRATION DE LA SERIE DMSCI_SUEDE
***************************************************
********* avec trend et constante
Linear Regression - Estimation by Least Squares
Dependent Variable dDMSCI_SUEDE
Monthly Data From 1990:02 To 2008:09
Usable Observations 223 Degrees of Freedom 220
Total Observations 224 Skipped/Missing 1
Centered R**2 0.426078 R Bar **2 0.420860
Uncentered R**2 0.426081 T x R**2 95.016
Mean of Dependent Variable -0.13219731
Std Error of Dependent Variable 58.23898596
Standard Error of Estimate 44.32058336
Sum of Squared Residuals 432149.10408
Regression F(2,220) 81.6636
Significance Level of F 0.00000000
Log Likelihood -1160.40628
Durbin-Watson Statistic 2.025438
Variable Coeff Std Error
T-Stat Signif
*******************************************************************************
1. DMSCI_SUEDE{1} -0.853705833 0.066805324
-12.77901 0.00000000
2. Constant 5.193668093 6.046296158
0.85898 0.39128463
3. TENDANCE -0.024690412 0.046124880
-0.53529 0.59298665
statistique Q( 29 ) 45.39188 niveau de
significativité 0.0269
calcul de phi3 avec H0 (a,0,1) : 81.66360
*****modele sans le trend avec la constante
Linear Regression - Estimation by Least Squares
Dependent Variable dDMSCI_SUEDE
Monthly Data From 1990:02 To 2008:09
Usable Observations 223 Degrees of Freedom 221
Total Observations 224 Skipped/Missing 1
Centered R**2 0.425330 R Bar **2 0.422730
Uncentered R**2 0.425333 T x R**2 94.849
Mean of Dependent Variable -0.13219731
Std Error of Dependent Variable 58.23898596
Standard Error of Estimate 44.24898495
Sum of Squared Residuals 432711.95982
Regression F(1,221) 163.5687
Significance Level of F 0.00000000
Log Likelihood -1160.55141
Durbin-Watson Statistic 2.025136
Variable Coeff Std Error
T-Stat Signif
*******************************************************************************
1. DMSCI_SUEDE{1} -0.852642479 0.066667909
-12.78940 0.00000000
2. Constant 2.375833336 2.969613209
0.80005 0.42454208
calcul de phi1 avec H0 (0,0,1) : 81.78536
******** sans trend ni constante
Linear Regression - Estimation by Least Squares
Dependent Variable dDMSCI_SUEDE
Monthly Data From 1990:02 To 2008:09
Usable Observations 223 Degrees of Freedom 222
Total Observations 224 Skipped/Missing 1
Centered R**2 0.423666 R Bar **2 0.423666
Uncentered R**2 0.423669 T x R**2 94.478
Mean of Dependent Variable -0.13219731
Std Error of Dependent Variable 58.23898596
Standard Error of Estimate 44.21310051
Sum of Squared Residuals 433965.21294
Log Likelihood -1160.87388
Durbin-Watson Statistic 2.027002
Variable Coeff Std Error
T-Stat Signif
*******************************************************************************
1. DMSCI_SUEDE{1} -0.849120265 0.066468441
-12.77479 0.00000000
Information Criteria for ADF Lag Lengths, Series
DTAUX_LONG_US
Lags AIC BIC HQ MAIC
0 -3.076 -3.045* -3.064* -1.990*
1 -3.078* -3.032 -3.060 -1.676
2 -3.071 -3.010 -3.046 -1.764
3 -3.059 -2.981 -3.027 -1.690
4 -3.072 -2.979 -3.034 -1.260
5 -3.066 -2.957 -3.022 -1.509
6 -3.059 -2.935 -3.009 -1.392
7 -3.050 -2.909 -2.993 -1.539
8 -3.039 -2.883 -2.976 -1.626
9 -3.037 -2.864 -2.967 -1.534
10 -3.028 -2.839 -2.952 -1.624
11 -3.054 -2.848 -2.971 -0.950
12 -3.045 -2.823 -2.956 -0.694
TEST UTILISANT LA PROCEDURE DFUNIT5.SRC
***************************************************
ETUDE DE L INTEGRATION DE LA SERIE DTAUX_LONG_US
***************************************************
********* avec trend et constante
Linear Regression - Estimation by Least Squares
Dependent Variable dDTAUX_LONG_US
Monthly Data From 1990:02 To 2008:09
Usable Observations 223 Degrees of Freedom 220
Total Observations 224 Skipped/Missing 1
Centered R**2 0.365570 R Bar **2 0.359803
Uncentered R**2 0.365608 T x R**2 81.531
Mean of Dependent Variable -0.002062780
Std Error of Dependent Variable 0.267822813
Standard Error of Estimate 0.214291244
Sum of Squared Residuals 10.102562192
Regression F(2,220) 63.3841
Significance Level of F 0.00000000
Log Likelihood 28.60038
Durbin-Watson Statistic 1.933667
Variable Coeff Std Error
T-Stat Signif
*******************************************************************************
1. DTAUX_LONG_US{1} -0.728919673 0.064741032
-11.25901 0.00000000
2. Constant -0.024137953 0.029241973
-0.82546 0.41000712
3. TENDANCE 0.000069775 0.000222975
0.31293 0.75463101
statistique Q( 29 ) 47.20543 niveau de
significativité 0.0177
calcul de phi3 avec H0 (a,0,1) : 63.38410
*****modele sans le trend avec la constante
Linear Regression - Estimation by Least Squares
Dependent Variable dDTAUX_LONG_US
Monthly Data From 1990:02 To 2008:09
Usable Observations 223 Degrees of Freedom 221
Total Observations 224 Skipped/Missing 1
Centered R**2 0.365288 R Bar **2 0.362416
Uncentered R**2 0.365326 T x R**2 81.468
Mean of Dependent Variable -0.002062780
Std Error of Dependent Variable 0.267822813
Standard Error of Estimate 0.213853451
Sum of Squared Residuals 10.107058961
Regression F(1,221) 127.1894
Significance Level of F 0.00000000
Log Likelihood 28.55076
Durbin-Watson Statistic 1.933618
Variable Coeff Std Error
T-Stat Signif
*******************************************************************************
1. DTAUX_LONG_US{1} -0.728454746 0.064591752
-11.27783 0.00000000
2. Constant -0.016174549 0.014375248
-1.12517 0.26173893
calcul de phi1 avec H0 (0,0,1) : 63.60509
******** sans trend ni constante
Linear Regression - Estimation by Least Squares
Dependent Variable dDTAUX_LONG_US
Monthly Data From 1990:02 To 2008:09
Usable Observations 223 Degrees of Freedom 222
Total Observations 224 Skipped/Missing 1
Centered R**2 0.361652 R Bar **2 0.361652
Uncentered R**2 0.361690 T x R**2 80.657
Mean of Dependent Variable -0.002062780
Std Error of Dependent Variable 0.267822813
Standard Error of Estimate 0.213981532
Sum of Squared Residuals 10.164957311
Log Likelihood 27.91385
Durbin-Watson Statistic 1.933695
Variable Coeff Std Error
T-Stat Signif
*******************************************************************************
1. DTAUX_LONG_US{1} -0.722128669 0.064385129
-11.21577 0.00000000
Linear Regression - Estimation by Least Squares
Dependent Variable TAUX_10_ANS
Monthly Data From 1990:01 To 2008:09
Usable Observations 225 Degrees of Freedom 218
Centered R**2 0.960184 R Bar **2 0.959088
Uncentered R**2 0.993834 T x R**2 223.613
Mean of Dependent Variable 6.7397777778
Std Error of Dependent Variable 2.8914775394
Standard Error of Estimate 0.5848516116
Sum of Squared Residuals 74.567206864
Regression F(6,218) 876.1922
Significance Level of F 0.00000000
Log Likelihood -195.01622
Durbin-Watson Statistic 0.238221
Variable Coeff Std Error
T-Stat Signif
*******************************************************************************
1. Constant -6.653606464 1.580955568
-4.20860 0.00003756
2. TAUX_3_MOIS 0.361912318 0.024325796
14.87772 0.00000000
3. CPI 0.017997736 0.006326675
2.84474 0.00486809
4. DEFICIT -0.000003113 0.000002281
-1.36467 0.17376470
5. PRODUCTION_INDUS 0.014824249 0.008566591
1.73047 0.08496104
6. MSCI_SUEDE -0.002421413 0.000254604
-9.51049 0.00000000
7. TAUX_LONG_US 1.186074485 0.068102117
17.41612 0.00000000
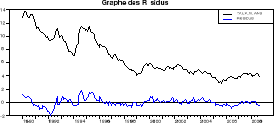
Information Criteria for ADF Lag Lengths, Series RESIDUS
Lags AIC BIC HQ MAIC
0 -2.588 -2.557* -2.575 -2.470*
1 -2.594* -2.548 -2.576* -2.448
2 -2.580 -2.519 -2.556 -2.434
3 -2.574 -2.497 -2.543 -2.443
4 -2.562 -2.469 -2.524 -2.440
5 -2.551 -2.443 -2.507 -2.414
6 -2.542 -2.418 -2.492 -2.423
7 -2.528 -2.388 -2.472 -2.411
8 -2.530 -2.374 -2.467 -2.394
9 -2.525 -2.353 -2.456 -2.388
10 -2.524 -2.335 -2.448 -2.358
11 -2.510 -2.305 -2.427 -2.348
12 -2.518 -2.297 -2.429 -2.308
TEST UTILISANT LA PROCEDURE DFUNIT5.SRC
***************************************************
ETUDE DE L INTEGRATION DE LA SERIE RESIDUS1
***************************************************
********* avec trend et constante
Linear Regression - Estimation by Least Squares
Dependent Variable dRESIDUS1
Monthly Data From 1990:02 To 2008:09
Usable Observations 224 Degrees of Freedom 221
Centered R**2 0.067982 R Bar **2 0.059548
Uncentered R**2 0.068632 T x R**2 15.374
Mean of Dependent Variable -0.007434448
Std Error of Dependent Variable 0.282136883
Standard Error of Estimate 0.273607669
Sum of Squared Residuals 16.544315643
Regression F(2,221) 8.0600
Significance Level of F 0.00041819
Log Likelihood -26.01464
Durbin-Watson Statistic 1.761252
Variable Coeff Std Error
T-Stat Signif
*******************************************************************************
1. RESIDUS1{1} -0.127102244 0.031743724
-4.00401 0.00008505
2. Constant 0.003578976 0.037284487
0.09599 0.92361469
3. TENDANCE 0.000057444 0.000282793
0.20313 0.83921828
statistique Q( 29 ) 41.82080 niveau de
significativité 0.0583
calcul de phi3 avec H0 (a,0,1) : 8.05996
*****modele sans le trend avec la constante
Linear Regression - Estimation by Least Squares
Dependent Variable dRESIDUS1
Monthly Data From 1990:02 To 2008:09
Usable Observations 224 Degrees of Freedom 222
Centered R**2 0.067808 R Bar **2 0.063609
Uncentered R**2 0.068458 T x R**2 15.335
Mean of Dependent Variable -0.007434448
Std Error of Dependent Variable 0.282136883
Standard Error of Estimate 0.273016224
Sum of Squared Residuals 16.547404628
Regression F(1,222) 16.1484
Significance Level of F 0.00008021
Log Likelihood -26.03555
Durbin-Watson Statistic 1.760664
Variable Coeff Std Error
T-Stat Signif
*******************************************************************************
1. RESIDUS1{1} -0.127252223 0.031666536
-4.01851 0.00008021
2. Constant 0.010119615 0.018757409
0.53950 0.59008284
calcul de phi1 avec H0 (0,0,1) : 8.15725
******** sans trend ni constante
Linear Regression - Estimation by Least Squares
Dependent Variable dRESIDUS1
Monthly Data From 1990:02 To 2008:09
Usable Observations 224 Degrees of Freedom 223
Centered R**2 0.066586 R Bar **2 0.066586
Uncentered R**2 0.067237 T x R**2 15.061
Mean of Dependent Variable -0.007434448
Std Error of Dependent Variable 0.282136883
Standard Error of Estimate 0.272581905
Sum of Squared Residuals 16.569099606
Log Likelihood -26.18230
Durbin-Watson Statistic 1.765263
Variable Coeff Std Error
T-Stat Signif
*******************************************************************************
1. RESIDUS1{1} -0.123273610 0.030746857
-4.00931 0.00008307
Linear Regression - Estimation by Least Squares
Dependent Variable DTAUX_10_ANS
Monthly Data From 1990:01 To 2008:09
Usable Observations 224 Degrees of Freedom 217
Total Observations 225 Skipped/Missing 1
Centered R**2 0.355859 R Bar **2 0.338049
Uncentered R**2 0.368812 T x R**2 82.614
Mean of Dependent Variable -0.040178571
Std Error of Dependent Variable 0.281096451
Standard Error of Estimate 0.228701173
Sum of Squared Residuals 11.350017120
Regression F(6,217) 19.9805
Significance Level of F 0.00000000
Log Likelihood 16.18957
Durbin-Watson Statistic 1.524607
Variable Coeff Std Error
T-Stat Signif
*******************************************************************************
1. Constant -0.0273 0.0167
-1.62850 0.10486984
2. DTAUX_3_MOIS 0.2388 0.0334
7.15520 0.00000000
3. DCPI 0.0191 0.0124
1.54236 0.12444426
4. DDEFICIT -3.7809e-07 6.3980e-07
-0.59095 0.55516927
5. DPRODUCTION_INDU 2.3819e-03 0.0106
0.22550 0.82180222
6. DMSCI_SUEDE -6.6711e-04 3.5156e-04
-1.89758 0.05907923
7. DTAUX_LONG_US 0.5873 0.0700
8.39100 0.00000000
s du modele = 0.22870
Linear Regression - Estimation by Least Squares
Dependent Variable DTAUX_10_ANS
Monthly Data From 1990:01 To 2008:09
Usable Observations 224 Degrees of Freedom 218
Total Observations 225 Skipped/Missing 1
Centered R**2 0.355708 R Bar **2 0.340931
Uncentered R**2 0.368664 T x R**2 82.581
Mean of Dependent Variable -0.040178571
Std Error of Dependent Variable 0.281096451
Standard Error of Estimate 0.228202759
Sum of Squared Residuals 11.352676814
Regression F(5,218) 24.0712
Significance Level of F 0.00000000
Log Likelihood 16.16333
Durbin-Watson Statistic 1.523645
Variable Coeff Std Error
T-Stat Signif
*******************************************************************************
1. Constant -0.0266 0.0165
-1.61687 0.10735332
2. DTAUX_3_MOIS 0.2389 0.0333
7.17727 0.00000000
3. DCPI 0.0189 0.0123
1.53361 0.12657518
4. DDEFICIT -3.9341e-07 6.3480e-07
-0.61973 0.53608011
5. DMSCI_SUEDE -6.6215e-04 3.5011e-04
-1.89128 0.05991267
6. DTAUX_LONG_US 0.5878 0.0698
8.42143 0.00000000
s du modele = 0.22820
Linear Regression - Estimation by Least Squares
Dependent Variable DTAUX_10_ANS
Monthly Data From 1990:01 To 2008:09
Usable Observations 224 Degrees of Freedom 219
Total Observations 225 Skipped/Missing 1
Centered R**2 0.354573 R Bar **2 0.342784
Uncentered R**2 0.367552 T x R**2 82.332
Mean of Dependent Variable -0.040178571
Std Error of Dependent Variable 0.281096451
Standard Error of Estimate 0.227881627
Sum of Squared Residuals 11.372677849
Regression F(4,219) 30.0776
Significance Level of F 0.00000000
Log Likelihood 15.96618
Durbin-Watson Statistic 1.527258
Variable Coeff Std Error
T-Stat Signif
*******************************************************************************
1. Constant -0.026925151 0.016448225
-1.63696 0.10307415
2. DTAUX_3_MOIS 0.237924630 0.033203243
7.16570 0.00000000
3. DCPI 0.019309144 0.012305271
1.56918 0.11805048
4. DMSCI_SUEDE -0.000656000 0.000349472
-1.87712 0.06183162
5. DTAUX_LONG_US 0.589860250 0.069629260
8.47144 0.00000000
s du modele = 0.22788
Linear Regression - Estimation by Least Squares
Dependent Variable DTAUX_10_ANS
Monthly Data From 1990:01 To 2008:09
Usable Observations 224 Degrees of Freedom 220
Total Observations 225 Skipped/Missing 1
Centered R**2 0.347316 R Bar **2 0.338416
Uncentered R**2 0.360441 T x R**2 80.739
Mean of Dependent Variable -0.040178571
Std Error of Dependent Variable 0.281096451
Standard Error of Estimate 0.228637724
Sum of Squared Residuals 11.500545979
Regression F(3,220) 39.0233
Significance Level of F 0.00000000
Log Likelihood 14.71394
Durbin-Watson Statistic 1.523152
Variable Coeff Std Error
T-Stat Signif
*******************************************************************************
1. Constant -0.017784313 0.015433190
-1.15234 0.25043118
2. DTAUX_3_MOIS 0.233080111 0.033169089
7.02703 0.00000000
3. DMSCI_SUEDE -0.000718706 0.000348332
-2.06328 0.04025995
4. DTAUX_LONG_US 0.589941919 0.069860266
8.44460 0.00000000
s du modele = 0.22864
fin du programme
##############
les 3 meilleurs S sont :
Linear Regression - Estimation by Least Squares
Dependent Variable DTAUX_10_ANS
Monthly Data From 1990:01 To 2008:09
Usable Observations 224 Degrees of Freedom 219
Total Observations 225 Skipped/Missing 1
Centered R**2 0.354573 R Bar **2 0.342784
Uncentered R**2 0.367552 T x R**2 82.332
Mean of Dependent Variable -0.040178571
Std Error of Dependent Variable 0.281096451
Standard Error of Estimate 0.227881627
Sum of Squared Residuals 11.372677849
Regression F(4,219) 30.0776
Significance Level of F 0.00000000
Log Likelihood 15.96618
Durbin-Watson Statistic 1.527258
Variable Coeff Std Error
T-Stat Signif
*******************************************************************************
1. Constant -0.026925151 0.016448225
-1.63696 0.10307415
2. DTAUX_LONG_US 0.589860250 0.069629260
8.47144 0.00000000
3. DMSCI_SUEDE -0.000656000 0.000349472
-1.87712 0.06183162
4. DTAUX_3_MOIS 0.237924630 0.033203243
7.16570 0.00000000
5. DCPI 0.019309144 0.012305271
1.56918 0.11805048
see= 0.22788
akaike= -2.93579
##########
Linear Regression - Estimation by Least Squares
Dependent Variable DTAUX_10_ANS
Monthly Data From 1990:01 To 2008:09
Usable Observations 224 Degrees of Freedom 218
Total Observations 225 Skipped/Missing 1
Centered R**2 0.355708 R Bar **2 0.340931
Uncentered R**2 0.368664 T x R**2 82.581
Mean of Dependent Variable -0.040178571
Std Error of Dependent Variable 0.281096451
Standard Error of Estimate 0.228202759
Sum of Squared Residuals 11.352676814
Regression F(5,218) 24.0712
Significance Level of F 0.00000000
Log Likelihood 16.16333
Durbin-Watson Statistic 1.523645
Variable Coeff Std Error
T-Stat Signif
*******************************************************************************
1. Constant -0.0266 0.0165
-1.61687 0.10735332
2. DDEFICIT -3.9341e-07 6.3480e-07
-0.61973 0.53608011
3. DTAUX_LONG_US 0.5878 0.0698
8.42143 0.00000000
4. DMSCI_SUEDE -6.6215e-04 3.5011e-04
-1.89128 0.05991267
5. DTAUX_3_MOIS 0.2389 0.0333
7.17727 0.00000000
6. DCPI 0.0189 0.0123
1.53361 0.12657518
see= 0.22820
akaike= -2.92862
##########
Linear Regression - Estimation by Least Squares
Dependent Variable DTAUX_10_ANS
Monthly Data From 1990:01 To 2008:09
Usable Observations 224 Degrees of Freedom 218
Total Observations 225 Skipped/Missing 1
Centered R**2 0.354822 R Bar **2 0.340025
Uncentered R**2 0.367797 T x R**2 82.386
Mean of Dependent Variable -0.040178571
Std Error of Dependent Variable 0.281096451
Standard Error of Estimate 0.228359555
Sum of Squared Residuals 11.368282871
Regression F(5,218) 23.9783
Significance Level of F 0.00000000
Log Likelihood 16.00947
Durbin-Watson Statistic 1.528284
Variable Coeff Std Error
T-Stat Signif
*******************************************************************************
1. Constant -0.027700100 0.016697479
-1.65894 0.09856606
2. DTAUX_LONG_US 0.589092099 0.069825443
8.43664 0.00000000
3. DMSCI_SUEDE -0.000662653 0.000350954
-1.88815 0.06033439
4. DPRODUCTION_INDU 0.003044545 0.010487289
0.29031 0.77185650
5. DTAUX_3_MOIS 0.237769716 0.033277157
7.14513 0.00000000
6. DCPI 0.019541666 0.012357063
1.58142 0.11523253
see= 0.22836
akaike= -2.92725
##########
*******************MODELE EN
ECART****************************
*/points aberrants/*
ce graphe est enregistré dans le fichier
grafres.gsp
liste des points non compris entre -1.96 et +1.96 avec les
résidus standardisés
1992:08 -1.96000 2.64100 1.96000
1992:09 -1.96000 4.34371 1.96000
1992:10 -1.96000 -4.19590 1.96000
1993:01 -1.96000 2.69728 1.96000
1994:04 -1.96000 2.15446 1.96000
1994:06 -1.96000 5.08263 1.96000
1994:07 -1.96000 3.25065 1.96000
1994:08 -1.96000 2.26374 1.96000
1994:10 -1.96000 -2.19215 1.96000
1996:02 -1.96000 2.70309 1.96000
1999:07 -1.96000 2.13965 1.96000
liste des points non compris entre -1.96 et +1.96 avec les
résidus divisés par s
1992:08 -1.96000 2.57705 1.96000
1992:09 -1.96000 4.22295 1.96000
1992:10 -1.96000 -3.90151 1.96000
1993:01 -1.96000 2.55136 1.96000
1994:04 -1.96000 2.12227 1.96000
1994:06 -1.96000 5.06147 1.96000
1994:07 -1.96000 3.22933 1.96000
1994:08 -1.96000 2.25449 1.96000
1994:10 -1.96000 -2.17597 1.96000
1996:02 -1.96000 2.68366 1.96000
1999:07 -1.96000 2.12541 1.96000
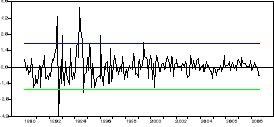
Linear Regression - Estimation by Least Squares
Dependent Variable DTAUX_10_ANS
Monthly Data From 1990:01 To 2008:09
Usable Observations 224 Degrees of Freedom 208
Total Observations 225 Skipped/Missing 1
Centered R**2 0.695369 R Bar **2 0.673401
Uncentered R**2 0.701495 T x R**2 157.135
Mean of Dependent Variable -0.040178571
Std Error of Dependent Variable 0.281096451
Standard Error of Estimate 0.160643396
Sum of Squared Residuals 5.3677105538
Regression F(15,208) 31.6529
Significance Level of F 0.00000000
Log Likelihood 100.05716
Durbin-Watson Statistic 1.665146
Variable Coeff Std Error
T-Stat Signif
*******************************************************************************
1. Constant -0.038979152 0.011945957
-3.26296 0.00128878
2. DCPI 0.006249505 0.009233935
0.67680 0.49928638
3. DTAUX_3_MOIS 0.312934379 0.026465196
11.82437 0.00000000
4. DMSCI_SUEDE -0.000573957 0.000247273
-2.32115 0.02124714
5. DTAUX_LONG_US 0.627316768 0.050494657
12.42343 0.00000000
6. DU1 0.509883707 0.165348114
3.08370 0.00232177
7. DU2 1.115679616 0.166160428
6.71447 0.00000000
8. DU3 -1.056984254 0.174100318
-6.07112 0.00000001
9. DU4 0.741934878 0.170518001
4.35106 0.00002123
10. DU5 0.486396558 0.163191462
2.98053 0.00322029
11. DU6 1.173690317 0.161330145
7.27508 0.00000000
12. DU7 0.713476508 0.161875529
4.40756 0.00001674
13. DU8 0.501916745 0.161416852
3.10944 0.00213691
14. DU9 -0.509009025 0.161980139
-3.14242 0.00192002
15. DU10 0.657171125 0.161882141
4.05957 0.00006959
16. DU11 0.484299937 0.161787923
2.99342 0.00309269
statistique Q( 29 ) 45.66298 niveau de
significativité 0.0335
s du modele corrigé = 0.16064
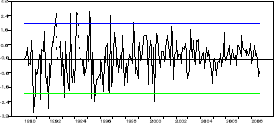
test normalite en ecart
Statistics on Series RES1
Monthly Data From 1990:01 To 2008:09
Observations 224 Skipped/Missing
1
Sample Mean 0.000000 Variance
0.024070
Standard Error 0.155147 of Sample Mean
0.010366
t-Statistic (Mean=0) 0.000000 Signif Level
1.000000
Skewness -0.126742 Signif Level (Sk=0)
0.441764
Kurtosis (excess) 0.616728 Signif Level (Ku=0)
0.063624
Jarque-Bera 4.149665 Signif Level (JB=0)
0.125577
les erreurs suivent une loi normale
Linear Regression - Estimation by Least Squares
Dependent Variable DTAUX_10_ANS
Monthly Data From 1990:01 To 2008:09
Usable Observations 224 Degrees of Freedom 208
Total Observations 225 Skipped/Missing 1
Centered R**2 0.695369 R Bar **2 0.673401
Uncentered R**2 0.701495 T x R**2 157.135
Mean of Dependent Variable -0.040178571
Std Error of Dependent Variable 0.281096451
Standard Error of Estimate 0.160643396
Sum of Squared Residuals 5.3677105538
Regression F(15,208) 31.6529
Significance Level of F 0.00000000
Log Likelihood 100.05716
Durbin-Watson Statistic 1.665146
Variable Coeff Std Error
T-Stat Signif
*******************************************************************************
1. Constant -0.038979152 0.011945957
-3.26296 0.00128878
2. DCPI 0.006249505 0.009233935
0.67680 0.49928638
3. DTAUX_3_MOIS 0.312934379 0.026465196
11.82437 0.00000000
4. DMSCI_SUEDE -0.000573957 0.000247273
-2.32115 0.02124714
5. DTAUX_LONG_US 0.627316768 0.050494657
12.42343 0.00000000
6. DU1 0.509883707 0.165348114
3.08370 0.00232177
7. DU2 1.115679616 0.166160428
6.71447 0.00000000
8. DU3 -1.056984254 0.174100318
-6.07112 0.00000001
9. DU4 0.741934878 0.170518001
4.35106 0.00002123
10. DU5 0.486396558 0.163191462
2.98053 0.00322029
11. DU5 0.000000000 0.000000000
0.00000 0.00000000
12. DU6 1.173690317 0.161330145
7.27508 0.00000000
13. DU7 0.713476508 0.161875529
4.40756 0.00001674
14. DU8 0.501916745 0.161416852
3.10944 0.00213691
15. DU9 -0.509009025 0.161980139
-3.14242 0.00192002
16. DU10 0.657171125 0.161882141
4.05957 0.00006959
17. DU11 0.484299937 0.161787923
2.99342 0.00309269
Correlations of Series RES1
Monthly Data From 1990:02 To 2008:09
Autocorrelations
1: 0.1663836 0.0028702 0.1282118 -0.0034229 0.0553182
-0.0090485 -0.0338251 -0.0092218 -0.0909700 0.0972146 0.0994362
12: 0.0269653 0.0712362 -0.0654827 0.0125716 0.0499594
-0.0542408 -0.0685378 -0.0767791 -0.0617663 -0.0489777 0.1007666
23: 0.1130310 0.0520705 0.0987264 0.1861615 0.0668646
-0.0031087 0.0547560
Ljung-Box Q-Statistics
Q(4-0) = 10.0546. Significance Level 0.03951826
Q(8-0) = 11.0678. Significance Level 0.19788633
Q(12-0)= 17.7757. Significance Level 0.12267411
Q(16-0)= 20.6726. Significance Level 0.19144061
Q(20-0)= 24.9490. Significance Level 0.20338887
Q(24-0)= 31.9960. Significance Level 0.12709185
Q(28-0)= 44.4877. Significance Level 0.02484545
Regression with AR1 - Estimation by Cochrane-Orcutt
Dependent Variable DTAUX_10_ANS
Monthly Data From 1990:02 To 2008:09
Usable Observations 224 Degrees of Freedom 218
Centered R**2 0.372786 R Bar **2 0.358400
Uncentered R**2 0.388479 T x R**2 87.019
Mean of Dependent Variable -0.043928571
Std Error of Dependent Variable 0.274834992
Standard Error of Estimate 0.220142635
Sum of Squared Residuals 10.564885995
Regression F(5,218) 25.9137
Significance Level of F 0.00000000
Log Likelihood 24.21811
Durbin-Watson Statistic 2.000877
Q(36-1) 43.234117
Significance Level of Q 0.16000311
Variable Coeff Std Error
T-Stat Signif
*******************************************************************************
1. Constant -0.031294986 0.021409800
-1.46171 0.14525981
2. DCPI 0.016639487 0.012089150
1.37640 0.17011041
3. DTAUX_3_MOIS 0.177072907 0.033029111
5.36112 0.00000021
4. DMSCI_SUEDE -0.000571199 0.000336243
-1.69877 0.09078954
5. DTAUX_LONG_US 0.541332446 0.069977276
7.73583 0.00000000
*******************************************************************************
6. RHO 0.280994577 0.066862456
4.20258 0.00003850
Performing White's Test for Heteroskedasticity on RES1
using the regressors, their squares, and non-redundant
cross-products
Linear Regression - Estimation by Least Squares
Dependent Variable RES1^2
Monthly Data From 1990:01 To 2008:09
Usable Observations 223 Degrees of Freedom 208
Total Observations 225 Skipped/Missing 2
Centered R**2 0.090077 R Bar **2 0.028832
Uncentered R**2 0.344466 T x R**2 76.816
Mean of Dependent Variable 0.0240102359
Std Error of Dependent Variable 0.0386296292
Standard Error of Estimate 0.0380686644
Sum of Squared Residuals 0.3014384271
Regression F(14,208) 1.4708
Significance Level of F 0.12418367
Log Likelihood 420.18599
Durbin-Watson Statistic 1.839010
Variable Coeff Std Error
T-Stat Signif
*******************************************************************************
1. Constant 0.0198 3.9537e-03
5.01749 0.00000112
2. DCPI 1.1003e-03 3.0264e-03
0.36356 0.71655751
3. DTAUX_3_MOIS -7.7732e-03 7.2999e-03
-1.06483 0.28818775
4. DMSCI_SUEDE 8.8210e-05 6.8130e-05
1.29473 0.19684722
5. DTAUX_LONG_US -0.0398 0.0132
-3.02073 0.00283776
6. DCPI^2 -8.8071e-04 1.0946e-03
-0.80459 0.42197454
7. DTAUX_3_MOIS^2 1.1755e-03 3.9906e-03
0.29457 0.76861721
8. DMSCI_SUEDE^2 -6.8623e-07 6.2683e-07
-1.09477 0.27488301
9. DTAUX_LONG_US^2 0.1007 0.0426
2.36480 0.01896018
10. DCPI*DTAUX_3_MOI 5.3926e-04 5.4482e-03
0.09898 0.92125025
11. DCPI*DMSCI_SUEDE -4.3306e-06 5.1737e-05
-0.08370 0.93337227
12. DCPI*DTAUX_LONG_ 1.8034e-03 0.0118
0.15223 0.87914961
13. DTAUX_3_MOIS*DMS -1.8419e-04 3.2520e-04
-0.56638 0.57174886
14. DTAUX_3_MOIS*DTA -0.0170 0.0303
-0.55986 0.57617768
15. DMSCI_SUEDE*DTAU -2.4621e-04 2.9503e-04
-0.83451 0.40494997
Chi-Squared(14)= 20.087209 with Significance Level
0.12741580
*************************************************************
sous-périodes utilisées 1990:02 1991:07 1991:08
2008:09
F(5,203)= 2.52912 with Significance Level 0.03020701
*************************************************************
sous-périodes utilisées 1990:02 1991:08 1991:09
2008:09
F(5,203)= 1.57131 with Significance Level 0.16967387
*************************************************************
sous-périodes utilisées 1990:02 1991:09 1991:10
2008:09
F(5,203)= 1.74540 with Significance Level 0.12578880
*************************************************************
sous-périodes utilisées 1990:02 1991:10 1991:11
2008:09
F(5,203)= 2.10856 with Significance Level 0.06581475
*************************************************************
sous-périodes utilisées 1990:02 1991:11 1991:12
2008:09
F(5,203)= 2.32753 with Significance Level 0.04401372
*************************************************************
sous-périodes utilisées 1990:02 1991:12 1992:01
2008:09
F(5,203)= 5.03540 with Significance Level 0.00022623
*************************************************************
sous-périodes utilisées 1990:02 1992:01 1992:02
2008:09
F(5,203)= 5.05440 with Significance Level 0.00021787
*************************************************************
sous-périodes utilisées 1990:02 1992:02 1992:03
2008:09
F(5,203)= 4.74927 with Significance Level 0.00039878
*************************************************************
sous-périodes utilisées 1990:02 1992:03 1992:04
2008:09
F(5,203)= 4.78266 with Significance Level 0.00037326
*************************************************************
sous-périodes utilisées 1990:02 1992:04 1992:05
2008:09
F(5,203)= 4.40046 with Significance Level 0.00079531
*************************************************************
sous-périodes utilisées 1990:02 1992:05 1992:06
2008:09
F(5,203)= 4.23640 with Significance Level 0.00109982
*************************************************************
sous-périodes utilisées 1990:02 1992:06 1992:07
2008:09
F(5,203)= 4.17510 with Significance Level 0.00124129
*************************************************************
sous-périodes utilisées 1990:02 1992:07 1992:08
2008:09
F(5,203)= 3.63129 with Significance Level 0.00361668
*************************************************************
sous-périodes utilisées 1990:02 1992:08 1992:09
2008:09
F(5,203)= 3.63129 with Significance Level 0.00361668
*************************************************************
sous-périodes utilisées 1990:02 1992:09 1992:10
2008:09
F(5,203)= 3.63129 with Significance Level 0.00361668
*************************************************************
sous-périodes utilisées 1990:02 1992:10 1992:11
2008:09
F(5,203)= 3.63129 with Significance Level 0.00361668
*************************************************************
sous-périodes utilisées 1990:02 1992:11 1992:12
2008:09
F(5,203)= 4.96171 with Significance Level 0.00026180
*************************************************************
sous-périodes utilisées 1990:02 1992:12 1993:01
2008:09
F(5,203)= 4.67490 with Significance Level 0.00046206
*************************************************************
sous-périodes utilisées 1990:02 1993:01 1993:02
2008:09
F(5,203)= 4.67490 with Significance Level 0.00046206
*************************************************************
sous-périodes utilisées 1990:02 1993:02 1993:03
2008:09
F(5,203)= 4.61374 with Significance Level 0.00052154
*************************************************************
sous-périodes utilisées 1990:02 1993:03 1993:04
2008:09
F(5,203)= 5.96835 with Significance Level 0.00003567
*************************************************************
sous-périodes utilisées 1990:02 1993:04 1993:05
2008:09
F(5,203)= 5.95651 with Significance Level 0.00003652
*************************************************************
sous-périodes utilisées 1990:02 1993:05 1993:06
2008:09
F(5,203)= 5.97609 with Significance Level 0.00003513
*************************************************************
sous-périodes utilisées 1990:02 1993:06 1993:07
2008:09
F(5,203)= 5.49238 with Significance Level 0.00009148
*************************************************************
sous-périodes utilisées 1990:02 1993:07 1993:08
2008:09
F(5,203)= 5.82544 with Significance Level 0.00004732
*************************************************************
sous-périodes utilisées 1990:02 1993:08 1993:09
2008:09
F(5,203)= 5.68025 with Significance Level 0.00006307
*************************************************************
sous-périodes utilisées 1990:02 1993:09 1993:10
2008:09
F(5,203)= 4.56658 with Significance Level 0.00057256
*************************************************************
sous-périodes utilisées 1990:02 1993:10 1993:11
2008:09
F(5,203)= 4.74232 with Significance Level 0.00040430
*************************************************************
sous-périodes utilisées 1990:02 1993:11 1993:12
2008:09
F(5,203)= 4.37945 with Significance Level 0.00082904
*************************************************************
sous-périodes utilisées 1990:02 1993:12 1994:01
2008:09
F(5,203)= 4.38265 with Significance Level 0.00082381
*************************************************************
sous-périodes utilisées 1990:02 1994:01 1994:02
2008:09
F(5,203)= 4.92181 with Significance Level 0.00028333
*************************************************************
sous-périodes utilisées 1990:02 1994:02 1994:03
2008:09
F(5,203)= 4.92861 with Significance Level 0.00027954
*************************************************************
sous-périodes utilisées 1990:02 1994:03 1994:04
2008:09
F(5,203)= 4.99887 with Significance Level 0.00024321
*************************************************************
sous-périodes utilisées 1990:02 1994:04 1994:05
2008:09
F(5,203)= 4.99887 with Significance Level 0.00024321
*************************************************************
sous-périodes utilisées 1990:02 1994:05 1994:06
2008:09
F(5,203)= 4.84151 with Significance Level 0.00033219
*************************************************************
sous-périodes utilisées 1990:02 1994:06 1994:07
2008:09
F(5,203)= 4.84151 with Significance Level 0.00033219
*************************************************************
sous-périodes utilisées 1990:02 1994:07 1994:08
2008:09
F(5,203)= 4.84151 with Significance Level 0.00033219
*************************************************************
sous-périodes utilisées 1990:02 1994:08 1994:09
2008:09
F(5,203)= 4.84151 with Significance Level 0.00033219
*************************************************************
sous-périodes utilisées 1990:02 1994:09 1994:10
2008:09
F(5,203)= 4.92401 with Significance Level 0.00028210
*************************************************************
sous-périodes utilisées 1990:02 1994:10 1994:11
2008:09
F(5,203)= 4.92401 with Significance Level 0.00028210
*************************************************************
sous-périodes utilisées 1990:02 1994:11 1994:12
2008:09
F(5,203)= 5.16855 with Significance Level 0.00017376
*************************************************************
sous-périodes utilisées 1990:02 1994:12 1995:01
2008:09
F(5,203)= 5.16139 with Significance Level 0.00017625
*************************************************************
sous-périodes utilisées 1990:02 1995:01 1995:02
2008:09
F(5,203)= 4.76619 with Significance Level 0.00038564
*************************************************************
sous-périodes utilisées 1990:02 1995:02 1995:03
2008:09
F(5,203)= 4.76666 with Significance Level 0.00038528
*************************************************************
sous-périodes utilisées 1990:02 1995:03 1995:04
2008:09
F(5,203)= 3.08358 with Significance Level 0.01049431
*************************************************************
sous-périodes utilisées 1990:02 1995:04 1995:05
2008:09
F(5,203)= 2.20300 with Significance Level 0.05538162
*************************************************************
sous-périodes utilisées 1990:02 1995:05 1995:06
2008:09
F(5,203)= 2.69844 with Significance Level 0.02193806
*************************************************************
sous-périodes utilisées 1990:02 1995:06 1995:07
2008:09
F(5,203)= 2.52534 with Significance Level 0.03042250
*************************************************************
sous-périodes utilisées 1990:02 1995:07 1995:08
2008:09
F(5,203)= 2.61762 with Significance Level 0.02556627
*************************************************************
sous-périodes utilisées 1990:02 1995:08 1995:09
2008:09
F(5,203)= 2.62768 with Significance Level 0.02508476
*************************************************************
sous-périodes utilisées 1990:02 1995:09 1995:10
2008:09
F(5,203)= 2.88324 with Significance Level 0.01542400
*************************************************************
sous-périodes utilisées 1990:02 1995:10 1995:11
2008:09
F(5,203)= 2.81564 with Significance Level 0.01755182
*************************************************************
sous-périodes utilisées 1990:02 1995:11 1995:12
2008:09
F(5,203)= 3.08029 with Significance Level 0.01056131
*************************************************************
sous-périodes utilisées 1990:02 1995:12 1996:01
2008:09
F(5,203)= 3.11625 with Significance Level 0.00985302
*************************************************************
sous-périodes utilisées 1990:02 1996:01 1996:02
2008:09
F(5,203)= 3.05262 with Significance Level 0.01113997
*************************************************************
sous-périodes utilisées 1990:02 1996:02 1996:03
2008:09
F(5,203)= 3.05262 with Significance Level 0.01113997
*************************************************************
sous-périodes utilisées 1990:02 1996:03 1996:04
2008:09
F(5,203)= 3.02908 with Significance Level 0.01165680
*************************************************************
sous-périodes utilisées 1990:02 1996:04 1996:05
2008:09
F(5,203)= 2.68715 with Significance Level 0.02241315
*************************************************************
sous-périodes utilisées 1990:02 1996:05 1996:06
2008:09
F(5,203)= 2.63619 with Significance Level 0.02468436
*************************************************************
sous-périodes utilisées 1990:02 1996:06 1996:07
2008:09
F(5,203)= 2.63248 with Significance Level 0.02485783
*************************************************************
sous-périodes utilisées 1990:02 1996:07 1996:08
2008:09
F(5,203)= 2.66772 with Significance Level 0.02325381
*************************************************************
sous-périodes utilisées 1990:02 1996:08 1996:09
2008:09
F(5,203)= 2.34623 with Significance Level 0.04251283
*************************************************************
sous-périodes utilisées 1990:02 1996:09 1996:10
2008:09
F(5,203)= 2.50438 with Significance Level 0.03164391
*************************************************************
sous-périodes utilisées 1990:02 1996:10 1996:11
2008:09
F(5,203)= 3.01981 with Significance Level 0.01186668
*************************************************************
sous-périodes utilisées 1990:02 1996:11 1996:12
2008:09
F(5,203)= 2.40720 with Significance Level 0.03795288
*************************************************************
sous-périodes utilisées 1990:02 1996:12 1997:01
2008:09
F(5,203)= 2.60414 with Significance Level 0.02622552
*************************************************************
sous-périodes utilisées 1990:02 1997:01 1997:02
2008:09
F(5,203)= 2.90651 with Significance Level 0.01475170
*************************************************************
sous-périodes utilisées 1990:02 1997:02 1997:03
2008:09
F(5,203)= 2.69709 with Significance Level 0.02199411
*************************************************************
sous-périodes utilisées 1990:02 1997:03 1997:04
2008:09
F(5,203)= 2.19820 with Significance Level 0.05587107
*************************************************************
sous-périodes utilisées 1990:02 1997:04 1997:05
2008:09
F(5,203)= 2.19072 with Significance Level 0.05664349
*************************************************************
sous-périodes utilisées 1990:02 1997:05 1997:06
2008:09
F(5,203)= 2.24666 with Significance Level 0.05110861
*************************************************************
sous-périodes utilisées 1990:02 1997:06 1997:07
2008:09
F(5,203)= 2.18210 with Significance Level 0.05754509
*************************************************************
sous-périodes utilisées 1990:02 1997:07 1997:08
2008:09
F(5,203)= 2.40251 with Significance Level 0.03828624
*************************************************************
sous-périodes utilisées 1990:02 1997:08 1997:09
2008:09
F(5,203)= 2.40028 with Significance Level 0.03844630
*************************************************************
sous-périodes utilisées 1990:02 1997:09 1997:10
2008:09
F(5,203)= 2.42493 with Significance Level 0.03671838
*************************************************************
sous-périodes utilisées 1990:02 1997:10 1997:11
2008:09
F(5,203)= 2.38760 with Significance Level 0.03936523
*************************************************************
sous-périodes utilisées 1990:02 1997:11 1997:12
2008:09
F(5,203)= 2.04392 with Significance Level 0.07400253
*************************************************************
sous-périodes utilisées 1990:02 1997:12 1998:01
2008:09
F(5,203)= 2.21838 with Significance Level 0.05383842
*************************************************************
sous-périodes utilisées 1990:02 1998:01 1998:02
2008:09
F(5,203)= 2.38492 with Significance Level 0.03956233
*************************************************************
sous-périodes utilisées 1990:02 1998:02 1998:03
2008:09
F(5,203)= 2.43664 with Significance Level 0.03592406
*************************************************************
sous-périodes utilisées 1990:02 1998:03 1998:04
2008:09
F(5,203)= 2.78369 with Significance Level 0.01865438
*************************************************************
sous-périodes utilisées 1990:02 1998:04 1998:05
2008:09
F(5,203)= 2.89974 with Significance Level 0.01494432
*************************************************************
sous-périodes utilisées 1990:02 1998:05 1998:06
2008:09
F(5,203)= 2.79319 with Significance Level 0.01831970
*************************************************************
sous-périodes utilisées 1990:02 1998:06 1998:07
2008:09
F(5,203)= 2.78415 with Significance Level 0.01863827
*************************************************************
sous-périodes utilisées 1990:02 1998:07 1998:08
2008:09
F(5,203)= 2.76757 with Significance Level 0.01923627
*************************************************************
sous-périodes utilisées 1990:02 1998:08 1998:09
2008:09
F(5,203)= 2.78638 with Significance Level 0.01855917
*************************************************************
sous-périodes utilisées 1990:02 1998:09 1998:10
2008:09
F(5,203)= 2.61268 with Significance Level 0.02580572
*************************************************************
sous-périodes utilisées 1990:02 1998:10 1998:11
2008:09
F(5,203)= 2.35359 with Significance Level 0.04193556
*************************************************************
sous-périodes utilisées 1990:02 1998:11 1998:12
2008:09
F(5,203)= 2.60204 with Significance Level 0.02632954
*************************************************************
sous-périodes utilisées 1990:02 1998:12 1999:01
2008:09
F(5,203)= 2.68231 with Significance Level 0.02261983
*************************************************************
sous-périodes utilisées 1990:02 1999:01 1999:02
2008:09
F(5,203)= 2.92815 with Significance Level 0.01415230
*************************************************************
sous-périodes utilisées 1990:02 1999:02 1999:03
2008:09
F(5,203)= 2.74642 with Significance Level 0.02002629
*************************************************************
sous-périodes utilisées 1990:02 1999:03 1999:04
2008:09
F(5,203)= 2.55993 with Significance Level 0.02850573
*************************************************************
sous-périodes utilisées 1990:02 1999:04 1999:05
2008:09
F(5,203)= 2.59550 with Significance Level 0.02665693
*************************************************************
sous-périodes utilisées 1990:02 1999:05 1999:06
2008:09
F(5,203)= 2.55227 with Significance Level 0.02891988
*************************************************************
sous-périodes utilisées 1990:02 1999:06 1999:07
2008:09
F(5,203)= 2.20362 with Significance Level 0.05531796
*************************************************************
sous-périodes utilisées 1990:02 1999:07 1999:08
2008:09
F(5,203)= 2.20362 with Significance Level 0.05531796
*************************************************************
sous-périodes utilisées 1990:02 1999:08 1999:09
2008:09
F(5,203)= 1.89775 with Significance Level 0.09618569
*************************************************************
sous-périodes utilisées 1990:02 1999:09 1999:10
2008:09
F(5,203)= 1.75756 with Significance Level 0.12314879
*************************************************************
sous-périodes utilisées 1990:02 1999:10 1999:11
2008:09
F(5,203)= 1.63843 with Significance Level 0.15133720
*************************************************************
sous-périodes utilisées 1990:02 1999:11 1999:12
2008:09
F(5,203)= 2.19268 with Significance Level 0.05644014
*************************************************************
sous-périodes utilisées 1990:02 1999:12 2000:01
2008:09
F(5,203)= 2.24306 with Significance Level 0.05144888
*************************************************************
sous-périodes utilisées 1990:02 2000:01 2000:02
2008:09
F(5,203)= 2.05188 with Significance Level 0.07294407
*************************************************************
sous-périodes utilisées 1990:02 2000:02 2000:03
2008:09
F(5,203)= 1.78030 with Significance Level 0.11834795
*************************************************************
sous-périodes utilisées 1990:02 2000:03 2000:04
2008:09
F(5,203)= 2.14868 with Significance Level 0.06117274
*************************************************************
sous-périodes utilisées 1990:02 2000:04 2000:05
2008:09
F(5,203)= 2.07089 with Significance Level 0.07047643
*************************************************************
sous-périodes utilisées 1990:02 2000:05 2000:06
2008:09
F(5,203)= 1.98490 with Significance Level 0.08230880
*************************************************************
sous-périodes utilisées 1990:02 2000:06 2000:07
2008:09
F(5,203)= 1.93647 with Significance Level 0.08977038
*************************************************************
sous-périodes utilisées 1990:02 2000:07 2000:08
2008:09
F(5,203)= 1.75033 with Significance Level 0.12471241
*************************************************************
sous-périodes utilisées 1990:02 2000:08 2000:09
2008:09
F(5,203)= 1.53029 with Significance Level 0.18183509
*************************************************************
sous-périodes utilisées 1990:02 2000:09 2000:10
2008:09
F(5,203)= 1.55639 with Significance Level 0.17401172
*************************************************************
sous-périodes utilisées 1990:02 2000:10 2000:11
2008:09
F(5,203)= 1.56642 with Significance Level 0.17108582
*************************************************************
sous-périodes utilisées 1990:02 2000:11 2000:12
2008:09
F(5,203)= 1.62285 with Significance Level 0.15542570
*************************************************************
sous-périodes utilisées 1990:02 2000:12 2001:01
2008:09
F(5,203)= 1.58058 with Significance Level 0.16702936
*************************************************************
sous-périodes utilisées 1990:02 2001:01 2001:02
2008:09
F(5,203)= 1.52517 with Significance Level 0.18340622
*************************************************************
sous-périodes utilisées 1990:02 2001:02 2001:03
2008:09
F(5,203)= 1.53758 with Significance Level 0.17961936
*************************************************************
sous-périodes utilisées 1990:02 2001:03 2001:04
2008:09
F(5,203)= 1.52553 with Significance Level 0.18329562
*************************************************************
sous-périodes utilisées 1990:02 2001:04 2001:05
2008:09
F(5,203)= 1.42174 with Significance Level 0.21780030
*************************************************************
sous-périodes utilisées 1990:02 2001:05 2001:06
2008:09
F(5,203)= 1.20711 with Significance Level 0.30706801
*************************************************************
sous-périodes utilisées 1990:02 2001:06 2001:07
2008:09
F(5,203)= 1.18660 with Significance Level 0.31697439
*************************************************************
sous-périodes utilisées 1990:02 2001:07 2001:08
2008:09
F(5,203)= 1.16522 with Significance Level 0.32757083
*************************************************************
sous-périodes utilisées 1990:02 2001:08 2001:09
2008:09
F(5,203)= 1.23009 with Significance Level 0.29626269
*************************************************************
sous-périodes utilisées 1990:02 2001:09 2001:10
2008:09
F(5,203)= 1.21887 with Significance Level 0.30149985
*************************************************************
sous-périodes utilisées 1990:02 2001:10 2001:11
2008:09
F(5,203)= 0.91521 with Significance Level 0.47208954
*************************************************************
sous-périodes utilisées 1990:02 2001:11 2001:12
2008:09
F(5,203)= 1.16494 with Significance Level 0.32771488
*************************************************************
sous-périodes utilisées 1990:02 2001:12 2002:01
2008:09
F(5,203)= 1.14371 with Significance Level 0.33851508
*************************************************************
sous-périodes utilisées 1990:02 2002:01 2002:02
2008:09
F(5,203)= 1.13937 with Significance Level 0.34075578
*************************************************************
sous-périodes utilisées 1990:02 2002:02 2002:03
2008:09
F(5,203)= 1.03509 with Significance Level 0.39806987
*************************************************************
sous-périodes utilisées 1990:02 2002:03 2002:04
2008:09
F(5,203)= 1.04115 with Significance Level 0.39455826
*************************************************************
sous-périodes utilisées 1990:02 2002:04 2002:05
2008:09
F(5,203)= 1.05006 with Significance Level 0.38943074
*************************************************************
sous-périodes utilisées 1990:02 2002:05 2002:06
2008:09
F(5,203)= 1.04031 with Significance Level 0.39504319
*************************************************************
sous-périodes utilisées 1990:02 2002:06 2002:07
2008:09
F(5,203)= 1.02304 with Significance Level 0.40511776
*************************************************************
sous-périodes utilisées 1990:02 2002:07 2002:08
2008:09
F(5,203)= 1.04081 with Significance Level 0.39475110
*************************************************************
sous-périodes utilisées 1990:02 2002:08 2002:09
2008:09
F(5,203)= 0.94230 with Significance Level 0.45462691
*************************************************************
sous-périodes utilisées 1990:02 2002:09 2002:10
2008:09
F(5,203)= 0.95810 with Significance Level 0.44463291
*************************************************************
sous-périodes utilisées 1990:02 2002:10 2002:11
2008:09
F(5,203)= 0.85735 with Significance Level 0.51077005
*************************************************************
sous-périodes utilisées 1990:02 2002:11 2002:12
2008:09
F(5,203)= 0.80588 with Significance Level 0.54664257
*************************************************************
sous-périodes utilisées 1990:02 2002:12 2003:01
2008:09
F(5,203)= 0.77055 with Significance Level 0.57198356
*************************************************************
sous-périodes utilisées 1990:02 2003:01 2003:02
2008:09
F(5,203)= 0.84270 with Significance Level 0.52084900
*************************************************************
sous-périodes utilisées 1990:02 2003:02 2003:03
2008:09
F(5,203)= 0.91669 with Significance Level 0.47112433
*************************************************************
sous-périodes utilisées 1990:02 2003:03 2003:04
2008:09
F(5,203)= 0.72622 with Significance Level 0.60449134
*************************************************************
sous-périodes utilisées 1990:02 2003:04 2003:05
2008:09
F(5,203)= 0.65912 with Significance Level 0.65488109
*************************************************************
sous-périodes utilisées 1990:02 2003:05 2003:06
2008:09
F(5,203)= 0.65664 with Significance Level 0.65676534
*************************************************************
sous-périodes utilisées 1990:02 2003:06 2003:07
2008:09
F(5,203)= 0.65338 with Significance Level 0.65924650
*************************************************************
sous-périodes utilisées 1990:02 2003:07 2003:08
2008:09
F(5,203)= 0.65757 with Significance Level 0.65606121
*************************************************************
sous-périodes utilisées 1990:02 2003:08 2003:09
2008:09
F(5,203)= 0.74985 with Significance Level 0.58706714
*************************************************************
sous-périodes utilisées 1990:02 2003:09 2003:10
2008:09
F(5,203)= 0.70840 with Significance Level 0.61775365
*************************************************************
sous-périodes utilisées 1990:02 2003:10 2003:11
2008:09
F(5,203)= 0.60384 with Significance Level 0.69705600
*************************************************************
sous-périodes utilisées 1990:02 2003:11 2003:12
2008:09
F(5,203)= 0.56119 with Significance Level 0.72967292
*************************************************************
sous-périodes utilisées 1990:02 2003:12 2004:01
2008:09
F(5,203)= 0.57348 with Significance Level 0.72027975
*************************************************************
sous-périodes utilisées 1990:02 2004:01 2004:02
2008:09
F(5,203)= 0.58138 with Significance Level 0.71423674
*************************************************************
sous-périodes utilisées 1990:02 2004:02 2004:03
2008:09
F(5,203)= 0.58393 with Significance Level 0.71228830
*************************************************************
sous-périodes utilisées 1990:02 2004:03 2004:04
2008:09
F(5,203)= 0.59139 with Significance Level 0.70657825
*************************************************************
sous-périodes utilisées 1990:02 2004:04 2004:05
2008:09
F(5,203)= 0.56387 with Significance Level 0.72762842
*************************************************************
sous-périodes utilisées 1990:02 2004:05 2004:06
2008:09
F(5,203)= 0.61109 with Significance Level 0.69150927
*************************************************************
sous-périodes utilisées 1990:02 2004:06 2004:07
2008:09
F(5,203)= 0.58955 with Significance Level 0.70798554
*************************************************************
sous-périodes utilisées 1990:02 2004:07 2004:08
2008:09
F(5,203)= 0.60400 with Significance Level 0.69693221
*************************************************************
sous-périodes utilisées 1990:02 2004:08 2004:09
2008:09
F(5,203)= 0.60762 with Significance Level 0.69416221
*************************************************************
sous-périodes utilisées 1990:02 2004:09 2004:10
2008:09
F(5,203)= 0.60146 with Significance Level 0.69887310
*************************************************************
sous-périodes utilisées 1990:02 2004:10 2004:11
2008:09
F(5,203)= 0.61611 with Significance Level 0.68766647
*************************************************************
sous-périodes utilisées 1990:02 2004:11 2004:12
2008:09
F(5,203)= 0.67225 with Significance Level 0.64493237
*************************************************************
sous-périodes utilisées 1990:02 2004:12 2005:01
2008:09
F(5,203)= 0.76441 with Significance Level 0.57644137
*************************************************************
sous-périodes utilisées 1990:02 2005:01 2005:02
2008:09
F(5,203)= 0.76876 with Significance Level 0.57328175
*************************************************************
sous-périodes utilisées 1990:02 2005:02 2005:03
2008:09
F(5,203)= 0.76844 with Significance Level 0.57351156
*************************************************************
sous-périodes utilisées 1990:02 2005:03 2005:04
2008:09
F(5,203)= 0.90648 with Significance Level 0.47780857
*************************************************************
sous-périodes utilisées 1990:02 2005:04 2005:05
2008:09
F(5,203)= 0.91300 with Significance Level 0.47353698
*************************************************************
sous-périodes utilisées 1990:02 2005:05 2005:06
2008:09
F(5,203)= 0.91765 with Significance Level 0.47050142
*************************************************************
sous-périodes utilisées 1990:02 2005:06 2005:07
2008:09
F(5,203)= 0.91810 with Significance Level 0.47020831
*************************************************************
sous-périodes utilisées 1990:02 2005:07 2005:08
2008:09
F(5,203)= 1.02920 with Significance Level 0.40150143
*************************************************************
sous-périodes utilisées 1990:02 2005:08 2005:09
2008:09
F(5,203)= 1.00364 with Significance Level 0.41666046
*************************************************************
sous-périodes utilisées 1990:02 2005:09 2005:10
2008:09
F(5,203)= 1.10195 with Significance Level 0.36055552
*************************************************************
sous-périodes utilisées 1990:02 2005:10 2005:11
2008:09
F(5,203)= 1.08710 with Significance Level 0.36864807
*************************************************************
sous-périodes utilisées 1990:02 2005:11 2005:12
2008:09
F(5,203)= 0.78302 with Significance Level 0.56297775
*************************************************************
sous-périodes utilisées 1990:02 2005:12 2006:01
2008:09
F(5,203)= 0.76031 with Significance Level 0.57942258
*************************************************************
sous-périodes utilisées 1990:02 2006:01 2006:02
2008:09
F(5,203)= 0.77536 with Significance Level 0.56850377
*************************************************************
sous-périodes utilisées 1990:02 2006:02 2006:03
2008:09
F(5,203)= 0.76666 with Significance Level 0.57480155
*************************************************************
sous-périodes utilisées 1990:02 2006:03 2006:04
2008:09
F(5,203)= 0.70162 with Significance Level 0.62282307
*************************************************************
sous-périodes utilisées 1990:02 2006:04 2006:05
2008:09
F(5,203)= 0.58212 with Significance Level 0.71367768
*************************************************************
sous-périodes utilisées 1990:02 2006:05 2006:06
2008:09
F(5,203)= 0.62637 with Significance Level 0.67983022
*************************************************************
sous-périodes utilisées 1990:02 2006:06 2006:07
2008:09
F(5,203)= 0.62573 with Significance Level 0.68031652
*************************************************************
sous-périodes utilisées 1990:02 2006:07 2006:08
2008:09
F(5,203)= 0.56771 with Significance Level 0.72469259
*************************************************************
sous-périodes utilisées 1990:02 2006:08 2006:09
2008:09
F(5,203)= 0.56517 with Significance Level 0.72663206
*************************************************************
sous-périodes utilisées 1990:02 2006:09 2006:10
2008:09
F(5,203)= 0.58080 with Significance Level 0.71468332
*************************************************************
sous-périodes utilisées 1990:02 2006:10 2006:11
2008:09
F(5,203)= 0.58344 with Significance Level 0.71266726
*************************************************************
sous-périodes utilisées 1990:02 2006:11 2006:12
2008:09
F(5,203)= 0.61445 with Significance Level 0.68893692
*************************************************************
sous-périodes utilisées 1990:02 2006:12 2007:01
2008:09
F(5,203)= 0.50731 with Significance Level 0.77055378
*************************************************************
sous-périodes utilisées 1990:02 2007:01 2007:02
2008:09
F(5,203)= 0.39651 with Significance Level 0.85087749
*************************************************************
sous-périodes utilisées 1990:02 2007:02 2007:03
2008:09
F(5,203)= 0.36223 with Significance Level 0.87392000
*************************************************************
sous-périodes utilisées 1990:02 2007:03 2007:04
2008:09
F(5,203)= 0.36187 with Significance Level 0.87415788
*************************************************************
sous-périodes utilisées 1990:02 2007:04 2007:05
2008:09
F(5,203)= 0.18321 with Significance Level 0.96870352
*************************************************************
**************************
LE MODELE EST INSTABLE
le plus grand fisher f= 5.976 pour un niveau de
significativité ns= 0.000035
le point correspondant à ce plus grand fisher est
1993:06
**************************
*************************************************************
sous-périodes utilisées 1990:02 1990:08 1990:09
2008:09
F(5,214)= 0.37787 with Significance Level 0.86358320
*************************************************************
sous-périodes utilisées 1990:02 1990:09 1990:10
2008:09
F(5,214)= 0.33353 with Significance Level 0.89230805
*************************************************************
sous-périodes utilisées 1990:02 1990:10 1990:11
2008:09
F(5,214)= 0.68796 with Significance Level 0.63305442
*************************************************************
sous-périodes utilisées 1990:02 1990:11 1990:12
2008:09
F(5,214)= 1.07852 with Significance Level 0.37321149
*************************************************************
sous-périodes utilisées 1990:02 1990:12 1991:01
2008:09
F(5,214)= 1.15583 with Significance Level 0.33211071
*************************************************************
sous-périodes utilisées 1990:02 1991:01 1991:02
2008:09
F(5,214)= 1.50822 with Significance Level 0.18842450
*************************************************************
sous-périodes utilisées 1990:02 1991:02 1991:03
2008:09
F(5,214)= 2.15735 with Significance Level 0.05998366
*************************************************************
sous-périodes utilisées 1990:02 1991:03 1991:04
2008:09
F(5,214)= 2.14715 with Significance Level 0.06111477
*************************************************************
sous-périodes utilisées 1990:02 1991:04 1991:05
2008:09
F(5,214)= 2.08067 with Significance Level 0.06899762
*************************************************************
sous-périodes utilisées 1990:02 1991:05 1991:06
2008:09
F(5,214)= 2.33398 with Significance Level 0.04328893
*************************************************************
sous-périodes utilisées 1990:02 1991:06 1991:07
2008:09
F(5,214)= 2.33499 with Significance Level 0.04320799
*************************************************************
sous-périodes utilisées 1990:02 1991:07 1991:08
2008:09
F(5,214)= 2.27374 with Significance Level 0.04840873
*************************************************************
sous-périodes utilisées 1990:02 1991:08 1991:09
2008:09
F(5,214)= 1.78899 with Significance Level 0.11628974
*************************************************************
sous-périodes utilisées 1990:02 1991:09 1991:10
2008:09
F(5,214)= 2.09665 with Significance Level 0.06701899
*************************************************************
sous-périodes utilisées 1990:02 1991:10 1991:11
2008:09
F(5,214)= 2.24402 with Significance Level 0.05114270
*************************************************************
sous-périodes utilisées 1990:02 1991:11 1991:12
2008:09
F(5,214)= 2.35575 with Significance Level 0.04157039
*************************************************************
sous-périodes utilisées 1990:02 1991:12 1992:01
2008:09
F(5,214)= 2.51416 with Significance Level 0.03089559
*************************************************************
sous-périodes utilisées 1990:02 1992:01 1992:02
2008:09
F(5,214)= 2.58455 with Significance Level 0.02705138
*************************************************************
sous-périodes utilisées 1990:02 1992:02 1992:03
2008:09
F(5,214)= 2.50504 with Significance Level 0.03143044
*************************************************************
sous-périodes utilisées 1990:02 1992:03 1992:04
2008:09
F(5,214)= 2.49469 with Significance Level 0.03204884
*************************************************************
sous-périodes utilisées 1990:02 1992:04 1992:05
2008:09
F(5,214)= 2.32833 with Significance Level 0.04374677
*************************************************************
sous-périodes utilisées 1990:02 1992:05 1992:06
2008:09
F(5,214)= 2.20341 with Significance Level 0.05511883
*************************************************************
sous-périodes utilisées 1990:02 1992:06 1992:07
2008:09
F(5,214)= 2.14776 with Significance Level 0.06104601
*************************************************************
sous-périodes utilisées 1990:02 1992:07 1992:08
2008:09
F(5,214)= 2.02891 with Significance Level 0.07579141
*************************************************************
sous-périodes utilisées 1990:02 1992:08 1992:09
2008:09
F(5,214)= 2.23595 with Significance Level 0.05191024
*************************************************************
sous-périodes utilisées 1990:02 1992:09 1992:10
2008:09
F(5,214)= 1.79822 with Significance Level 0.11441744
*************************************************************
sous-périodes utilisées 1990:02 1992:10 1992:11
2008:09
F(5,214)= 5.30273 with Significance Level 0.00012928
*************************************************************
sous-périodes utilisées 1990:02 1992:11 1992:12
2008:09
F(5,214)= 5.54779 with Significance Level 0.00007933
*************************************************************
sous-périodes utilisées 1990:02 1992:12 1993:01
2008:09
F(5,214)= 4.67465 with Significance Level 0.00045183
*************************************************************
sous-périodes utilisées 1990:02 1993:01 1993:02
2008:09
F(5,214)= 6.00154 with Significance Level 0.00003214
*************************************************************
sous-périodes utilisées 1990:02 1993:02 1993:03
2008:09
F(5,214)= 6.00315 with Significance Level 0.00003204
*************************************************************
sous-périodes utilisées 1990:02 1993:03 1993:04
2008:09
F(5,214)= 6.47463 with Significance Level 0.00001256
*************************************************************
sous-périodes utilisées 1990:02 1993:04 1993:05
2008:09
F(5,214)= 6.46774 with Significance Level 0.00001273
*************************************************************
sous-périodes utilisées 1990:02 1993:05 1993:06
2008:09
F(5,214)= 6.48669 with Significance Level 0.00001226
*************************************************************
sous-périodes utilisées 1990:02 1993:06 1993:07
2008:09
F(5,214)= 6.10877 with Significance Level 0.00002597
*************************************************************
sous-périodes utilisées 1990:02 1993:07 1993:08
2008:09
F(5,214)= 6.43614 with Significance Level 0.00001355
*************************************************************
sous-périodes utilisées 1990:02 1993:08 1993:09
2008:09
F(5,214)= 6.43042 with Significance Level 0.00001371
*************************************************************
sous-périodes utilisées 1990:02 1993:09 1993:10
2008:09
F(5,214)= 6.43645 with Significance Level 0.00001355
*************************************************************
sous-périodes utilisées 1990:02 1993:10 1993:11
2008:09
F(5,214)= 6.51618 with Significance Level 0.00001156
*************************************************************
sous-périodes utilisées 1990:02 1993:11 1993:12
2008:09
F(5,214)= 6.40487 with Significance Level 0.00001442
*************************************************************
sous-périodes utilisées 1990:02 1993:12 1994:01
2008:09
F(5,214)= 6.39147 with Significance Level 0.00001481
*************************************************************
sous-périodes utilisées 1990:02 1994:01 1994:02
2008:09
F(5,214)= 6.68892 with Significance Level 0.00000821
*************************************************************
sous-périodes utilisées 1990:02 1994:02 1994:03
2008:09
F(5,214)= 6.69554 with Significance Level 0.00000810
*************************************************************
sous-périodes utilisées 1990:02 1994:03 1994:04
2008:09
F(5,214)= 6.43703 with Significance Level 0.00001353
*************************************************************
sous-périodes utilisées 1990:02 1994:04 1994:05
2008:09
F(5,214)= 5.38774 with Significance Level 0.00010913
*************************************************************
sous-périodes utilisées 1990:02 1994:05 1994:06
2008:09
F(5,214)= 5.18096 with Significance Level 0.00016479
*************************************************************
sous-périodes utilisées 1990:02 1994:06 1994:07
2008:09
F(5,214)= 8.23527 with Significance Level 0.00000039
*************************************************************
sous-périodes utilisées 1990:02 1994:07 1994:08
2008:09
F(5,214)= 5.24254 with Significance Level 0.00014576
*************************************************************
sous-périodes utilisées 1990:02 1994:08 1994:09
2008:09
F(5,214)= 4.81519 with Significance Level 0.00034154
*************************************************************
sous-périodes utilisées 1990:02 1994:09 1994:10
2008:09
F(5,214)= 4.65711 with Significance Level 0.00046788
*************************************************************
sous-périodes utilisées 1990:02 1994:10 1994:11
2008:09
F(5,214)= 5.22780 with Significance Level 0.00015010
*************************************************************
sous-périodes utilisées 1990:02 1994:11 1994:12
2008:09
F(5,214)= 5.36851 with Significance Level 0.00011340
*************************************************************
sous-périodes utilisées 1990:02 1994:12 1995:01
2008:09
F(5,214)= 5.25495 with Significance Level 0.00014219
*************************************************************
sous-périodes utilisées 1990:02 1995:01 1995:02
2008:09
F(5,214)= 5.17231 with Significance Level 0.00016765
*************************************************************
sous-périodes utilisées 1990:02 1995:02 1995:03
2008:09
F(5,214)= 5.12738 with Significance Level 0.00018336
*************************************************************
sous-périodes utilisées 1990:02 1995:03 1995:04
2008:09
F(5,214)= 4.68291 with Significance Level 0.00044446
*************************************************************
sous-périodes utilisées 1990:02 1995:04 1995:05
2008:09
F(5,214)= 4.19785 with Significance Level 0.00116544
*************************************************************
sous-périodes utilisées 1990:02 1995:05 1995:06
2008:09
F(5,214)= 4.29561 with Significance Level 0.00095994
*************************************************************
sous-périodes utilisées 1990:02 1995:06 1995:07
2008:09
F(5,214)= 4.21473 with Significance Level 0.00112706
*************************************************************
sous-périodes utilisées 1990:02 1995:07 1995:08
2008:09
F(5,214)= 4.21605 with Significance Level 0.00112412
*************************************************************
sous-périodes utilisées 1990:02 1995:08 1995:09
2008:09
F(5,214)= 4.21166 with Significance Level 0.00113396
*************************************************************
sous-périodes utilisées 1990:02 1995:09 1995:10
2008:09
F(5,214)= 4.22330 with Significance Level 0.00110808
*************************************************************
sous-périodes utilisées 1990:02 1995:10 1995:11
2008:09
F(5,214)= 3.59588 with Significance Level 0.00382657
*************************************************************
sous-périodes utilisées 1990:02 1995:11 1995:12
2008:09
F(5,214)= 3.75891 with Significance Level 0.00277642
*************************************************************
sous-périodes utilisées 1990:02 1995:12 1996:01
2008:09
F(5,214)= 3.65357 with Significance Level 0.00341631
*************************************************************
sous-périodes utilisées 1990:02 1996:01 1996:02
2008:09
F(5,214)= 3.47856 with Significance Level 0.00481701
*************************************************************
sous-périodes utilisées 1990:02 1996:02 1996:03
2008:09
F(5,214)= 2.65306 with Significance Level 0.02375734
*************************************************************
sous-périodes utilisées 1990:02 1996:03 1996:04
2008:09
F(5,214)= 2.59177 with Significance Level 0.02668468
*************************************************************
sous-périodes utilisées 1990:02 1996:04 1996:05
2008:09
F(5,214)= 2.10095 with Significance Level 0.06649611
*************************************************************
sous-périodes utilisées 1990:02 1996:05 1996:06
2008:09
F(5,214)= 2.07644 with Significance Level 0.06953070
*************************************************************
sous-périodes utilisées 1990:02 1996:06 1996:07
2008:09
F(5,214)= 2.04254 with Significance Level 0.07394292
*************************************************************
sous-périodes utilisées 1990:02 1996:07 1996:08
2008:09
F(5,214)= 2.07776 with Significance Level 0.06936414
*************************************************************
sous-périodes utilisées 1990:02 1996:08 1996:09
2008:09
F(5,214)= 1.85703 with Significance Level 0.10312665
*************************************************************
sous-périodes utilisées 1990:02 1996:09 1996:10
2008:09
F(5,214)= 1.79951 with Significance Level 0.11415664
*************************************************************
sous-périodes utilisées 1990:02 1996:10 1996:11
2008:09
F(5,214)= 2.01205 with Significance Level 0.07813600
*************************************************************
sous-périodes utilisées 1990:02 1996:11 1996:12
2008:09
F(5,214)= 1.80098 with Significance Level 0.11386174
*************************************************************
sous-périodes utilisées 1990:02 1996:12 1997:01
2008:09
F(5,214)= 1.88384 with Significance Level 0.09833151
*************************************************************
sous-périodes utilisées 1990:02 1997:01 1997:02
2008:09
F(5,214)= 2.05498 with Significance Level 0.07229369
*************************************************************
sous-périodes utilisées 1990:02 1997:02 1997:03
2008:09
F(5,214)= 1.89376 with Significance Level 0.09660994
*************************************************************
sous-périodes utilisées 1990:02 1997:03 1997:04
2008:09
F(5,214)= 1.60356 with Significance Level 0.16035418
*************************************************************
sous-périodes utilisées 1990:02 1997:04 1997:05
2008:09
F(5,214)= 1.55953 with Significance Level 0.17281750
*************************************************************
sous-périodes utilisées 1990:02 1997:05 1997:06
2008:09
F(5,214)= 1.54398 with Significance Level 0.17742284
*************************************************************
sous-périodes utilisées 1990:02 1997:06 1997:07
2008:09
F(5,214)= 1.50322 with Significance Level 0.19001037
*************************************************************
sous-périodes utilisées 1990:02 1997:07 1997:08
2008:09
F(5,214)= 1.61999 with Significance Level 0.15591387
*************************************************************
sous-périodes utilisées 1990:02 1997:08 1997:09
2008:09
F(5,214)= 1.59947 with Significance Level 0.16147916
*************************************************************
sous-périodes utilisées 1990:02 1997:09 1997:10
2008:09
F(5,214)= 1.61919 with Significance Level 0.15612738
*************************************************************
sous-périodes utilisées 1990:02 1997:10 1997:11
2008:09
F(5,214)= 1.32794 with Significance Level 0.25343094
*************************************************************
sous-périodes utilisées 1990:02 1997:11 1997:12
2008:09
F(5,214)= 1.12905 with Significance Level 0.34593674
*************************************************************
sous-périodes utilisées 1990:02 1997:12 1998:01
2008:09
F(5,214)= 1.05753 with Significance Level 0.38499887
*************************************************************
sous-périodes utilisées 1990:02 1998:01 1998:02
2008:09
F(5,214)= 1.15910 with Significance Level 0.33045261
*************************************************************
sous-périodes utilisées 1990:02 1998:02 1998:03
2008:09
F(5,214)= 1.16490 with Significance Level 0.32752654
*************************************************************
sous-périodes utilisées 1990:02 1998:03 1998:04
2008:09
F(5,214)= 1.37214 with Significance Level 0.23593786
*************************************************************
sous-périodes utilisées 1990:02 1998:04 1998:05
2008:09
F(5,214)= 1.36922 with Significance Level 0.23706113
*************************************************************
sous-périodes utilisées 1990:02 1998:05 1998:06
2008:09
F(5,214)= 1.29966 with Significance Level 0.26518514
*************************************************************
sous-périodes utilisées 1990:02 1998:06 1998:07
2008:09
F(5,214)= 1.30443 with Significance Level 0.26317139
*************************************************************
sous-périodes utilisées 1990:02 1998:07 1998:08
2008:09
F(5,214)= 1.30527 with Significance Level 0.26281930
*************************************************************
sous-périodes utilisées 1990:02 1998:08 1998:09
2008:09
F(5,214)= 1.22860 with Significance Level 0.29673197
*************************************************************
sous-périodes utilisées 1990:02 1998:09 1998:10
2008:09
F(5,214)= 1.42378 with Significance Level 0.21681118
*************************************************************
sous-périodes utilisées 1990:02 1998:10 1998:11
2008:09
F(5,214)= 1.35618 with Significance Level 0.24213087
*************************************************************
sous-périodes utilisées 1990:02 1998:11 1998:12
2008:09
F(5,214)= 1.46717 with Significance Level 0.20179182
*************************************************************
sous-périodes utilisées 1990:02 1998:12 1999:01
2008:09
F(5,214)= 1.45983 with Significance Level 0.20426712
*************************************************************
sous-périodes utilisées 1990:02 1999:01 1999:02
2008:09
F(5,214)= 1.53272 with Significance Level 0.18082460
*************************************************************
sous-périodes utilisées 1990:02 1999:02 1999:03
2008:09
F(5,214)= 1.45113 with Significance Level 0.20723486
*************************************************************
sous-périodes utilisées 1990:02 1999:03 1999:04
2008:09
F(5,214)= 1.42041 with Significance Level 0.21801588
*************************************************************
sous-périodes utilisées 1990:02 1999:04 1999:05
2008:09
F(5,214)= 1.44355 with Significance Level 0.20985110
*************************************************************
sous-périodes utilisées 1990:02 1999:05 1999:06
2008:09
F(5,214)= 1.43435 with Significance Level 0.21306600
*************************************************************
sous-périodes utilisées 1990:02 1999:06 1999:07
2008:09
F(5,214)= 1.21056 with Significance Level 0.30520658
*************************************************************
sous-périodes utilisées 1990:02 1999:07 1999:08
2008:09
F(5,214)= 1.02007 with Significance Level 0.40671583
*************************************************************
sous-périodes utilisées 1990:02 1999:08 1999:09
2008:09
F(5,214)= 0.84033 with Significance Level 0.52240022
*************************************************************
sous-périodes utilisées 1990:02 1999:09 1999:10
2008:09
F(5,214)= 0.89653 with Significance Level 0.48427079
*************************************************************
sous-périodes utilisées 1990:02 1999:10 1999:11
2008:09
F(5,214)= 0.80772 with Significance Level 0.54526284
*************************************************************
sous-périodes utilisées 1990:02 1999:11 1999:12
2008:09
F(5,214)= 1.12851 with Significance Level 0.34621955
*************************************************************
sous-périodes utilisées 1990:02 1999:12 2000:01
2008:09
F(5,214)= 1.12998 with Significance Level 0.34544817
*************************************************************
sous-périodes utilisées 1990:02 2000:01 2000:02
2008:09
F(5,214)= 0.88260 with Significance Level 0.49356647
*************************************************************
sous-périodes utilisées 1990:02 2000:02 2000:03
2008:09
F(5,214)= 0.64121 with Significance Level 0.66849676
*************************************************************
sous-périodes utilisées 1990:02 2000:03 2000:04
2008:09
F(5,214)= 0.75435 with Significance Level 0.58372456
*************************************************************
sous-périodes utilisées 1990:02 2000:04 2000:05
2008:09
F(5,214)= 0.77045 with Significance Level 0.57199752
*************************************************************
sous-périodes utilisées 1990:02 2000:05 2000:06
2008:09
F(5,214)= 0.52399 with Significance Level 0.75798475
*************************************************************
sous-périodes utilisées 1990:02 2000:06 2000:07
2008:09
F(5,214)= 0.52201 with Significance Level 0.75948280
*************************************************************
sous-périodes utilisées 1990:02 2000:07 2000:08
2008:09
F(5,214)= 0.43747 with Significance Level 0.82207349
*************************************************************
sous-périodes utilisées 1990:02 2000:08 2000:09
2008:09
F(5,214)= 0.39691 with Significance Level 0.85063419
*************************************************************
sous-périodes utilisées 1990:02 2000:09 2000:10
2008:09
F(5,214)= 0.36729 with Significance Level 0.87062540
*************************************************************
sous-périodes utilisées 1990:02 2000:10 2000:11
2008:09
F(5,214)= 0.35482 with Significance Level 0.87878612
*************************************************************
sous-périodes utilisées 1990:02 2000:11 2000:12
2008:09
F(5,214)= 0.36151 with Significance Level 0.87442647
*************************************************************
sous-périodes utilisées 1990:02 2000:12 2001:01
2008:09
F(5,214)= 0.37012 with Significance Level 0.86875359
*************************************************************
sous-périodes utilisées 1990:02 2001:01 2001:02
2008:09
F(5,214)= 0.34957 with Significance Level 0.88216777
*************************************************************
sous-périodes utilisées 1990:02 2001:02 2001:03
2008:09
F(5,214)= 0.33510 with Significance Level 0.89132987
*************************************************************
sous-périodes utilisées 1990:02 2001:03 2001:04
2008:09
F(5,214)= 0.32398 with Significance Level 0.89820183
*************************************************************
sous-périodes utilisées 1990:02 2001:04 2001:05
2008:09
F(5,214)= 0.31737 with Significance Level 0.90221157
*************************************************************
sous-périodes utilisées 1990:02 2001:05 2001:06
2008:09
F(5,214)= 0.26549 with Significance Level 0.93154218
*************************************************************
sous-périodes utilisées 1990:02 2001:06 2001:07
2008:09
F(5,214)= 0.28198 with Significance Level 0.92265494
*************************************************************
sous-périodes utilisées 1990:02 2001:07 2001:08
2008:09
F(5,214)= 0.26477 with Significance Level 0.93191805
*************************************************************
sous-périodes utilisées 1990:02 2001:08 2001:09
2008:09
F(5,214)= 0.27011 with Significance Level 0.92909321
*************************************************************
sous-périodes utilisées 1990:02 2001:09 2001:10
2008:09
F(5,214)= 0.46623 with Significance Level 0.80114977
*************************************************************
sous-périodes utilisées 1990:02 2001:10 2001:11
2008:09
F(5,214)= 0.36180 with Significance Level 0.87423660
*************************************************************
sous-périodes utilisées 1990:02 2001:11 2001:12
2008:09
F(5,214)= 0.47094 with Significance Level 0.79768049
*************************************************************
sous-périodes utilisées 1990:02 2001:12 2002:01
2008:09
F(5,214)= 0.46163 with Significance Level 0.80452988
*************************************************************
sous-périodes utilisées 1990:02 2002:01 2002:02
2008:09
F(5,214)= 0.46654 with Significance Level 0.80092474
*************************************************************
sous-périodes utilisées 1990:02 2002:02 2002:03
2008:09
F(5,214)= 0.45433 with Significance Level 0.80986610
*************************************************************
sous-périodes utilisées 1990:02 2002:03 2002:04
2008:09
F(5,214)= 0.45826 with Significance Level 0.80699835
*************************************************************
sous-périodes utilisées 1990:02 2002:04 2002:05
2008:09
F(5,214)= 0.46844 with Significance Level 0.79952520
*************************************************************
sous-périodes utilisées 1990:02 2002:05 2002:06
2008:09
F(5,214)= 0.47079 with Significance Level 0.79779542
*************************************************************
sous-périodes utilisées 1990:02 2002:06 2002:07
2008:09
F(5,214)= 0.44390 with Significance Level 0.81743389
*************************************************************
sous-périodes utilisées 1990:02 2002:07 2002:08
2008:09
F(5,214)= 0.44809 with Significance Level 0.81439895
*************************************************************
sous-périodes utilisées 1990:02 2002:08 2002:09
2008:09
F(5,214)= 0.43173 with Significance Level 0.82618858
*************************************************************
sous-périodes utilisées 1990:02 2002:09 2002:10
2008:09
F(5,214)= 0.46072 with Significance Level 0.80519495
*************************************************************
sous-périodes utilisées 1990:02 2002:10 2002:11
2008:09
F(5,214)= 0.44890 with Significance Level 0.81381307
*************************************************************
sous-périodes utilisées 1990:02 2002:11 2002:12
2008:09
F(5,214)= 0.42585 with Significance Level 0.83037570
*************************************************************
sous-périodes utilisées 1990:02 2002:12 2003:01
2008:09
F(5,214)= 0.36328 with Significance Level 0.87327102
*************************************************************
sous-périodes utilisées 1990:02 2003:01 2003:02
2008:09
F(5,214)= 0.34792 with Significance Level 0.88322632
*************************************************************
sous-périodes utilisées 1990:02 2003:02 2003:03
2008:09
F(5,214)= 0.31156 with Significance Level 0.90568620
*************************************************************
sous-périodes utilisées 1990:02 2003:03 2003:04
2008:09
F(5,214)= 0.33206 with Significance Level 0.89322537
*************************************************************
sous-périodes utilisées 1990:02 2003:04 2003:05
2008:09
F(5,214)= 0.28895 with Significance Level 0.91877026
*************************************************************
sous-périodes utilisées 1990:02 2003:05 2003:06
2008:09
F(5,214)= 0.28596 with Significance Level 0.92044566
*************************************************************
sous-périodes utilisées 1990:02 2003:06 2003:07
2008:09
F(5,214)= 0.32595 with Significance Level 0.89699308
*************************************************************
sous-périodes utilisées 1990:02 2003:07 2003:08
2008:09
F(5,214)= 0.32409 with Significance Level 0.89813291
*************************************************************
sous-périodes utilisées 1990:02 2003:08 2003:09
2008:09
F(5,214)= 0.37137 with Significance Level 0.86792711
*************************************************************
sous-périodes utilisées 1990:02 2003:09 2003:10
2008:09
F(5,214)= 0.41737 with Significance Level 0.83638276
*************************************************************
sous-périodes utilisées 1990:02 2003:10 2003:11
2008:09
F(5,214)= 0.38473 with Significance Level 0.85895674
*************************************************************
sous-périodes utilisées 1990:02 2003:11 2003:12
2008:09
F(5,214)= 0.37166 with Significance Level 0.86773106
*************************************************************
sous-périodes utilisées 1990:02 2003:12 2004:01
2008:09
F(5,214)= 0.36805 with Significance Level 0.87012226
*************************************************************
sous-périodes utilisées 1990:02 2004:01 2004:02
2008:09
F(5,214)= 0.36859 with Significance Level 0.86976554
*************************************************************
sous-périodes utilisées 1990:02 2004:02 2004:03
2008:09
F(5,214)= 0.37458 with Significance Level 0.86578325
*************************************************************
sous-périodes utilisées 1990:02 2004:03 2004:04
2008:09
F(5,214)= 0.35143 with Significance Level 0.88096919
*************************************************************
sous-périodes utilisées 1990:02 2004:04 2004:05
2008:09
F(5,214)= 0.34251 with Significance Level 0.88666748
*************************************************************
sous-périodes utilisées 1990:02 2004:05 2004:06
2008:09
F(5,214)= 0.35384 with Significance Level 0.87941504
*************************************************************
sous-périodes utilisées 1990:02 2004:06 2004:07
2008:09
F(5,214)= 0.33788 with Significance Level 0.88958724
*************************************************************
sous-périodes utilisées 1990:02 2004:07 2004:08
2008:09
F(5,214)= 0.34576 with Significance Level 0.88460218
*************************************************************
sous-périodes utilisées 1990:02 2004:08 2004:09
2008:09
F(5,214)= 0.35039 with Significance Level 0.88164274
*************************************************************
sous-périodes utilisées 1990:02 2004:09 2004:10
2008:09
F(5,214)= 0.37246 with Significance Level 0.86719863
*************************************************************
sous-périodes utilisées 1990:02 2004:10 2004:11
2008:09
F(5,214)= 0.36194 with Significance Level 0.87414518
*************************************************************
sous-périodes utilisées 1990:02 2004:11 2004:12
2008:09
F(5,214)= 0.40065 with Significance Level 0.84805948
*************************************************************
sous-périodes utilisées 1990:02 2004:12 2005:01
2008:09
F(5,214)= 0.42278 with Significance Level 0.83255793
*************************************************************
sous-périodes utilisées 1990:02 2005:01 2005:02
2008:09
F(5,214)= 0.42467 with Significance Level 0.83121844
*************************************************************
sous-périodes utilisées 1990:02 2005:02 2005:03
2008:09
F(5,214)= 0.42375 with Significance Level 0.83186768
*************************************************************
sous-périodes utilisées 1990:02 2005:03 2005:04
2008:09
F(5,214)= 0.48528 with Significance Level 0.78705870
*************************************************************
sous-périodes utilisées 1990:02 2005:04 2005:05
2008:09
F(5,214)= 0.45257 with Significance Level 0.81114756
*************************************************************
sous-périodes utilisées 1990:02 2005:05 2005:06
2008:09
F(5,214)= 0.44712 with Significance Level 0.81510416
*************************************************************
sous-périodes utilisées 1990:02 2005:06 2005:07
2008:09
F(5,214)= 0.43929 with Significance Level 0.82076233
*************************************************************
sous-périodes utilisées 1990:02 2005:07 2005:08
2008:09
F(5,214)= 0.49335 with Significance Level 0.78104162
*************************************************************
sous-périodes utilisées 1990:02 2005:08 2005:09
2008:09
F(5,214)= 0.48879 with Significance Level 0.78444606
*************************************************************
sous-périodes utilisées 1990:02 2005:09 2005:10
2008:09
F(5,214)= 0.51113 with Significance Level 0.76769938
*************************************************************
sous-périodes utilisées 1990:02 2005:10 2005:11
2008:09
F(5,214)= 0.50910 with Significance Level 0.76922380
*************************************************************
sous-périodes utilisées 1990:02 2005:11 2005:12
2008:09
F(5,214)= 0.34840 with Significance Level 0.88292022
*************************************************************
sous-périodes utilisées 1990:02 2005:12 2006:01
2008:09
F(5,214)= 0.33802 with Significance Level 0.88950412
*************************************************************
sous-périodes utilisées 1990:02 2006:01 2006:02
2008:09
F(5,214)= 0.34546 with Significance Level 0.88479704
*************************************************************
sous-périodes utilisées 1990:02 2006:02 2006:03
2008:09
F(5,214)= 0.34743 with Significance Level 0.88353906
*************************************************************
sous-périodes utilisées 1990:02 2006:03 2006:04
2008:09
F(5,214)= 0.33482 with Significance Level 0.89150502
*************************************************************
sous-périodes utilisées 1990:02 2006:04 2006:05
2008:09
F(5,214)= 0.29508 with Significance Level 0.91529883
*************************************************************
sous-périodes utilisées 1990:02 2006:05 2006:06
2008:09
F(5,214)= 0.30771 with Significance Level 0.90796400
*************************************************************
sous-périodes utilisées 1990:02 2006:06 2006:07
2008:09
F(5,214)= 0.30852 with Significance Level 0.90749100
*************************************************************
sous-périodes utilisées 1990:02 2006:07 2006:08
2008:09
F(5,214)= 0.27912 with Significance Level 0.92422923
*************************************************************
sous-périodes utilisées 1990:02 2006:08 2006:09
2008:09
F(5,214)= 0.27900 with Significance Level 0.92429053
*************************************************************
sous-périodes utilisées 1990:02 2006:09 2006:10
2008:09
F(5,214)= 0.28379 with Significance Level 0.92165565
*************************************************************
sous-périodes utilisées 1990:02 2006:10 2006:11
2008:09
F(5,214)= 0.28338 with Significance Level 0.92188171
*************************************************************
sous-périodes utilisées 1990:02 2006:11 2006:12
2008:09
F(5,214)= 0.29063 with Significance Level 0.91782224
*************************************************************
sous-périodes utilisées 1990:02 2006:12 2007:01
2008:09
F(5,214)= 0.23693 with Significance Level 0.94586655
*************************************************************
sous-périodes utilisées 1990:02 2007:01 2007:02
2008:09
F(5,214)= 0.14495 with Significance Level 0.98136456
*************************************************************
sous-périodes utilisées 1990:02 2007:02 2007:03
2008:09
F(5,214)= 0.14098 with Significance Level 0.98249093
*************************************************************
sous-périodes utilisées 1990:02 2007:03 2007:04
2008:09
F(5,214)= 0.13985 with Significance Level 0.98280402
*************************************************************
sous-périodes utilisées 1990:02 2007:04 2007:05
2008:09
F(5,214)= 0.08046 with Significance Level 0.99519768
*************************************************************
sous-périodes utilisées 1990:02 2007:05 2007:06
2008:09
F(5,214)= 0.06082 with Significance Level 0.99752814
*************************************************************
sous-périodes utilisées 1990:02 2007:06 2007:07
2008:09
F(5,214)= 0.04181 with Significance Level 0.99899770
*************************************************************
sous-périodes utilisées 1990:02 2007:07 2007:08
2008:09
F(5,214)= 0.04362 with Significance Level 0.99888917
*************************************************************
sous-périodes utilisées 1990:02 2007:08 2007:09
2008:09
F(5,214)= 0.04974 with Significance Level 0.99847495
*************************************************************
sous-périodes utilisées 1990:02 2007:09 2007:10
2008:09
F(5,214)= 0.06579 with Significance Level 0.99701913
*************************************************************
sous-périodes utilisées 1990:02 2007:10 2007:11
2008:09
F(5,214)= 0.06715 with Significance Level 0.99687065
*************************************************************
sous-périodes utilisées 1990:02 2007:11 2007:12
2008:09
F(5,214)= 0.11175 with Significance Level 0.98968120
*************************************************************
sous-périodes utilisées 1990:02 2007:12 2008:01
2008:09
F(5,214)= 0.16552 with Significance Level 0.97496122
*************************************************************
sous-périodes utilisées 1990:02 2008:01 2008:02
2008:09
F(5,214)= 0.17113 with Significance Level 0.97305529
*************************************************************
sous-périodes utilisées 1990:02 2008:02 2008:03
2008:09
F(5,214)= 0.15847 with Significance Level 0.97726041
*************************************************************
sous-périodes utilisées 1990:02 2008:03 2008:04
2008:09
F(5,214)= 0.23869 with Significance Level 0.94502824
*************************************************************
**************************
LE MODELE EST INSTABLE
le plus grand fisher f= 8.235 pour un niveau de
significativité ns= 0.000000
le point correspondant à ce plus grand fisher est
1994:07
**************************
Linear Regression - Estimation by Least Squares
Dependent Variable DTAUX_10_ANS
Monthly Data From 1990:01 To 2008:09
Usable Observations 224 Degrees of Freedom 219
Total Observations 225 Skipped/Missing 1
Centered R**2 0.354573 R Bar **2 0.342784
Uncentered R**2 0.367552 T x R**2 82.332
Mean of Dependent Variable -0.040178571
Std Error of Dependent Variable 0.281096451
Standard Error of Estimate 0.227881627
Sum of Squared Residuals 11.372677849
Regression F(4,219) 30.0776
Significance Level of F 0.00000000
Log Likelihood 15.96618
Durbin-Watson Statistic 1.527258
Variable Coeff Std Error
T-Stat Signif
*******************************************************************************
1. Constant -0.026925151 0.016448225
-1.63696 0.10307415
2. DCPI 0.019309144 0.012305271
1.56918 0.11805048
3. DTAUX_3_MOIS 0.237924630 0.033203243
7.16570 0.00000000
4. DMSCI_SUEDE -0.000656000 0.000349472
-1.87712 0.06183162
5. DTAUX_LONG_US 0.589860250 0.069629260
8.47144 0.00000000
statistique Q( 29 ) 63.45350 niveau de
significativité 0.0003
***** ETUDE DE LA COLINEARITE *****
VALS PROPRES DE XtX VALS SINGS DE X INDICES DE
CONDI
1.41399 1.18911
1.00000
1.18176 1.08709
1.09385
0.92768 0.96316
1.23459
0.87368 0.93471
1.27217
0.60290 0.77646
1.53145
TABLEAU DE DECOMPOSITION DE LA VARIANCE
***************************************
indice tableau de decomposition de la variance
cons DCPI DTAUX_DMSCI_DTAUX_LONG_US
1.0 0.263 0.271 0.049 0.003 0.030
1.1 0.007 0.000 0.146 0.365 0.298
1.2 0.112 0.000 0.687 0.234 0.001
1.3 0.002 0.126 0.108 0.238 0.615
1.5 0.616 0.603 0.009 0.159 0.057
| 
