|
_
Health Risk Assessment Associated with the Reuse of
Compost, Urine and Greywater in Agricultural Field in Sahelian
Climate
DISSERTATION FOR THE
MASTER OF ENGINEERING IN WATER
AND ENVIRONMENT
MAJOR:WATER AND SANITATION
------------------------------------------------------------------
Written and Defended on [June 24, 2014]
by
Alexis Loukou BROU
Under the Supervision of: Dr. Nowaki
HIJIKATA/Researcher/2iE Foundation
Dr. Mariam SOU/Lecturer/2iE Foundation
Mr. Seyram SOSSOU/Research Engineer/2iE
Foundation
Panel Members:
President: Pr. Rabah LAMAR
Members and correctors: Dr. MariamSOU
Dr. Lynda SAWADOGO
Dr. Nowaki HIJIKATA
Batch [2012/2014]
Dedication
For my Only Lord JESUS CHRIST
For my beloved wife Anne Aurélie N'Goné CISSE
In memory of my dear late father KOUAME Brou Paul and my dear
motherKOFFI Affoué who diedon August 15, 2012 before I started this
course
Acknowledgements
I would like to express our deep gratitude to the people whose
support, availability and advice contributed to the development of this
dissertation.
I am thankful for the scholarship that the government of the
Republic of Côte d'Ivoire granted me to enroll for the Master's
program.
I would like to thank all the supervising team for their
support, relevant criticism, remarks and suggestions in order to improve this
work particularly Dr. Mariam SOU, Dr. Nowaki HIJIKATA and Mr. Seyram SOSSOU.
I am thankful to Madam Aminata N'Diaye for her help to improve
quality of this dissertation.
I am grateful to the Laboratory assistants Mr. Noel
TINDOUREand Mr. Sohamaï HEMAfor their availability at the time of ours
analysis for this study.
I have appreciated the precious support I was provided with by
all the team of Ameli-EAUR project during the field study,and especially, that
ofMr.Innocent ZERBO, Mr. Koualè IDO and Mr. Bernard ZONGO.
Thank to my colleague trainees Yves Rodrigue KABORE; Danielle
Miranise OUEDRAOGO and Florence GAJU KAGABIGA for their support and their team
spirit
I would like to praise the support and advice I have had from
my great brothers Pierre BROU and Toussaint BROU and I thank all my relatives
for their prayers
Thank to my brothers and friends Richard EBA, Yves Oscar
BROUand Jean-Michel KOFFI for their support and advice.
My bath of master (2012-2014) for happy and difficult moments
which were overcome.
Finally, I highly-appreciate the support provided by all those
people that have contributed to the development of this dissertation and which
have not been listed.
Abstract
The aim of this study is to assess the health risks associated
with the reuse of human excreta (compost and urine) and greywater in the
agricultural field. It will firstly have to assess the health risk from farmers
associated with the reuse of human excreta and greywater in agriculture field;
and secondary to assess the health risk from consumers associated with the
reuse of human excreta and greywater in agriculture field. To achieve these
objectives, some hypotheses were considered as for the different exposed
groups. For farmers, we assume that they handle compost and urine in fields,
and they irrigate crops with greywater without adequate equipment protection
(gloves, clothing and shoes). For consumers, we assume that they eat lettuce
without washing it thoroughly. Different onsite experimentations havebeen
carried out. It is about combiningCompost and Top Water (C+TW), Urine and Top
Water (U+TW), Compost, Urine and Greywater (C+U+GW) and Non fertilizer (NoF)
which is used as a like controlling tool. An initial number of indicators and
pathogens cited above were determined in irrigation greywater, compost and
urine before applicationin the field. Microbiological quality of soil in
different combinations was monitored weekly from E.coli, Faecal
coliform, Faecal Enterococci, and Salmonella, and helminthes
eggs over two months. Quantitative microbial risk assessment was subsequently
evaluated for Salmonella and Ascarison these
combinations.Results vary from different treatments: For C+TW treatment, there
areannual risks of Salmonella infection in scenarios where it is
assumed that farmersmay ingest accidentally 10 to 100 mg of soil which
is3.87x10-3 pppy. Concerning Ascaris infection, annual risk
is4.67x10-2. From lettuce consumption, Salmonella annual
risk infection is 1.54x10⁻¹. For U+TW treatment, Salmonella
annual risk infection in scenario where it is assumed that farmers can ingest
accidentally soil spread with urine is 9.55x10⁻¹. For lettuce
consumption, annual risk is 1.30x10⁻⁷. From GW treatment,
Salmonella annual risk infection in scenario which assumes that
farmers ingest accidentally 10 to 100 mg of soil irrigated with greywater is
8.89x10⁻⁶. From ingestion of irrigation greywater, annual risk
infection is 1.02x10⁻⁴. Concerning lettuce consumption,
Salmonella risk infection is 9.42x10⁻⁴.
From C+U+GW treatment, in case of soil ingestion,
Salmonella annual risk infection is 1.44x10⁻⁴. For Ascaris
infection, risk is 4.67x10⁻². From ingestion of irrigation
greywater, Salmonella annual risk infection is 1.53x10⁻³.
For Ascaris infection, risk is 3.97x10⁻¹. From lettuce
consumption, Salmonella annual risk infection is 5.00x10⁻⁷.
For Ascaris infection, risk is 2.41x10⁻².
Keywords: Health Risk Assessment, Compost,
Urine, Greywater, Quantitative Microbial Risk Analysis, Ascaris,
Salmonella, Reuse and Agriculture.
Résumé
L'objectif de cette étude était
d'évaluer les risques sanitaires liés à l'utilisation
combinée du compost, de l'urine et des eaux grises en agriculture. Il
s'agissait de façon spécifique d'évaluer dans un premier
temps les risques sanitaires au niveau des agriculteurs et dans un second
temps d'évaluer les risques sanitaires au niveau des consommateurs. Pour
atteindre ces objectifs, des scénarios ont été
considérés au niveau des différents groupes d'exposition.
Ainsi, au niveau des agriculteurs, avons-nous supposé qu'ils manipulent
le compost et l'urine dans leurs champs, et qu'ils irriguent les cultures avec
les eaux grises sans aucun équipement de protection approprié
(gants, habillement et chaussures). Concernant les consommateurs, nous avons
supposé qu'ils mangent de la laitue sans la laver correctement.
Différentes expérimentations sur site ont été
effectuées. A savoir la combinaison du compost et de l'eau de robinet
(C+TW), de l'urine et de l'eau de robinet (U+TW), du compost, de l'urine et des
eaux grises (C+U+GW) et un témoin arrosé seulement avec l'eau de
robinet (NoF). La charge initiale d'organismes indicateurs et
pathogènes (Coliformes fécaux, E.coli,
Entérocoques, Salmonelles et les oeufs
d'Ascaris) a été déterminée dans, le
compost, l'urine et les eaux grises avant leur application. La qualité
microbiologique du sol au niveau des différentes combinaisons de
traitement a été suivie une fois par semaine pour des
paramètres tels que les E.coli, coliformes fécaux,
entérocoques fécaux, Salmonelles, et oeufs
d'Ascaris pendant deux mois. L'évaluation quantitative
microbienne des risques a été effectuée en utilisant la
méthode de simulation de Monte Carlo pour les salmonelles
(10000 itérations)et l'ascaris (1000
itérations)pour chaque combinaison. Les résultats ainsi obtenus,
varient selon le type de traitements: Au niveau de C+TW, le risque d'infection
aux Salmonelles est le plus important (1.54x10⁻¹), dans le
cadre de la consommation de la laitue. Au niveau du traitement U+TW, le risque
annuel d'infection le plus important se trouve au niveau des salmonelles
9.55x10⁻¹dans le scénario selon lequel les agriculteurs
peuvent ingérer accidentellement 10 à 100 mg de sol
fertilisé avec l'urine. Concernant la matrice eaux grises (GW), le
risque annuel d'infectionauxsalmonelles
(1.02x10⁻⁴), le plus important se rencontre dans le
scénario selon lequel, les fermiers ingèrent accidentellement 1
à 2 mL d'eaux grises lors de l'arrosage de leurs cultures. Pour la
matrice compost, urine et eaux grises (C+U+GW), concernant, l'ingestion de
sol,lesAscaris présentent le risque annuel d'infection le plus
important 4.67x10⁻². Quant à l'ingestion des eaux grises
lors de l'irrigation, le risque annuel d'infectionaux salmonelles est
de 1.53x10⁻³. Pour l'infection à l'Ascaris, le
risque est de 3.62x10⁻¹. Concernant la consommation de laitue, il
ressort que les Ascaris présentent le risque d'infection le
plus important soit 2.41x10⁻².
Mots-clés : Evaluation des
risques sanitaires, Analyse Quantitative des Risques Microbiens, Compost,
Urine, Eaux grises, Réutilisation, et Agriculture.
Abbreviations
Ameli-EAUR Amélioration de l'accès
à l'Eau potable et à l'Assainissement en milieu Urbain et
Rural
C+TW Compost and Top Water
C+U+GW Compost, Urine and Greywater
DALY Disability Adjusted Life Years
DW Dry weight
EPA Environment Protection Agency
FAO Food and Agriculture Organization of
United Nations
FW Fresh weight
GW Greywater
JICA Japanese International Cooperation
Agency
NoF Non Fertilizer
Pinf Probability of infection
PPPY Per Person Per Year
Pyr Annual Probability risk infection
QMRA Quantitative Microbial Risks Analysis
UNICEF United Nations Organization for Child
and Education Found
U+TW Urine and Top Water
W/V Weight/Volume
List of tables
Table 1: Different routes of exposure of farmers by
irrigation with greywater
2
Table 2: Different parameters which are analyzed in
the matrix
15
Table 3: Different exposure scenarios and pathways
which farmers and consumers can be exposed in different cases
21
Table 4: Summary of dose-response parameters for
exponential and beta-Poisson models from various enteric pathogen ingestion
studies
23
Table 5: Annual probabilities of
Salmonella and Ascaris infection associated with the
ingestion of soil combined with compost and consumption of lettuce
25
Table 6: Annual probabilities of
Salmonella infection associated with the ingestion of soil combined
with urine and consumption of lettuce
26
Table 7: Annual probabilities of
Salmonella infection associated with the soil and greywater ingestion
combined with greywater and lettuce consumption
27
Table 8: Annual probabilities of Salmonella
and Ascaris infection associated with the soil and greywater
ingestion combined with compost, urine and greywater and lettuce
consumption
28
Table 9 : Probabilistic values of different
treatments compared with the WHO guideline values of the risk.
29
Table 10: Probabilistic values of Greywater and
Compost, Urine and Greywater treatments compared with the WHO guideline values
of the risk.
30
Table 11: Probabilistic values of different
treatments compared with the WHO guideline values of the risk.
31
List of figures
Figure 1: Experimental site of Kamboinsé
(source Google earth)
2
Figure
2: Experimental design in the site
14
Figure
3: Illustration of step of Salmonella analysis
18
Figure
4: Steps of calculation of Monte Carlo Method
23
Figure 5: Annual infection risks of
Salmonella and Ascaris in function of scenarios compared with
WHO guideline value.
25
Figure 6 : Annual infection risks of
Salmonella in function of scenarios compared with WHO guideline
value.
26
Figure 7 : Annual infection risks of
Salmonella in function of scenarios compared with WHO guideline value.
27
Figure 8: Annual infection risks of
Salmonella and Ascaris in function of scenarios compared with
WHO guideline value.
28
Figure 9 : Probabilistic values of all
treatments compared with the WHO guideline values of risk for soil ingestion
scenario
29
Figure 10 : Probabilistic values of Greywater
and Compost, Urine and Greywater treatments compared with the WHO guideline
values
30
Figure 11: Probabilistic values of all treatments
compared with the WHO guideline values of risk for lettuce consumption
scenario
31
Table of contains
Dedication
i
Acknowledgements
ii
Abstract
iii
Résumé
iv
Abbreviations
vi
List of tables
vii
List of figures
viii
I. Introduction
1
II. LITERATURE REVIEW
3
1. Generalities on health risk assessment
4
1.1. Health risk assessment
4
1.2. Steps of health risk assessment
5
1.3. Microbial risk assessment
6
2. Health risk assessment for farmers
6
2.1. Spreading compost
6
2.2. Spreading urine
7
2.3. Watering greywater
8
3. Health risk assessment for consumers
10
III. MATERIAL AND METHODS
12
1. Experimental site
13
2. Sampling and data collection
15
2.1. Initial statement of the experimental site
15
2.2. Microbiological analysis of matrix (soil,
compost, urine, and greywater)
15
2.3. Following up indicators of pathogen on lettuce
leave
19
3. Quantitative Microbial Risk Analysis (QMRA)
methods
19
3.1. Hazard identification
19
3.2. Exposure assessment
19
3.3. Dose-response assessment
21
3.4. Risk characterization
23
IV. RESULTS AND DISCUSSION
24
1. Results
25
1.1. Quantitative Microbial Risk Assessment from
different treatments
25
1.2. Comparison of the probabilistic values of
different treatments related with the scenarios
29
2. Discussion
32
2.1. Quantitative Microbial Risk Assessment from
each treatment.
32
2.2. Comparison of the probabilistic values of
different treatments related with the scenarios
35
IV. Conclusion and perspectives
38
V. References
39
Annex
i
Introduction
Burkina Faso, like many countries, is confronted withvarious
issues among which food insecurity. In order to address this situation, the
level of fertility of the soils has been decreasing; the price of chemical
fertilizers is increasing on the marketas well as the weakness of the
pluviometry. Furthermore, the water resources are insufficient, because 44,15%
of rural population have not access of best water quality (DGRE, 2010).In
addition, there is theissue of an appropriate sanitation. According to WHO and
UNICEF, (2007) Joint Monitoring Program, access to improved sanitation in
Burkina Faso was about 17% on national scale (47% urban and 4% rural) in 2007.
The lower sanitation distribution is increasing the diseases from population
which constitutes a public health issue in Burkina Faso. Therefore, improvement
of the agriculture and sanitation is urgent task in the country.Faeces and
urine, as well as mixed sewage products, need to be seen as resources rather
than waste the resource oriented sanitation for sanitation or composting toilet
is an advantage for agriculture. In addition human excreta have traditionally
been used for crop fertilization in many countries. In Japan recycling of urine
and faeces was introduced in the 12th Century and in China human and
animal excreta have been composted for thousands of years (Höglund, 2001).
In human excreta, urine contains the major part of essential plant nutrients
(nitrogen, phosphorus and potassium). Concerning Faeces, apart from nutrients,
can contribute humus-like substances, thus improving soil fertilizer
(Schönning et al., 2007). In this case, thereuse of human excreta without
previous relevanttreatment in agriculture triggers a problem of public health
and remains health risk for farmers and consumers.Greywater reuse can alleviate
stress on depleted water resources while reducing water cost for residents
(Maimon et al., 2010). The reuse of greywater, however also can compromise
human and environmental health. Pathogens in greywater may cause diseases
through direct contact as well as through the consumption of contaminated
plants (Shuval et al., 1997 and Mara et al., 2007a).
However, hazards associated with the recycling of these
products include pathogens and pharmaceuticals as well as other micropollutants
and heavy metals (Höglund et al., 1998 and Schönning et al.,
2007).Thus, consumers can be exposedto diseases, when consuming the
contaminated products related to greywater and human excreta reuse in
agriculture especially if these products are not appropriately treated before
being used in agriculture (FAO and WHO, 2008). Therefore, in order to minimize
contamination of farmers and consumers due to the reuse of human excreta and
greywater in agriculture field, several studies were conducted on health risk
assessment related to urine, compost or greywater in agriculture field in the
world (Höglund et al., 2002; -Al-Hamaiedeh, 2010; Fidjeland, 2010 ;Gemmell
and Schmidt, 2011; and Nana O.B. Ackerson and Esi Awuah, 2012).
However, in Burkina Faso these kinds of study have not been
conducted yet according to our investigations, when we know that the majorityof
urban farming populations use wastewater to irrigate their crops which is not
necessarily treated before use to irrigate crops.In this context, the Japanese
International Corporation Agency (JICA) through the Ameli-EAUR project which
promotes the valorization of human excreta and greywater in family farming in
order to improve sustainable sanitation for rural populations tried to study
the health risk assessment related to the reuse of human excreta and greywater
in agriculture. It is in this context that a topic was suggestedto us within
the framework of our master's thesis. The topic is entitled «health risk
assessment associated with the reuse of compost, urine and greywater in
agricultural field in sahelian climate». The aim of this study isto assess
the health risks associated with the reuse of human excreta and greywater in
the agricultural field. It will, in a specific way, firstly, assess the health
risk forfarmers thatreuse human excreta and greywater in agriculture field; and
secondly assess the health risk for consumers of goods relating to the reuse of
human excreta and greywater in agriculture field.To meet these objectives, this
present dissertation includes the following parts: the state of the art on the
generality on health risk assessment which include the risk for farmers and
consumers, the material and methods which are used to do this study, then the
results and discussion issue following the different activities and
experimentations, and finally the conclusion and perspectives of this study.
II. LITERATURE REVIEW
1. Generalities on health risk
assessment
1.1. Health risk assessment
According to WHO, 2006a, the risk is the probability that
something with a negative impact may occur. The agent that causes the adverse
effect is a hazard. Risk incorporates the probability that an event will occur
with the effect that it will have on a population or the environment,
considering the sociopolitical context where it takes place (WHO, 2006a). The
WHO guideline for the safe use of wastewater, excreta and greywater (WHO,
2006a) gives recommendations on treatment and management in order to avoid
unacceptable health risk. It is based on the Stockholm framework, which is a
harmonized approach to control water-related diseases (Fidjeland, 2010).
Different exposures and diseases are compared through the Disability Adjusted
Life Years (DALY) unit, which is a measure of the years lost due to premature
death, diseases and chronic effects. The DALY unit enables cross-sectional
cost-efficiency comparison of health initiatives (WHO, 2006a); (Fidjeland,
2010). The tolerable risk which is recommended by World Health Organization is
10-6 DALY (WHO, 2006a).
Many authors have characterized the risk analysis in three
principal steps: risk assessment, risk management and risk communication(WHO,
1999);(Westrell, 2004); (Metcalf & Eddy, 2007);(Fidjeland, 2010).
According to the National Research Council of USA, risk
assessment can be defined broadly as the process of the probability of
occurrence of an event and the probable magnitude of adverse effects on safety,
health, ecology, finances over a specified time period (Metcalf & Eddy,
2007). In other words, the risk assessment is defined as the qualitative or
quantitative characterization and estimation of potential adverse health
effects associated with exposure of individuals or populations to hazards (here
microbial agents) (Westrell, 2004); (Fidjeland, 2010). Risk assessment also
includes characterization of the uncertainties inherent in the process of
inferring risk.
Risk management is the process of evaluating and, if
necessary, controlling sources of exposure and risk. Sound environmental risk
management means weighing many different attributes of a decision and
developing alternatives (Metcalf & Eddy, 2007). Risk management is
anactivity much broader than technical risk analysis alone (McDowell and Lemer,
1991).
It is the interactive exchange of information and opinions
concerning risk and risk management among risk assessors, risk managers,
consumers, and other interested parties about the nature, magnitude,
significance, or control of a risk (Metcalf & Eddy, 2007).It concerns the
health risk assessment component, is the quantitative or qualitative
characterization and estimation of potential adverse health effects associated
with exposure of individuals or populations to hazardous materials and
situations (Metcalf & Eddy, 2007). Therefore, health risk assessment can be
divided into four major steps including: hazard identification,
dose-responseassessment, exposure assessment, and risk characterization (WHO,
1999).Health risk assessment includes chemical and microbial risk assessment
(Metcalf & Eddy, 2007), and in our case of study we will focus on
microbial risk assessment.
1.2. Steps of health risk
assessment
Many authors have localized the health risk assessment in four
steps which are mentioned below (Haas et al., 1999); (WHO, 1999);(Metcalf &
Eddy, 2007):
Hazard identification, defined as the process of determining
whether exposure to an agent can cause an increase in the incidence of a health
condition, is the most easily recognized in the actions of regulatory agencies
(Metcalf & Eddy, 2007). Also the identification of microbiology agent
capable of causing adverse health effects and which may be present in a food or
group of foods(WHO, 1999).
Dose-responsemay be defined as the determination of the
relationship between the magnitude of exposure (dose) to a chemical,
biological or physical agent and the severity and/or frequency of associated
adverse health effects (response)(WHO, 1999).The dose-response assessment is
the process of characterizing the relationship between the dose of an agent
administered or received and the incidence of an adverse health effect in
exposed populationsand then estimating the incidence of the effect as a
function of human exposure to the agent(Metcalf & Eddy, 2007).
Exposure assessment is the process of measuring or estimating
the intensity, frequency, and duration of human exposures to an agent currently
present in the environment. For microbial risk assessment, exposure assessment
describes the magnitude and/or probability of actual or anticipated human
exposure to pathogenic microorganisms or microbiological toxins(Haas et al.,
1999); (Metcalf & Eddy, 2007);(Fidjeland, 2010).
Risk characterization is the process of estimating the
incidence of a health effect under various conditions of the human exposure
described in exposure assessment. In addition, risk characterization may
require compiling all the data necessary for a given model and running
simulations (Haas et al., 1999); (WHO, 1999) and (Metcalf & Eddy, 2007).
1.3. Microbial risk
assessment
Haas et al., (1999) were defined microbial risk assessment
(MRA) as the process that is used to evaluate the likelihood of adverse human
health effects that can occur following exposure to pathogenic microorganisms
or to a medium in which pathogens occur.Other authors as WHO, (1999),Metcalf
& Eddy, (2007) andFidjeland, (2010)explained the microbial or
microbiological risk assessment process includes evaluation and consideration
of quantitative information; however, qualitative information is also employed
as appropriate. In other words, the microbial risk assessment should explicitly
consider the dynamics of microbiological growth, survival, and death in
foods and the complexity of the interaction between human and agent
following consumption as well as the potential for further spread (WHO, 1999).
Quantitative Microbial Risk Assessment (QMRA) is a tool used
to predict the consequences of potential or actual exposure to infectious
microorganisms(Haas et al., 1999). The methodology is based on the chemical
risk assessment concept for which the National Academy of Sciences published
recommended definitions and main principles (Höglund, 2001).QMRA thus
starts by a problem formulation where all the transmission routes and pathogens
of interest are identified. It then assesses the dose of a certain pathogen to
which an individual may be exposed and uses this dose in a dose-response model
to calculate the probability of infection. Risks are finally characterized by
taking into consideration the frequency of the exposure events for the range
ofpathogens studied, to estimate a total risk (Haas et al.,
1999);(Höglund, 2001).
2. Health risk assessment for
farmers
Health risk can be localized in the different activities in
the field when, the farm workers use compost, urine and greywater to amend the
soil and the crops.
2.1. Spreading compost
When using fertilizer products containing human or animal
excreta, the reduction of excreted pathogens is a critical step in minimizing
the risk of further spreading of pathogens.Transmission of disease may occur if
humans or animals come in contact with the excreta and accidentally ingest the
pathogen-containing material before the pathogens have been inactivated
(Schönning et al., 2007).According to WHO, (2006a) the variations in the
risk for infection depend on the organism in question. Some Salmonella are able
to regrow in stored but unstabilized materials, especially if the materials are
partly moist. Viruses and parasites generally have longer survival in the
environment as well as lower infectious doses, which resulted in high risks for
rotavirus, the protozoa and Ascaris.For WHO, (2006a), in considering
two mean scenarios which are unconditional (applying the incidence in the
population) and conditional (assuming that one member of the family actually
had an infection during period of collection). Thus in this situation, the
difference in risk between the conditional and unconditional scenario was 1-4
orders of magnitude, and the difference between typical (50%) and worst case
(95%) varied from none to five orders of magnitude, depending on the organism.
For the unconditional scenario, the risk was never higher than
4x10⁻² (rotavirus). Only after 12 months of storage and taking
incidence into consideration were the risks <10-4 for all
organisms, excluding Ascaris (Pinf = 8 x 10⁻⁴),
when emptying the container and applying the material(WHO, 2006a);
(Schönning et al., 2007).For -Carr, (2005), agricultural field workers are
at high risk of parasitic infections because of the long survival of the
protozoa and Ascaris in the compost because WHO guidelines recommend
to reduce the helminth eggs in compost to = 1 egg/L (WHO, 2006a). But
exposure to hookworm infection can be reduced, even eliminated, by the use of
less contaminating irrigation methods and by the use of appropriate protective
clothing (i.e. shoes for field workers and gloves for crop handlers).
2.2. Spreading urine
For the hygienic risks related to the handling and reuse of
urine, temperature, dilution, pH ammonia and time are the mean determinants
affecting the persistence of organisms in collected urine (WHO, 2006a). Urine
contains the majority of plant macronutrients that originate from household
wastewater (Swedish EPA, 2007). Furthermore, the potential pathogen content is
low, especially compared to faeces. Therefore, separate collection of urine for
later use as a fertilizer in agriculture has been promoted through the use of
urine separating toilets and latrines (Höglund et al., 2002).The short
survival of E. coli in urine makes it unsuitable as a general
indicator for faecal contamination by, for example, viruses and protozoa(WHO,
2006a).According to WHO(2006a), the Gram-positive faecal streptococci has a
longer survival process (normally a T90 value of 4-7 days at
20°C, but up to 30 days at 4°C), and spore-forming clostridia are
not reduced at all during a period of 80 days. In general, lower temperature
and higher dilution result in longer survival of most bacteria (Höglund et
al., 1998; WHO, 2006). However, the urine is generally contaminated at the time
of the micturition by germs coming from faeces, which increases the load of
pathogenic and constitutes a health risk (Tagro, 2012). According to WHO
(2006a), the pathogenic germs of bacterial, viral or parasitic origin are
responsible for several diseases such as diarrhea, cholera, typhoid fever,
salmonellosis, shigelloses, amoebiasis, bacterial dysentery, amoebic
dysentery, and parasitism. But, urinary excretion of pathogens that can be
transmitted through the environment are uncommon (Höglund et al., 2002).
The use of non-treated urines as fertilizer in agriculture can contribute to
the transmission of these diseases to the directly exposed field workers
(Tagro, 2012). However if the farm workers are used the protective equipment
before spreading of urine in the field, the risk of infection can be
reduced(WHO, 2006a). Furthermore, Höglund et al., 1998 suggest that
estimate the risk of pathogen transmission for handling, transportation and
reuse of source separated urine that follow it is necessary to determine the
exact amount of faecal material introduced in the urine fraction.
Therefore, the estimated risks of pathogens for different
pathways were calculated by Höglund et al., 2002 for three indicator
pathogens (C. jejuni, C. parvum and rotavirus). It arises that in the
case of an epidemic, where no inactivation and accidental ingestion of 1 mL of
unstored urine was assumed to occur in the collection tank and spreading in the
field, viruses may pose an unacceptably high risk, and bacteria pose a greater
risk than protozoa. The annual risk of viral infection at 4°C is 0.81,
since very low inactivation of rotavirus occurs at this temperature and
slightly lower at 20°C (Pinf = 0.55) (WHO, 2006a). The risk
from exposure to aerosols when farm workers spread urine in the field depend,
according to Höglund et al., 2002 and WHO, 2006 of the technique of
spreading of the urine.
2.3. Watering greywater
Greywater is wastewater generated from domestic activities
such as laundry, dishwashing and bathing that can be recycled on-site for reuse
in landscape irrigation and constructed wetlands -(Zuma and Tandlich, 2010).
Greywater is thus domestic wastewater, without any input from toilet, which
carries finite concentrations microorganisms such as faecal coliforms,
E.coli and opportunistic pathogens (WHO, 2006a) and -(Zuma and
Tandlich, 2010).In greywater system, microbial hazards emanate mainly from
faecal cross-contamination (e.g. from anal cleansing, hygienic practices,
contaminated laundry and other sources) (WHO, 2006a). Thus, farm workers and
their families are at the highest risk when flood or furrow irrigation
techniques are used, particularly when protective clothing is not worn and
earth is moved by hand -(Carr, 2005).Farmers can be exposed by different
pathways when they irrigate the field with greywater according to Maimon et
al., 2010as shown inthe exposure scenario in the table 1.
Table 1: Different routes of
exposure of farmers by irrigation with greywater
|
Exposure type
|
Exposure scenario
|
|
Direct
|
Accidental ingestion of greywater
Ingestion of greywater from the irrigation system
Ingestion of soil contaminated with greywater
Inhalation of aerosols from spray irrigation system
|
Therefore, greywater is comprised of very diverse components,
making the drafting creation of comprehension risk assessment, guidelines, and
regulations a hard task (Maimon et al., 2010). Furthermore, according to same
author, determining an acceptable risk for water reuse schemes will vary from
place to place according to the severity of local water stress and the level
of background risks as well as the existing `'governance'' in the water sphere
and regulatory capacity (Maimon et al., 2010).Greywater used for irrigation
may, depending on distribution practices, expose people via inhalation of
aerosols as well as through consumption of irrigated contaminated crops, in a
similar pathway as for wastewater (WHO, 2006b).
The faecal load in the greywater in the system was assessed on
the basis of a range of microbial indicators (E.coli, enterococci,
sulfite-reducing clostridia,coliphage) and chemical markers (faecal sterols)
(WHO, 2006a).Furthermore the pathogen-related risks of greywater depend on the
faecal load or faecal misplacement.According to WHO, 2006a, in all exposure
scenarios, rotavirus posed the highest risk, partly due to its excretion in
higher numbers, at least during the acute phase, compared to the other
pathogens included in the study.Thus, different studies have tried to correlate
the rotavirus load with faecal indicators such as E.coli (Maimon et
al., 2010). The WHO guidelines suggest that there are between 0.1 to 1
rotavirus for every 105E.coli in 100 mL of domestic
wastewater (WHO, 2006a) and (Mara et al., 2007a).Thus, the tolerable disease
risks for these organisms (rotavirus, Campylobacter and
Cryptosporidium)are in the range 10-3- 10-4 per
person per year (pppy) according to WHO, 2006a.
Reliable epidemiological data relating to the safe use of
greywater in agriculture are scarce. As an alternative, the range of tolerable
disease risk can be deduced on the QMRA, for which the risks resulting from
exposure to greywater, for both its final use and handling (WHO,
2006a).Furthermore, Ottosson & Strenström in 2003, suggested that
guidelines for the safe use of greywater in agriculture should not be based on
thermotolerant coliforms as a hygienic parameter, because of the large input of
non-faecal coliforms and/or growth of coliforms, unless their concentrations
are adjusted for false-positive levels (Ottosson & Strenström, 2003a
in (WHO, 2006a)).Thus, the overestimation of the faecal load, and risk,
resulting from these indicator bacteria is to some degree compensated for by
the higher susceptibility to treatment and environmental die-off (WHO, 2006a
and Mara et al., 2007).In greywater, a regrowth of E. coli sometimes
occurs, which may lead to an overestimation of the risks if verification
monitoring is based on this parameter. It is suggested that E. coli
guideline values, which are applicable for wastewater use, be applied
cautiously for greywater. If applied, they will give a level of additional
safety in this application, since the faecal load is usually 100-1000 times
less than wastewater (WHO, 2006a). Thus, a guideline value of
<103E. coli per 100 mL is suggested for unrestricted
irrigation with greywater by (WHO, 2006a).
3. Health risk assessment
forconsumers
In developing countries, foodborne illnesses caused by
contaminated fruits and vegetables are frequent and in some areas they cause a
large proportion of illness. However, due to lack of foodborne disease
investigation and surveillance inmost of these countries, most outbreaks go
undetected and the scientific literature reports only onvery few outbreaks(WHO,
1998). Thus, reuse of human excreta and greywater in agriculture can cause
diseases for consumers especially when theyeat those crops without cooking. In
addition, human waste may be a source of direct contamination if deposited in
farms. Alternatively, environmental contamination with pathogens from these
sources may be transferred indirectly to products via contaminated water,
insects, agents such as dust, tools and equipment (FAO and WHO, 2008).According
to FAO and WHO, 2008 fruits and vegetables can become contaminated with
microorganisms capable of causing human diseases while still on plant in fields
or orchards, or during harvesting, transport, processing distribution and
marketing, or in the house. Also, Bacteria such as Clostridium
botulinum, Bacillus cereus and Listeria monocytogenes,
all capable of causing illness, are normal inhabitants of many soils, whereas
Salmonella, Shigella, Escherichia coliand Campylobacter
reside in the intestinal tracts of animals, including humans, and are more
likely to contaminate fruits and vegetables through contact with faeces,
sewage, untreated irrigation water or surface water (WHO, 2006a);(FAO and WHO,
2008); and ----(Mara and Sleigh, 2010a). Generally, people irrigating with
wastewater have higher rates of helminth infections than those using
freshwater. In addition, skin and nail problems may occur among farmers using
wastewater -(Al-Hamaiedeh, 2010). There is substantial evidence that human
enteric pathogens which are frequently present in greywater are responsible for
low-level incidence of chronic gastroenteritis (upset stomach, vomiting, and
diarrhea) as well as other «mild illness in people»-(Al-Hamaiedeh,
2010).
To assess potential risks associated with the use of reclaimed
wastewater, the following exposure scenario is developed by -Asano et al., 1992
for spray irrigation of food crops. The following scenario is used to estimate
the risk of infection to an individual for a single or an annual or a lifetime
exposure. In this case, -Asano et al., 1992 are assumed to 10 mL reclaimed
wastewater can be left on the crops eaten raw. However, irrigation with
reclaimed wastewater is assumed to stop two weeks before harvesting. Thus,
virus die-off due to desiccation and sunlight for 14 days is included in the
calculation. Shuval et al., 1997 are corroborated the developed approach by
-Asano et al., 1992where they werecollected for 100g of long leaf lettuce, 10.8
mL for 12 days before harvesting.Based on these measurements it is possible to
estimate the amount of indicator organisms that might remain on the vegetables
if irrigated with raw wastewater and with wastewater meeting the WHO
guidelines.
In 1989, to mitigate the risks of contamination, in terms of
epidemiological and technological data available, the WHO «Health
Guidelines for the Use of Wastewater in Agriculture and Aquaculture»,
recommended the microbial guidelines for wastewater irrigation of vegetables
eaten raw of a mean of 1000 faecal coliforms (FC)/100 mL and <1 helminth
egg/L in effluent (Shuval et al., 1997).Thus, a study was carried out in Ghana
by Nana O.B. Ackerson and Esi Awuah, (2012), and which showed that, the annual
probabilities of Ascaris and E. coli infection associated
with the consumption of lettuce where farmers used the shallow well and stream
to irrigate lettuce are higher (7.51x10⁻² for Ascaris and
3.63x10⁻¹ for E. coli) than the tolerable risk
(10-6 pppy) recommended by WHO, (2006a).However, cessation of
irrigation before harvest can be adopted to minimize the risk of infection in
lettuce consumption (Nana O.B. Ackerson and Esi Awuah, 2012).
III. MATERIAL AND METHODS
1. Experimental site
The experimental site of our study is localized on
Kamboinsé campus of the International Institute for Water and
Environmental Engineering (2iE) whose geographic details
are12°27'39.74»N and 1°32'54.78»W. This experiment is
carried out in the vicinity of the water purification plant on campus (Figure
1).
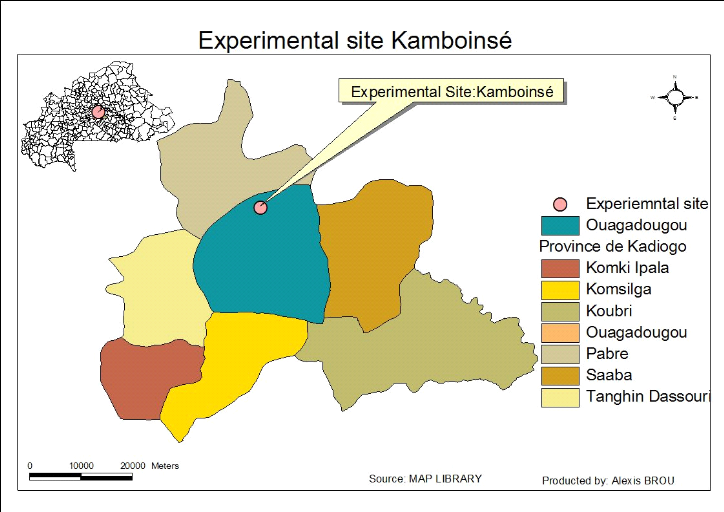
Figure 1: Experimental
site of Kamboinsé (source Google earth)
Kamboinsé village is located at approximately 9 kms in
the North of Ouagadougou on the road to Kongoussi. The population practice
Christianity mainly and has activities such as agriculture, breedingand
marketing of traditional drink «dolo».This locality is submitted to
thesoudano-sahelian climate with a long dry season and a short rain season. The
grounds, with the image of thesahelian grounds, are relatively low in organic
matter and in total elements (N, P, K), they are generally attached to the
classes of average fertility to weak(SOU, 2009). The study is carried out in
the experimental site of Ameli-EAUR project.The experimental design is carried
out on the lettuce crop which uses the combination of compost and top water
(C+TW), urine and top water (U+TW), compost, urine and greywater (C+U+GW),
greywater only (GW), and control with which we use only top water to irrigate
(NoF). There are 3 replications for each combination (Figure 2 below).The area
where the lettuce crop is grownis 1.56 m2 per plank.
The source of compost, urine and greywater which is used to
irrigate thelettuce crop is from the families' pilotof Ziniaré
especially from Barkuundouba and Kolongodjessé villages. Ziniaré
is located in the eastern section with about thirty kilometers far from
Ouagadougou, in the Oubritenga district. Barkuundouba is located at 17 kms of
Ziniaré. The populations includein the majority Peulh (Fulani people)
and practice Islam as the first religion and then Christianity. Breeding is the
principal economic activity of the populations. The second activity is
agriculture with rudimentary farmingtechniques. This activity is dominated by
cereal cultures like millet, sorghum and corn. This sector is also confronted
with the insufficiency of cultivable grounds, the irregularity of the rains and
decreasing soil fertility(Tagro, 2012).
Kolongodjessé, as forit, is located at 7 kms of the
city of Ziniaré on the axis Ouagadougou-Kaya. Its population has
respectively as first and second activities breeding and agriculture.They also
sell traditional drink called «dolo» and mainly include Mossiethnical
group. Contrary to Barkuundouba, the dominant religion with
Kolongodjessé is Christianity(NIKIEMA, 2012).
The gap between the lettuce plants on each plank varies from
10 to 15 centimeters. The choice of lettuce is justified by the roughness of
surface of the edible sheets and the foliated density of the culture. These
characteristics ensure for the micro-organisms a certain disinfecting ability
to through solar radiations. Hence this type of consumed vegetables is
believed to be a vector of pathogenic micro-organisms particularly dangerous
for the consumer (SOU, 2009).
U+ TW
NoF
C+U + GW
GW
C+ TW
0.5 m
1.3 m
GW
C +TW
C+U +GW
U+TW
NoF
1.2 m
C+U+ GW
U + TW
GW
NoF
C+ TW
Figure 2: Experimental
design in the site
2. Sampling and data
collection
2.1. Initial statement of the
experimental site
Before planting out the lettuce plants in the soil, the
samples of soil, compost, urine and greywater have been made to known the
initial concentration of the microbiological parameters.The parameters or
indicators which are analyzed in the different matrix are contained in the
table 1.And then, samples of soils are taken for each treatment per week to
analyze these parameters in table 1 below.Therefore, samplings were carried out
from 10 April to 26 May 2014.
Table 2: Different parameters
which are analyzed in the matrix
|
Matrix
|
Indicators/pathogens
|
|
Soil
|
E. coli/Faecal coliform, Salmonella, Helminthes eggs,
Faecal enterococci
|
|
Compost
|
Helminthes eggs, E.coli/Faecalcoliform, Salmonella
|
|
Urine
|
Faecal coliform, Faecal enterococci, Salmonella
|
|
Greywater
|
E. coli/ Faecal coliform, Salmonella, Faecal
enterococci
|
For all these parameters the microbiological analysis will be
used.
2.2. Microbiological analysis
of matrix (soil, compost, urine, and greywater)
2.2.1. Enumeration of bacteria in soil and compost
Compost or soil samples 25 g (w/v) were homogenized in 225 mL
of buffer phosphate water and a 10-fold dilution series was performed in
maximum recovery diluents (ringer solution). Fecal coliforms and E.
coli and Enterococci were cultured following a method 9215 A in
Standard Methods for the Examination of Water and Wastewater (APHA, 1998).
Relevant dilutions were spread on plates in duplicate on the following
selective media; chromo cult coliform agar ES (Difco, France) incubated at
44,5°C and for 24 h for Fecal Coliforms,E. coli, and
Salmonella, Slanetz Bartley agar at 37°C for 48 h for
Enterococci. The bacteria load is expressed in (log10
UFC/g-DW soil or compost) through the equation 1:
  (Equation 1) (Equation 1)
Where:
N = Bacteria load in compost or soil (Log10UFC/g-
DW- soil or compost);
n = Number of colonies in box of Petri;
P = Weight of compost or soil samples (25g);
Vl = Volume of Buffer phosphate used to
homogenization of compost or soil samples;
V = Volume of test (1 mL);
d = factor of dilution.
DW= Dry weight is expressed by this equation below:
  (Equation 2) (Equation 2)
Where:
M1= 10g fresh weight + empty weight oftube,
M2= 10g-dry weigth+ empty weight of tube,
M0= empty weight of tube.
2.2.2. Enumeration of bacteria in urine
The description of E.coli and Faecal Coliform(FC) or
Enterococci was done by the method of culture of spreading out in
depth.The samples were diluted with sterile ringer. After dilution, 1 mL of the
diluted sample was spread out over media (Chromocult Agar for E.
coli/Faecal coliform and Slanetz Bartley for Enterococci), contained in
box of Petri which were then carried to the drying oven for incubation with 44
°C during 24h for E. coli/Faecal coliform and with 37 °C
during 48 h for Faecal Enterococci. E coliwere identified by blue
colorantpurple and Faecal Enterococci by whitish. The colonies obtained were
counted thereafter and numbers obtained was allotted to the number of E coli or
enterococci present in the sample. This is why the concentration is expressed
in unit forming colony (UFC) reported to 100 mL of sample. Bacteria load is
expressed by equation (2):
  (Equation 3) (Equation 3)
Where:
N = Concentration of bacteria in urine (UFC/100
mL);
n = Number of colonies in box of Petri;
Vs = Reference volume (100 mL);
V = Volume of test (1 mL);
d = dilution factor.
2.2.3. Enumeration of bacteria in greywater
The description of E. coli and Faecal coliform (FC)
or Enterococci was done by the method of culture of spreading out in
surface.The samples were diluted with sterile ringer. After dilution, 0.1 mL of
the diluted sample was spread out over media (Chromo cult Agar for E.
coli/Faecal coliform and Slanetz Bartley for Enterococci), contained in
box of Petri which were then carried to the drying oven for incubation with 44
°C during 24h for E. coli/Faecal coliform and with 37 °C
during 48 h for Faecal Enterococci. E coli were identified by blue
color and purple and Faecal Enterococci by whitish. The colonies obtained were
counted thereafter and numbers obtained was allotted to the number of E
coli or enterococci present in the sample. This is why the concentration
is expressed in unit forming colony (UFC) reported to 100 mL of sample.
Bacteria load is determined by equation 2 above in similar conditions.
2.2.4. Enumeration of Salmonella
- Compost and soil
Compost or soil samples 25 g (w/v) were homogenized in 225 mL
of buffer phosphate water and a 10-fold dilution series was performed in
maximum recovery diluents (ringer solution). 10 mL of Rappaport Vassiliadis
media were added in test tubes of different dilutions (100 to
10-6) where three to five repetitions are made per dilution and 1 mL
of sample is added in the test tubes. It is illustrated by figure 3below.Then,
test tubes are introduced in incubator during 24h at 37°C for testing
process before sowing in ChromAgar media on Petri box and then incubating at
37°C during 24h to confirm the result of first observation. Final result
is obtained by the tables of Mac Grady
(annex i)where it is expressed in Most Numbers
Probable per gramme (MNP/g).
- Urine and greywater
Process is similar as compost and soil analysis (figure 3).
However, dilution is made directly without homogenization with buffer phosphate
water. Final result is expressed in Most Numbers Probable per liter (MNP/L).
10 mL Rappaport solution + 1 mL sample (soil or compost)
T3
T3
T3
T3
T3
T2
T2
T2
T2
T2
T1
T1
T1
T1
T1
Figure 3: Illustration of
step of Salmonella analysis
100 10-1
10-2 10-3
10-4
2.2.5. Enumeration of helminth eggs in soil and compost
Briefly, analysis was performed on compost or soil and was
based on the recognition of forms and structure of helminth eggs in microscope.
Sludgewas prepared by adding 225 mL of 0.1% Tween 80 to 25g compost sample. The
mixture was homogenized for 1 min using a blender and screened through 4 layers
of wet gauze folded. The filtrate was collected in round bottom flasks and
allowed to settle for 3 hours and submitted to analysis. Helminth eggs were
determined by the US EPA protocol (1999) modified by Schwartzbrod (2003) with a
modified density of zinc sulfate (ZnSO4) saline
solution.Quantification of Helminth eggs is made through the equation 3:
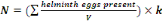  (Equation 4) (Equation 4)
Where:
N = Number of helminth eggs/L
V= Volume of initial sample compost or soil (225 mL);
k = Constant related to the performance of the method (k =
1.42).
Then, result of equation 3 is reduction of the weight of dry
compost or soil diluted (25g) where the final result is expressed in eggs/g.
2.3. Following up indicators of
pathogen on lettuce leave
Sampling consisted in taking 100 g of vegetable matter at the
stage of maturity on each of the 3 repetitions, which are representing 4
samples of each treatment. The collection was carried out in the respect of the
conditions of hygiene and of sterility necessary and the samples are preserved
at 4 °C until the moment of the analyses which take place within the next
24 h. The analyses relate to the surface of the sheets of lettuce. A quantity
of 10 g of lettuce leaves of each treatment was introduced into sterile bottles
with broad collar provided with a lid. Each bottle was completed with 90 ml of
a solution of NaCl with 1N, then closed and agitated during 15 minutes in
horizontal position on a plate agitator.For each flushing water representing a
suspension mother of 10-1, two decimal dilutions at 10-2
and 10-3 were carried out with the NaCl solution with 1N. The
suspension mother and dilutions were sown by spreading out of 0.1 mL on the
culture media (Chromocult Agar or Slanetz Bartley according to the required
type of indicators) cast in boxes of sterile Petri 90 mm in diameter. Each
dilution was the two object repetitions.
3. Quantitative Microbial Risk
Analysis (QMRA) methods
3.1. Hazard identification
All pathogens that are excreted in human excreta and greywater
from insanitary and unhygienic surrounding environment could potentially be
found in irrigation waters and vegetables (Nana O.B. Ackerson and Esi Awuah,
2012). A selection of pathogens was made for the risk assessment, representing
bacteria (Salmonella and E.coli) and helminthes (A.
lumbricoides). From epidemiological reviews, helminthes and bacteria
pose the greatest health risks in human excreta and greywater reuse in
agriculture(WHO, 2006a); (Mara and Sleigh, 2010b). The choice of
Ascaris was due to its persistence for months to years in soil under
harsh conditions(Amoah et al., 2005) thus making it an ideal reference organism
for QMRAs in developing country (Nana O.B. Ackerson and Esi Awuah, 2012)such
as Burkina Faso.
3.2. Exposure assessment
Exposure scenarios were identified from 2 target groups of
population: farmers and urban consumers.
3.2.1. For farmers
We assume that during spreading compost, urine and irrigation
with greywater, farmers did not wear protective clothing and were in direct
contact with the different matrix (compost urine and greywater). Furthermore
compost which is used to spread in our experimental site is not totally
hygienic and mature. It was spread 2 days after it was taken away from family
pilot to Ziniaré.Compost is used like basic manure before plant out
lettuce. It carried out 1 time per cycle of lettuce crop. Variety of lettuce
crop on our site has 50 days as total cycle. Farmers can ingest 100 mg of
compost accidentally when they spread it in the field(Schönning et al.,
2007).In rainy season, farmers do notgrow lettuce crop now in Burkina Faso,
rainy season can take 3 months per year. Thus, farmers can be exposed 5times
per year.Concerning urine,we used urine which is stored during 1 week before
spreading in our experimental site. For doing so,we used a small bucket for
spreading. Urine is applied 3 times per cycle for lettuce crop. Farmers can
ingestaccidentally 0.43mL of urine when they spread it in the field after
making experimentation
(Annex ii). Also farmers spread urine without wear
protective clothing. Exposition frequency is15 times per year.Greywater was
used to irrigate lettuce crop with watering cans. Farmers can ingest
accidentally 1 to 2 mL of greywater (Nana O.B. Ackerson and Esi Awuah,
2012)during irrigation of the lettuce crop. The exposure days per year to
irrigation greywater are 275 days.
Concerning soil ingestion, farmers can ingest accidentally 10
to 100 mg of soil(Haas et al., 1999)contaminated with compost, urine and
greywater when they work in fields.We assume that field workers are directly
in contact with soil when they are spreading compost, planting out lettuce
crops, and weeding the field. Those activities can occur 4 times per cycle.
Therefore, the exposure days per year for those activities are 20 days.
3.2.2. From consumers
According to Shuval et al., (1997) 10.8 mL of irrigation water
will be left on a 100 g lettuce after harvest. There are two days between
lettuce harvest and consumption (WHO, 2006a). The amount of lettuce consumed
per person per day was taken as 100 g at a rate of one lettuce per week per
consumerin developing country (Shuval et al., 1997);(Nana O.B. Ackerson and
Esi Awuah, 2012)such as Burkina Faso. Thus, a consumer can be exposed 52 times
per year.The exposure scenarios of different matrix for farmers and consumers
are summarized in table 3 below.
Table 3: Different exposure
scenarios and pathways which farmers and consumers can be exposed in different
cases
|
Target population
|
Matrix of manipulation
|
Exposure scenario
|
Quantityingested
|
Frequencyexposed (events/year)
|
|
Farmers
|
Compost
|
Handle without protection individual (glove, mask,...) before
to spread compost
|
10-100mga
|
5
|
|
Urine
|
Handle urine in the field with a small bucket and use this
hand to eat without washing it
|
0.43 mL*
|
15
|
|
Soil
|
Ingestion of soil contaminated with greywater, compost
orurine.
|
10-100mgb
|
20
|
|
Greywater
|
Ingestion of greywater from the irrigation system (watering
cans or bucket )
Accidental ingestion
|
1-2mLc
|
275
|
|
Consumers
|
Lettuceharvest
|
Consumers can eat lettuce without washing it
|
10.8mL/100gd
|
52
|
a=(Schönning et al., 2007) ;
b=(Haas et al., 1999) ; c=(Nana O.B. Ackerson and Esi
Awuah, 2012); d=(Shuval et al., 1997).*= Protocol of determination of
amount of urine ingested (annex 2).
3.3. Dose-response
assessment
For dose-response relationships, the beta-Poisson
dose-response model described by Haas et al., (1999)was used for
Salmonella, Ascaris. However, single-hit exponential dose-response can
be applied for Salmonella and Ascaris. Dose-response
parameters for exponential and beta-Poisson models from various enteric
pathogen ingestion studied by different authors were summarized in table 4
below. To calculate microbial risk, uncertain values (minimum and maximum
values) of pathogen amounts will use to evaluate risk for each treatment.
Single-hit exponential model:
  (Equation 5) (Equation 5)
Beta-Poisson model:
  (Equation 6) (Equation 6)
Where   the probability of infection which is a function of r and d the probability of infection which is a function of r and d
  = empirical parameter assumed to be constant for any given
host and given pathogen picked to fit the data = empirical parameter assumed to be constant for any given
host and given pathogen picked to fit the data
  Mean ingested dose, N50= the median
dose, á andâ= slope parameters, which hold when
â=1 and á=â. Mean ingested dose, N50= the median
dose, á andâ= slope parameters, which hold when
â=1 and á=â.
The annual probability of infection is given by:
  (Equation 7) (Equation 7)
Where   = acceptable annual risk of infection caused by a pathogenic
organism = acceptable annual risk of infection caused by a pathogenic
organism
n = number of exposure events per year (events/yr).
A QMRA model for broccoli, cucumber, lettuce, and three
cultivars of cabbage constructed by Hamilton et al. (2006) was used to
calculate the daily dose of pathogenic organism on the lettuce. The beta
-Poisson and exponential dose -response models were subsequently used to
calculate the probability of infection (Nana O.B. Ackerson and Esi Awuah,
2012).
The daily dose of pathogens, ë=d, taken as a result of
consuming the lettuce was calculated as:
  (Equation 8) (Equation 8)
Where,
Mbody = human body mass (kg)
Mi = daily consumption per capita per kg of body
mass [g (kg.ca.day)-1]
ciw= concentration of pathogens in irrigation
water
Vprod= volume of irrigation water caught by product
(mL.g-1)
k = pathogen kinetic decay constant (day-1)
t = time between last reclaimed - water irrigation event and
harvest/consumption/storage (day).
Mbody = 71.8 kg
From survey, Mi = 1.6713 g.
(kg.ca.day)-1
Vprod = 0.125 mL g-1 ; t = 2
d.
Table 4: Summary of
dose-response parameters for exponential and beta-Poisson models from various
enteric pathogen ingestion studies
|
Exponential
|
beta-Poisson
|
|
Constituent
|
r
|
á
|
â
|
N50
|
|
Escherichia coli
|
|
0.1705a
|
1.61 x 10⁶a
|
|
|
Salmonella
|
0,00752a
|
0,313b
|
|
23600b
|
|
Ascaris
|
1b
|
0,104c
|
|
859c
|
a= (Metcalf & Eddy, 2007); b=
(Schönning et al., 2007); c= (Mara and Sleigh,
2010b)
3.4. Risk characterization
Hazard identification, exposure assessment and dose-response
components were integrated to obtain a risk estimate and then comparing this
risk estimated with the acceptable annual risk of infection according to WHO
guidelines which recommend 10-6 DALY. The framework of steps of
Monte Carlo method is shownin figure4.
Start
Randomizing series of numbers following specific distribution
for pathogen concentration in reclaimed water
Repeat for annual exposure frequency
Calculation of a dose from the exposure scenario and from
randomized pathogen concentration in reclaimed water
Repeat for each data set
Calculation of a single daily exposure risk using the
dose-response curve
Calculation of annual risk from the specific exposure scenario
Averagedifferent data sets
Compare with acceptable annual risk of infection(e.g., WHO
recommends 10-6DALY )
Figure 4: Steps of
calculation of Monte Carlo Method
IV.RESULTS AND
DISCUSSION
1. Results
1.1. Quantitative Microbial
Risk Assessment from different treatments
1.1.1. From compost and top water (C+TW) treatment
Annual probabilities of Salmonella and
Ascaris infection related to soil ingestion when farmers use only
compost to spread in the field and when lettuce harvest is eaten by consumers
are showed by table 5 below.Annual risks of Salmonella infection in
scenarios where it is assumed that farmers can ingest accidentally soil, is
3.87x10⁻³ pppy
(Annex iii). That is where a risk is possible
for one infection of Salmonellaper 1000 farmers per year.Concerning
Ascaris infection, annual risks is 4.67x10⁻² (soil ingestion
accidentally)
(Annex v). That is where there may be a risk of
one infection of Ascaris per 100 farmers when they use compost in
field.
For lettuce consumption, Salmonellaannual risk
infection is 1.54x10⁻¹ (i.e. one infection of Salmonella
per 10 consumers per year)
(Annex iv). And Ascaris infection risk is
2.41x10⁻²
(Annex vi) i.e. one infection of
Ascaris per 100 consumers of lettuce per year.
Table 5: Annual probabilities
of Salmonella and Ascaris infection associated with the
ingestion of soil combined with compost and consumption of lettuce
|
Pathogens
|
Soil Ingestion
|
Lettuce consumption
|
|
Pinf
|
Pyr(n=20)
|
Pinf
|
Pyr(n=52)
|
|
Salmonella
|
1.94x10⁻⁴
|
3.87x10⁻³
|
2.96x10⁻³
|
1.54x10⁻¹
|
|
Ascaris
|
2.33x10⁻³
|
4.67x10⁻²
|
4.63x10⁻⁴
|
2.41x10⁻²
|
Annual infection risks of Salmonella and
Ascaris which are compared with WHO guideline valuesin red line
according to both scenarios are showed by figure 5 below.
Figure 5: Annual infection
risks of Salmonella and Ascaris in function of scenarios
compared with WHO guideline value.
1.1.2. For urine and top water (U+TW) treatment
Annual probabilities infection of Salmonella
associated with the soil ingestion combined with urine and lettuce consumption
are summarized in table 6 below.
Salmonella annual risk infection in a scenario which
assumes that farmers can ingest accidentally soil spread with urine
is9.55x10-1
(Annex vii). It means one
infection of Salmonella per 10 farmers per year when they use urine to
spread in field.
Table 6: Annual probabilities
of Salmonella infection associated with the ingestion of soil combined
with urine and consumption of lettuce
|
Pathogen
|
Soil ingestion
|
Lettuce consumption
|
|
Pinf
|
Pyr(n=20)
|
Pinf
|
Pyr(n=52)
|
|
Salmonella
|
4.78x10⁻²
|
9.55x10⁻¹
|
2.50x10⁻⁹
|
1.30x10⁻⁷
|
For lettuce consumption, annual risk is 1.30x10⁻⁷
(Annex viii) i.e. one infection of
Salmonellaper 10000000 consumers of lettuce per year.
Annual infection risks of Salmonella which are
compared with WHO guideline values in red line according to both scenarios are
showed by figure 6 below.
Figure 6 : Annual
infection risks of Salmonella in function of scenarios compared with
WHO guideline value.
1.1.3. From greywater only (GW) treatment
Annual probabilities of infection from Salmonella
associated with the soil irrigated with greywater and lettuce consumption are
summarized in table 7 below. Salmonella annual risksinfection in
scenario which assumes that farmers ingest accidentally 10 to 100 mg of soil
irrigated with greywater is8.89x10-6
(Annex ix). It means that one infection of
Salmonella per 1000000 farmers per year when they are exposure 20 days
per year.
From ingestion of irrigation greywater, annual risk infection
is 1.02x10⁻⁴
(Annex x)i.e. one infection of
Salmonellaper 10000 farmers per year for 275 days of exposure in worst
case.
Table 7: Annual probabilities
of Salmonella infection associated with the soil and greywater
ingestion combined with greywater and lettuce consumption
|
Pathogen
|
Soil ingestion
|
Irrigation greywater
|
Lettuce consumption
|
|
Pinf
|
Pyr(n=20)
|
Pinf
|
Pyr(n=275)
|
Pinf
|
Pyr(n=52)
|
|
Salmonella
|
4.45x10⁻⁷
|
8.89x10⁻⁶
|
3.69x10⁻⁷
|
1.02x10⁻⁴
|
1.81x10⁻⁵
|
9.42x10⁻⁴
|
Concerning lettuce consumption, Salmonella risk
infection is 9.42x10⁻⁴
(Annex xi).i.e. one infection of
Salmonella per 10000 consumers of lettuce leaves per year when they
eat it during 52 days per year.
Annual infection risks of Salmonella which are
compared with WHO guideline values in red line according to three scenarios are
showed by figure 7 below.
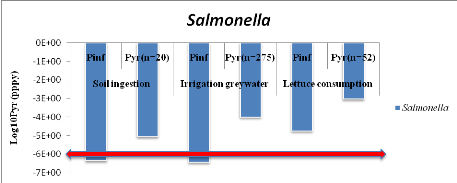
Figure 7 : Annual
infection risks of Salmonella in function of scenarios compared with WHO
guideline value.
1.1.4. For compost, urine, ant greywater (C+U+GW)
treatment
Annual risks infection of Salmonella and
Ascaris are showed by table 8 according to 3 scenarios (soil
ingestion, ingestion irrigation greywater and lettuce consumption).
From soil ingestion, Salmonella annual risk infection
is 1.44x10⁻⁴
(Annex xii). That is when there will be a risk
of one infection of Salmonella per 10000 farmers when farmers are
exposure during 20 days per year. For Ascaris infection, risk is
4.67x10⁻²
(Annex xiii). That means one infection of
Ascaris per 100 farmers during 20 days exposure per year.
Table 8: Annual probabilities
of Salmonella and Ascaris infection associated with the soil
and greywater ingestion combined with compost, urine and greywater and lettuce
consumption
|
Pathogens
|
Soil ingestion
|
Irrigation greywater
|
Lettuce consumption
|
|
Pinf
|
Pyr(n=20)
|
Pinf
|
Pyr(n=275)
|
Pinf
|
Pyr(n=52)
|
|
Salmonella
|
7.21x10⁻⁶
|
1.44x10⁻⁴
|
5.58x10⁻⁶
|
1.53x10⁻³
|
2.50x10⁻⁸
|
5.00x10⁻⁷
|
|
Ascaris
|
2.33x10⁻³
|
4.67x10⁻²
|
1,44x10⁻³
|
3.97x10⁻¹
|
4.63x10⁻⁴
|
2.41x10⁻²
|
Fromingestion of irrigation greywater, Salmonella
annual risk infection is 1.53x10⁻³
(Annex xiv). That means there will be a risk of
one infection of Salmonella per 1000 farmers per year during 275 days
of exposure. For Ascaris infection, risk is 3.97x10⁻¹
(Annex xv). It means one infection of
Ascaris per 10 farmers during 275 days of exposure per year.
From lettuce consumption, Salmonella annual risk
infection is 5.00x10⁻⁷
(Annex xvi). That means there will be a risk of
one infection of Salmonella per 1000000consumers of lettuce leaves per
year during 52 days of exposure. For Ascaris infection, risk is
2.41x10⁻²
(Annex xvii). It means that one infection of
Ascaris per 100 farmers during 52 days of exposure per year.
Annual infection risks of Salmonella and Ascaris
which are compared with WHO guideline in red line values according to
three scenarios are showed by figure 8 below.
Figure 8: Annual infection
risks of Salmonella and Ascaris in function of scenarios
compared with WHO guideline value.
1.2. Comparison of the
probabilistic values of different treatments related with the scenarios
1.2.1. For soil ingestion scenario
The probabilistic values of all treatments compared with the
WHO guideline values of risk for soil ingestion scenario are showed in the
table 9 below.Salmonellaannual risk of infection in worst case from
U+TW (9.55x10⁻¹) is higher than C+TW (3.87x10⁻³), C+U+GW
(1.44x10⁻⁴) and GW (8.89x10⁻⁶) for soil ingestion.The
annual risk of infection in all treatment exceeded the tolerable risk of
=10-6 per person per year (WHO, 2006a).Ascaris annual risks
of infection in worst case from C+TW and C+U+GW are equal
(4.67x10⁻²), however, this probabilistic values are higher than WHO
guideline values (2006).
Table 9 : Probabilistic
values of different treatments compared with the WHO guideline values of the
risk.
|
Soil ingestion
|
WHO guidelines values
|
|
Treatment
|
Pathogens
|
10-6
|
|
Salmonella
|
Ascaris
|
|
C+TW
|
3.87x10⁻³
|
4.67x10⁻²
|
|
U+TW
|
9.55x10⁻¹
|
NA
|
|
GW
|
8.89x10⁻⁶
|
NA
|
|
C+U+GW
|
1.44x10⁻⁴
|
4.67x10⁻²
|
C+TW=Compost +Top water; U+TW=Urine + Top water;
GW=Greywater; C+U+GW=Compost + Urine + Greywater.
The probabilistic values of all treatments compared with the WHO
guideline values in red line of risk for soil ingestion scenario are showed by
figure 9 below.
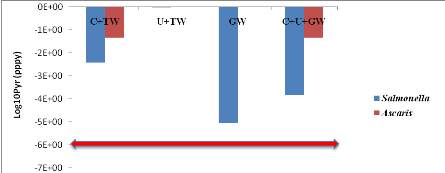
Figure 9 :
Probabilistic values of all treatments compared with the WHO guideline values
of risk for soil ingestion scenario
1.2.2. Ingestion of irrigated greywater
The probabilistic values of all treatments compared with the
WHO guideline values of risk for ingestion of irrigated greywater scenario are
showed in the table 10 below. Salmonella annual risk of infection in
worst case from C+U+GW (1.53x10⁻³) is higher than GW
(1.02x10⁻⁴). The annual risk of infection in all treatment exceeded
the tolerable risk of =10-6 per person per year (WHO, 2006a).
Table 10:Probabilistic values
of Greywater and Compost, Urine and Greywater treatments compared with the WHO
guideline values of the risk.
|
Pathogen
|
Treatment
|
WHO guideline values
|
|
GW
|
C+U+GW
|
10-6
|
|
Salmonella
|
1.02x10⁻⁴
|
1.53x10⁻³
|
Probabilistic values of Greywater and Compost, Urine
and Greywater treatments compared with the WHO guideline values of the risk are
showed by figure 10 below.
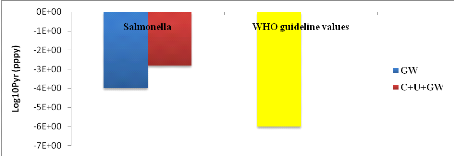
Figure 10 :
Probabilistic values of Greywater and Compost, Urine and Greywater treatments
compared with the WHO guideline values
1.2.3. Lettuce consumption
The probabilistic values of all treatments compared with the
WHO guideline values of risk for lettuce consumption scenario are showed in the
table 11 below. Salmonella annual risk of infection in worst case from
C+TW (1.54x10⁻¹) is higher than U+TW (1.30x10⁻⁷), C+U+GW
(5.00x10⁻⁷) and GW (9.42x10⁻⁴).
The annual risk of infection in all treatment exceeded the
tolerable risk of =10-6 per person per year (WHO, 2006a).
Ascaris annual risks of infection C+TW and C+U+GW are equal
(4.67x10⁻²), however, this probabilistic values are higher than WHO
guideline values (2006).
Table 11: Probabilistic
values of different treatments compared with the WHO guideline values of the
risk.
|
Pathogens
|
Treatment
|
WHO guideline values
|
|
C+TW
|
U+TW
|
GW
|
C+U+GW
|
10-6 pppy
|
|
Salmonella
|
1.54x10⁻¹
|
1.30x10⁻⁷
|
9.42x10⁻⁴
|
5.00x10⁻⁷
|
|
Ascaris
|
2.41x10⁻²
|
NA
|
NA
|
2.41x10⁻²
|
The probabilistic values of all treatments compared with the WHO
guideline values of risk for lettuce consumption scenario are showed by figure
11 below.
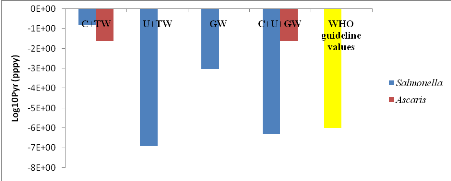
Figure 11: Probabilistic
values of all treatments compared with the WHO guideline values of risk for
lettuce consumption scenario
2. Discussion
2.1. Quantitative Microbial
Risk Assessment from each treatment.
2.1.1. For compost and top water treatment (C+TW)
Annual probabilities of Salmonella and
Ascaris infection related to soil ingestion when farmers use only
compost to spread in the field and when lettuce harvest is eaten by consumers
are showed by figure 5 above.
Annual risks of Salmonella infection in scenarios
where it is assumed that farmers can ingest accidentally 10 to 100 mg of soilis
3.87x10⁻³ pppy. That means there will be a risk of one infection of
Salmonella per 1000 farmers per year.Salmonella risk
infection (3.87x10⁻³) for accidental soil ingestion is relatively
high and exceeds the benchmark in this scenario by a 3 order magnitude
(10-3). Thus farmers may be at risk of contracting typhoid fever
(Westrell, 2004) and (Nana O.B. Ackerson and Esi Awuah, 2012).Concerning
Ascaris infection, annual risk is 4.67x10⁻²(soil ingestion
accidentally). That means there will be a risk of one infection of
Ascaris per 100 farmers when they use compost in field. The annual
infection risk is relatively high and exceeds the benchmark by a 4 order of
magnitude (10-4). According to Amoah et al., (2011) farmers may be
at risk of contracting ascariasis.
From lettuce consumption, Salmonella annual risks
infection is 1.54x10⁻¹ (i.e. one infection of Salmonella
per 10 consumers per year).Salmonella annual risk infection is
relatively high and exceeds the benchmark by a 5 order of magnitude
(10-5). Consumers may be at risk of contracting typhoid fever when
they eat lettuce leaves --(Mara et al., 2010).Ascaris infection risk
for lettuce consumption is2.41x10-2i.e. one infection of
Ascaris per 100 consumers of lettuce per year.The annual infection
risk is relatively high and exceeds the benchmark by a 4 order of magnitude
(10-4). According to Amoah et al., (2011)consumers may be at risk of
contracting ascariasis.
Any single pathogen that is ingested can multiply and form a
clone which is capable of causing infection -(Haas et al., 1993). The annual
risk of infection for all pathogens in both scenarios exceeded the tolerable
risk of =10-6 per person per year (WHO, 2006a).
2.1.2. For urine and top water (U+TW) treatment
Annual probabilities infection of Salmonella associated with
the soil ingestion combined with urine and lettuce consumption are summarized
in figure 6 above.
Salmonella annual risk infection in scenario which
assumes that farmers can ingest accidentally soil spread with urine is
9.55x10⁻¹. It means one infection of Salmonella per 10
farmers per year when they use urine to spread in field.This is high and
exceeds the benchmark by 5ordersof magnitude. Thus, farmers may be at risk of
contracting diseases (Höglund, 2001).
For lettuce consumption, annual risk is respectively
1.20x10⁻⁷ and 1.30x10⁻⁷ for 50 and 95 percentile i.e. one
infection of Salmonellaper 10000000 consumers of lettuce per year.
Risk is relatively low and respects the tolerable risk recommended
(10-6 pppy) by WHO guidelines (WHO, 2006b). In this scenario
consumers may eat lettuce leaves without any high risk-(Carr, 2005).
2.1.3. For greywater only (GW) treatment
Annual probabilities of infection by Salmonella
associated with the soil irrigated with greywater and lettuce consumption are
summarized in figure 7 above.
Salmonella annual risks infection in a scenario which
assumes that farmers ingest accidentally 10 to 100 mg of soil irrigated with
greywater is 8.89x10⁻⁶. It means that one infection of
Salmonella per 1000000 farmers per year when they is exposure of 20
days per year. This result complies with the tolerable annual risk
(10-6 per person per year)recommended by WHO, (2006a). This exposure
do not constitute a public health from farmers-(Zuma and Tandlich, 2010).
For irrigation with greywater (farmers can ingest 1 to 2 mL),
annual risk infection is 1.02x10⁻⁴ i.e. one infection of
Salmonella per 10000 farmers per year for 275 days of exposure in
worst case. Theorder ofmagnitude is2. In this situation, farmers may be at risk
of contracting diseases according to WHO, (2006a) guidelines.
It is concerning lettuce consumption, Salmonella risk
infection is 9.42x10⁻⁴ .i.e. one infection of Salmonella
per 10000 consumers of lettuce leaves per year when they eat it during 52 days
per year. The magnitude is 2 orders compared to WHO recommendations
(10-6 pppy). These lettuce leaves cannot eat because of high load
remain on leaves when they irrigate it with greywater. However last irrigation
before harvest must be considered (2 days) in evaluation of risk according to
Shuval et al., (1997) and WHO, (2006a).
2.1.4. For compost, urine, and greywater (C+U+GW)
treatment
Annual risks infection of Salmonella and
Ascaris are showed by figure 8above according to 3 scenarios (soil
ingestion, ingestion irrigation greywater and lettuce consumption).
For soil ingestion, Salmonella annual risk infection
is 1.44x10⁻⁴. That means there will be a one infection of
Salmonella per 10000 farmers for the worst case when farmers are
exposed during 20 days per year. This is relatively high and exceeded the
benchmark 2 order of magnitude compared to WHO guidelines (10-6
pppy). Farmers may be at risk of contracting salmonellosis or typhoid fever
(Nana O.B. Ackerson and Esi Awuah, 2012). For Ascaris infection, risk is
4.67x10⁻². It means one infection of Ascaris per 100 farmers during
20 days exposure per year.This is relatively high and exceeds the benchmark by
4 order of magnitude compared to WHO guidelines (10-6 pppy). Farmers
can be infected by ascariasis.
From ingestion of irrigation greywater, Salmonella
annual risk infection is 1.53x10⁻³. That means there will be a risk
of one infection of Salmonella per 1000 farmers per year during 275
days of exposure. This is high and exceeds the benchmark in both cases by 3
orders of magnitude (10-3). Farmers may be at risk of contracting
salmonellosis or typhoid fever(Höglund et al., 1998). For Ascaris
infection, risk is 3.97x10⁻¹. It means one infection of Ascaris per
10 farmers during 275 days of exposure per year. This is relatively high and
exceeds the benchmark by 5 order of magnitude compared to WHO guidelines
(10-6 pppy). Farmers can be infected by ascariasis(Mara and Sleigh,
2010b).
From lettuce consumption, Salmonella annual risk
infection is 5.00x10⁻⁷. That means there will be a risk of one
infection of Salmonella per 10000000 consumers of lettuce leaves per
year during 52 days of exposure. This result complies with the tolerable
annual risk (10-6 per person per year)recommended by WHO, (2006a).
This exposure does not constitute a public health risk from farmers.
ConcerningAscaris infection, risk is 2.41x10⁻². It means
one infection of Ascaris per 100 farmers during 52 days of exposure per year.
This is relatively high and exceeds the benchmark by 4 order of magnitude
compared to WHO guidelines (10-6 pppy). Farmers can be infected by
ascariasis (Mara and Sleigh, 2010b).
2.2. Comparison of the
probabilistic values of different treatments related with the scenarios
The probabilistic values of all treatments compared with the
WHO guideline values of risk for soil ingestion scenario are showed in the
figure 9 above. Salmonella annual risk of infection from U+TW
(9.55x10⁻¹) is higher than C+TW (3.87x10⁻³), C+U+GW
(1.44x10⁻⁴) and GW (8.89x10⁻⁶) for soil ingestion. The
annual risk of infection in all treatment exceeded the tolerable risk of
=10-6 per person per year (WHO, 2006a). The recorded values were
above the recommended annual risk of infection by a 5 order of magnitude (U+TW
(9.55x10⁻¹)).
Ascaris annual risks of infection in worst case from
C+TW and C+U+GW are equal to (4.67x10⁻²) however;these probabilistic
values are higher than WHO guideline values (2006).The recorded value was above
the recommended annual risk of infection by a 4 order of magnitude. This is
more than the range of annual risk of Ascaris infection of
10-3 to 10-4 reported by Seidu et al. (2008) who
used data from studies in Ghana to assess the annual risk of infection
associated with the reuse of diluted wastewater for irrigation (Nana O.B.
Ackerson and Esi Awuah, 2012).
The probabilistic values of all treatments compared with the
WHO guideline values of risk for ingestion of irrigated greywater scenario are
showed in the figure 10 above.
Salmonella annual risk of infection in worst case
from C+U+GW (1.53x10⁻³) is higher than GW (1.02x10⁻⁴).
The annual risk of infection in all treatment exceeded the tolerable risk of
=10-6 per person per year (WHO, 2006a). The recorded value was above
the recommended annual risk of infection by a 3 order of magnitude.
However, USEPA considers an annual risk of 10-4 to
be acceptable for microbial contamination of drinking water, therefore the
annual risk of infection for C+U+GW is above this recommended annual risk of
infection by a 1 order of magnitude (Shuval et al., 1997).
The probabilistic values of all treatments compared with the
WHO guideline values of risk for lettuce consumption scenario are showed in the
figure 11 above. Salmonella annual risk of infection in worst case
from C+TW (1.54x10⁻¹) is higher than U+TW (1.30x10⁻⁷),
C+U+GW (5.00x10⁻⁷) and GW (9.42x10⁻⁴).
The annual risk of infection in all treatment exceeded the
tolerable risk of =10-6 per person per year (WHO, 2006a).
Ascaris annual risk of infection from C+TW and C+U+GW is equal
(4.67x10⁻²), however, this probabilistic value is higher than WHO
guideline values (2006). The recorded value was above the recommended annual
risk of infection by a 4 order of magnitude. This is attributed to the relative
low levels of Ascaris counts in lettuce. This is more than the range
of annual risk of Ascaris infection of 10-3 to
10-4 reported by Seidu et al. (2008) who used data from
studies in Ghana to assess the annual risk of infection associatedwith the
reuse of diluted wastewater for irrigation (Nana O.B. Ackerson and Esi Awuah,
2012).
2.2.1. Risk assessment from farmers
The risk more proven meets at the time of the ingestion of the
soil on which the urine wasspread urine (U+TW)is the Salmonella risk
infection (9.55x10⁻¹).That could be explained by the fact why the
urines used for the fertilization go back to less than one week of storage.
With a significant load of the pathogens (Salmonellas) or indicator of
the pathogen such as the enterococci
(Annex xix). However, if the time of storage of
urine is long, that contributes to the reduction of the risks of infection of
the pathogen. That was proven by the works ofHöglund et al., (2002) which
showed that for a time of storage of 4 weeks, the risk of infection of
bacteria is at least of 10-15. In combination of C+TW, C+U+GW and GW
(figure 9), the annual risk of infection of Salmonella is higher than
benchmark (10-6 DALY) proposed by WHO, (2006a). Ascaris
annual risk infection is high in C+TW and C+U+GW
(4.67x10⁻²)combination. However, compost which is used to spread in
field, go back to less than 3 days (unstored) where 27 eggs/g dry weight of
compost were fund. Risk could be reduced, if faeces were stored at least 12
months before its use for the fertilization of the cultures such as confirm by
Schönning et al., (2007) who were determined values above 10-4
recommended by Swedish EPA, (2007).
For ingestion of irrigated greywater, the risk of infection of
Salmonellain both combinations (figure 10) is higher than the WHO
guideline value. But value of C+U+GW (1.53x10⁻³)is higher than GW
(1.02x10⁻⁴). Risk could be mitigated, if farmers use adequate
equipment of protection before to irrigate the crops. In addition, if irrigated
greywater amount of fecal indicators is below of 103CFU/100 mL
recommended by WHO, (2006a).
2.2.2. Risk assessment from consumers
The risk more proven meets at the time of the consumption of
lettuce is the C+TW treatment where Salmonella risk infection is
1.54x10⁻¹, then GW treatment (9.42x10⁻⁴). Infection of
risk from C+TW is higher than WHO recommendations (10-6). This high
value could be explained by the fact that, compost was not mature before use to
spread in the field. Therefore, when they irrigate the crop microorganisms may
be regrow and then tosettle on the lettuce leaves thanks to the water drops(FAO
and WHO, 2008). From GW, risk could be reduced if last irrigation before
harvest must be considered (2 days) according to Shuval et al., (1997) and
WHO, 2006a.Ascaris annual risks of infection C+TW and C+U+GW are
equal (4.67x10⁻²), however, this probabilistic values are higher
than WHO guideline values (2006). Risk could be reduced thanks to
recommendation above given by WHO, (1998) concerning conservation of foods.
Furthermore, according to Shuval et al., (1997), pathogens attached to plants
will be inactivated withtime due to natural attrition and the effects of
desiccation, UV irradiation, heat and biological competition.
Conclusion and
perspectives
The risks related to the reuse of compost, urine and greywater
in agriculture were varied according to the different treatments and scenarios
which were assumed from farmers and consumers.
Therefore, the risk more proven meets at the time of the
ingestion of the soil on which the urine wasspread urine (U+TW) is the
Salmonella risk infection > 10-6.That could be explained
by the fact why the urines used for the fertilization go back to less than one
week of storage. With a significant load of the pathogens
(Salmonellas) or indicator of the pathogen such as the
enterococci.However, if the time of storage of urine is long, that contributes
to the reduction of the risks of infection of the pathogen. Ascaris
annual risk infection is high in C+TW and C+U+GW combination. However Risk
could be reduced, if faeces were stored at least 6-12 months before its use for
the fertilization of the cultures.
For ingestion of irrigated greywater, the risk of infection of
Salmonella in both combinations (GW and C+U+GW) is higher than the WHO
guideline value.Risk could be mitigated, if farmers use adequate equipment of
protection before to irrigate the crops. In addition, if irrigated greywater
amount of fecal indicators is below of 103CFU/100mL.
For lettuce consumption, risk infection of pathogens is high
than benchmark (10-6), however it could be reduced by observing the
WHO recommendations.
Through this study, compost, urine may be used to fertilize
the soil and greywater may be used to irrigate the crop which can eat
freshly.
These results may be contributed for managing the public
health by reducing diseases from populations. But if farmers and consumers
observe the recommendations of protection by wearing protection equipment for
farmers and washing the lettuce leaves with clean water before eating for the
consumers.
In sahelian climate, risk infection of pathogens could be
reduced thank to sun because the sunbeam play a significant role in the
inactivation of pathogen in the soil.
This study has given us an insight into manyother research
possibilities. For example, risk assessment can study in handle faeces and
urine from families' pilot. Also, health risk could be assessing from urban
farmers in Ouagadougou city where they use wastewater and dam water to irrigate
crops.
IV. References
Al-Hamaiedeh, H.D., 2010.The Impact of Greywater Reuse in
Irrigation on Public Health and Safety.Electronic Journal of Geotechnical
Engineering 15, 1131-1138.
Amoah, P., Drechsel, P., Abaidoo, R.C., 2005. Irrigated urban
vegetable production in Ghana: sources of pathogen contamination and health
risk elimination. Irrigation and Drainage 54, S49-S61.
Amoah, P., Keraita, B., Akple, M., Drechsel, P., Abaidoo,
R.C., Konradsen, F., 2011.Low-cost options for reducing consumer health risks
from farm to fork where crops are irrigated with polluted water in West Africa.
IWMI Res. Rep. 2011, 1-37.
Asano, T., Leong, L.Y.C., Rigby, M.G., Sakaji, R.H.,
1992.Evaluation of the California wastewater reclamation criteria using enteric
virus monitoring data. Water Science & Technology 26, 1513-1524.
Carr, R., 2005. WHO Guidelines for Safe Wastewater Use - More
than just Numbers.Irrig. and Drain, IRRIGATION AND DRAI NAGE 54, 103-111.
DGRE, 2010. RAPPORT SECTORIEL BILAN ANNUEL AU 31 DECEMBRE
2009 & PROGRAMMATION 2010. Direction Générale des Ressources
en Eau, Ouagadougou, Burkina Faso.
FAO and WHO, 2008. Microbiological Risk Assessment series:
Microbiological hazards in fresh leafy vegetables and herbs (Meeting report
No. 14). Food and Agriculture Organization of United Nations (FAO) and World
Health Organization (WHO), Génève.
Fidjeland, J., 2010. Quantitative microbial risk assessment of
agricultural use of fecal matter treated with urea and ash.
Gemmell, E.M., Schmidt, S., 2011. Microbiological assessment
of river water used for the irrigation of fresh produce in a sub-urban
community in Sobantu, South Africa.Food Research International 6.
Haas, C.N., Rose, J.B., Gerba, C., Regli, S., 1993.Risk
assessment of virus in drinking water. Risk Analysis 13, 545-552.
Haas, C.N., Rose, J.B., Gerba, C.P., 1999. Quantitative
microbial risk assessment.John Wiley & Sons.
Höglund, C., 2001. Evaluation of microbial health risks
associated with the reuse of source-separated human urine (Doctoral
thesis).
Höglund, C., Stenstrom, T.A., Ashbolt, N., 2002.
Microbial risk assessment of source-separated urine used in agriculture. Waste
Management & Research 20, 150-161.
Höglund, C., Stenström, T.A., Jönsson, H.,
Sundin, A., 1998. Evaluation of Faecal Contamination and Microbial Die-off in
Urine Separating Sewage Systems. Water Science & Technology, Pergamon 38,
17-25.
Maimon, A., Tal, A., Friedler, E., Gross, A., 2010. Safe
on-Site Reuse of Greywater for Irrigation - A Critical Review of Current
Guidelines. Environmental Science & Technology 44, 3213-3220.
Mara, D., Hamilton, A., Sleigh, A., Karavarsamis, N., 2010.
Updating the 2006 WHO Guidelines: More appropriate tolerable additional burden
of disease Improved determination of annual risks Norovirus and Ascaris
infection risks Extended health-protection control measures Treatment and
non-treatment options. WHO, IDRC, FAO, IWMI 8.
Mara, D., Sleigh, A., 2010a. Estimation of norovirus infection
risks to consumers of wastewater-irrigated food crops eaten raw. Journal of
Water and Health 39-45.
Mara, D., Sleigh, A., 2010b. Estimation of norovirus and
Ascaris infection risks to urban farmers in developing countries using
wastewater for crop irrigation. Journal of Water and Health 8 (3) 572-576.
Mara, D.D., Sleigh, P.A., Blumenthal, U.J., Carr, R.M., 2007a.
Health risks in wastewater irrigation: Comparing estimates from quantitative
microbial risk analyses and epidemiological studies. Journal of Water and
Health 5, 39-50.
Mara, D.D., Sleigh, P.A., Blumenthal, U.J., Carr, R.M., 2007b.
Health risks in wastewater irrigation: Comparing estimates from quantitative
microbial risk analyses and epidemiological studies. Journal of Water and
Health pp 39-50.
McDowell, B.D., Lemer, A.C., 1991. Uses of Risk Analysis to
Achieve Balanced Safety in Building Design and Operations. The National
Academies Press.
Metcalf & Eddy, 2007. Water Reuse: Issues, Technologies,
and Application, MC Graw Hill. ed. RR Donnelley, USA.
Nana O.B. Ackerson, Esi Awuah, 2012. Microbial Risk
Assessment of Urban Agricultural Farming: A Case Study on Kwame Nkrumah
University of Science and Technology Campus, Kumasi, Ghana. International
Journal of Science and Technology Vol 1 N°3 118-125.
NIKIEMA, B.C.W.-Y., 2012.Etude Pilote du Traitement des Eaux
Grises pour Petites Communauté en Milieu Rural?: cas du village de
Kologodjessé (Mémoire de Master). 2iE, Ouagadougou, Burkina
Faso.
OMS et UNICEF, 2007. Atteindre l'OMD relatif à l'eau
potable et à l'assainissement: Le défi urbain et rural de la
décennie.
Schönning, C., Westrell, T., Stenström, T.A.,
Arnbjerg-Nielsen, K., Hasling, A.B., Høibye, L., Carlsen, A.,
2007.Microbial risk assessment of local handling and use of human
faeces.Journal of Water and Health 5, 117.
Shuval, H., Lampert, Y., Fattal, B., 1997. Development of a
Risk Assessment Approach for Evaluating Wastewater Reuse Standards for
Agriculture. Water Science & Technology, Pergamon 35, 15-20.
SOU, Y.M., 2009. Recyclage des eaux usées en
irrigation?: potentiel fertilisant, risques sanitaires et impacts sur la
qualité des sols (Thèse de Doctorat).
Swedish EPA, 2007.Vad innehaller avlopp fran hushall? (What
does household wastewater contain?) (Report No. 4425). Swedish Environmental
Protection Agency, Stockholm.
Tagro, P., 2012. Performance de la Désinfection solaire
(SODIS) sur le traitement des urines destinées à l'agriculture
(Mémoire de Master). 2iE, Ouagadougou, Burkina Faso.
Westrell, T., 2004. Microbial risk assessment and its
implications for risk management in urban water systems (Doctoral thesis).
WHO, 1998. Surface decontamination of fruits and vegetables
eaten raw: a review ( No. WHO/FSF/FOS/98.2). World Health Organization,
Génève.
WHO, 1999.Principles and Guidelines for the conduct of
Microbiological Risk Assessment.CAC/GL-30, World Health Organization, Geneva,
Switzerland.
WHO, 2006a. Guidelines for Safe Use of Wastewater, Excrete and
Greywater: Excreta and greywater use in agriculture, WHO Library
Cataloguing-in-Publication Data. ed. WHO, Génève.
WHO, 2006b. Guidelines for Safe Use of Wastewater, Excreta and
Greywater: Wastewater Use in Agriculture, WHO Library
Cataloguing-in-Publication Data. ed. WHO, Génève.
Zuma, B.M., Tandlich, R., 2010. Public health implications of
greywater generation in South Africa: testing a greywater treatment model:
reflections on the Millennium Development Goals-profile. South African Health
Review 123-126.
Annex
Tables de Mac Grady
|
2 tubes par dilution
|
3 tubes par dilution
|
|
Nombre caractéristique
|
Nombre de cellules
|
Nombre caractéristique
|
Nombre de cellules
|
Nombre caractéristique
|
Nombre de cellules
|
Nombre caractéristique
|
Nombre de cellules
|
|
000
001
010
011
020
100
101
110
111
120
121
200
201
210
211
212
220
221
222
|
0.0
0.5
0.5
0.9
0.9
0.6
1.2
1.3
2.0
2.0
3.0
2.5
5.0
6.0
13.0
20.0
25.0
70.0
110.0
|
000
001
010
011
020
100
101
102
110
111
120
121
130
200
|
0.0
0.3
0.3
0.6
0.6
0.4
0.7
1.1
0.7
1.1
1.1
1.5
1.6
0.9
|
201
202
210
211
212
220
221
222
223
230
231
232
300
301
|
1.4
2.0
1.5
2.0
3.0
2.0
3.0
3.5
4.0
3.0
3.5
4.0
2.5
4.0
|
302
310
311
312
313
320
321
322
323
330
331
332
333
|
6.5
4.5
7.5
11.5
16.0
9.5
15.0
20.0
30.0
25.0
45.0
110.0
140.0
|
|
5 tubes par dilution
|
|
Nombre caractéristique
|
Nombre de cellules
|
Nombre caractéristique
|
Nombre de cellules
|
Nombre caractéristique
|
Nombre de cellules
|
Nombre caractéristique
|
Nombre de cellules
|
|
000
001
002
010
011
012
020
021
030
100
101
102
103
110
111
112
120
121
122
130
131
140
200
201
202
|
0.0
0.2
0.4
0.2
0.4
0.6
0.4
0.6
0.6
0.2
0.4
0.6
0.8
0.4
0.6
0.8
0.6
0.8
1.0
0.8
1.0
1.1
0.5
0.7
0.9
|
203
210
211
212
220
221
222
230
231
240
300
301
302
310
311
312
313
320
321
322
330
331
340
341
350
|
1.2
0.7
0.9
1.2
0.9
1.2
1.4
1.2
1.4
1.4
0.8
1.1
1.4
1.1
1.4
1.7
2.0
1.4
1.7
2.0
1.7
2.0
2.0
2.5
2.5
|
400
401
402
403
410
411
412
420
421
422
430
431
432
440
441
450
451
500
501
502
503
504
510
511
512
|
1.3
1.7
2.0
2.5
1.7
2.0
2.5
2.0
2.5
3.0
2.5
3.0
4.0
3.5
4.0
4.0
5.0
2.5
3.0
4.0
6.0
7.5
3.5
4.5
6.0
|
513
520
521
522
523
524
525
530
531
532
533
534
535
540
541
542
543
544
545
550
551
552
553
554
555
|
8.5
5.0
7.0
9.5
12.0
15.0
17.5
8.0
11.0
14.0
17.5
20.0
25.0
13.0
17.0
25.0
30.0
35.0
45.0
25.0
35.0
60.0
90.0
160.0
180.0
|
Annex i: Table of Mac Grady
Annex ii: Determination of amount of urine ingested from
farmers
Protocol
The simulation of this experimentation is done through spreading
the urine in the field in the same way a farmer would do. However, we used
gloves before handling urine. After we finished handling urine, we withdrew the
gloves and put them in sterilized bags to be analyzed. Then, the gloves were
rinsed in a fixed volume (100 mL) of ultra-pure water. The amount of nitrogen
was determined in this rinsed water. However, we must soak the gloves before
analysis to know if nitrogen is not on these gloves where the result may be of
use for control.
Assuming that all nitrogen proceeds from urine, we use the
equation of conservation of concentration to determine the amount of urine
ingested.

Where:
Vi= Volume of urine ingested (L),
Ci= Initial concentration of nitrogen contained in
stored urine (mg/L),
Vf= Volume of water where gloves soak (L),
Cf= Concentration of nitrogen of urine in rinsed
water (mg/L).

Annex iii: Calculation of Salmonella
infection risk from soil ingestion of C+TW treatment
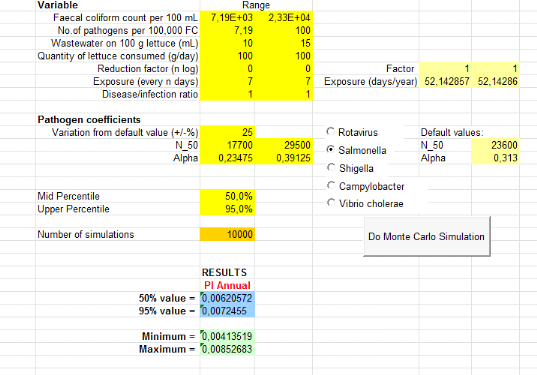
Annex iv : Calculation of Salmonella
infection risk from lettuce consumption of C+TW treatment
 Annex v Calculation of Ascaris infection risk from soil ingestion of
C+TW treatment Annex v Calculation of Ascaris infection risk from soil ingestion of
C+TW treatment

Annex vi: Calculation of Ascaris infection risk from
lettuce consumption of C+TW treatment
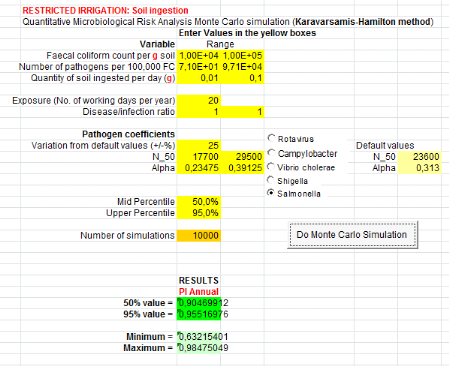
Annex vii :Calculation of Salmonella
infection risk from soil ingestion of U+TW treatment
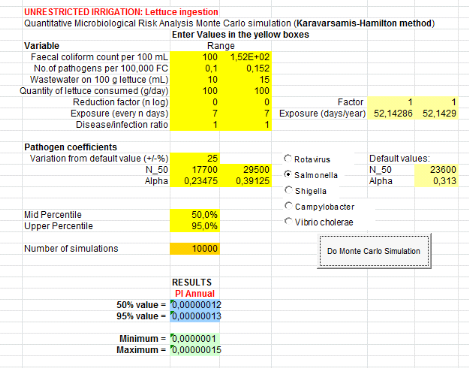
Annex viii : Calculation of Salmonella
infection risk from lettuce consumption of U+TW treatment
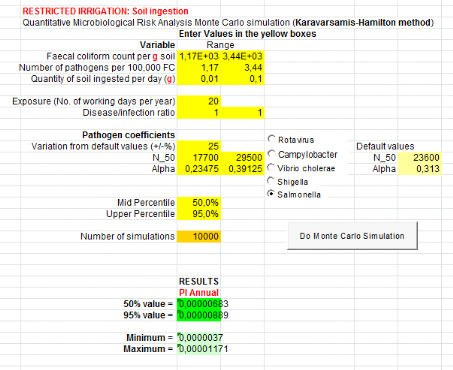
Annex ix : Calculation of Salmonella
infection risk from soil ingestion of GW treatment for 20 days
exposure
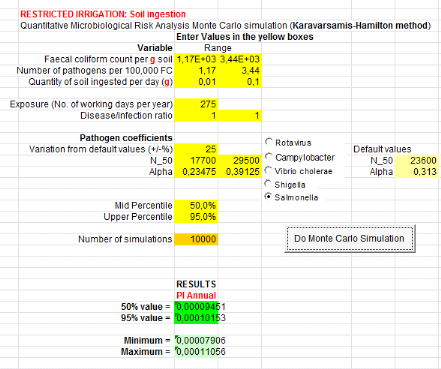
Annex x :Calculation of Salmonella
infection risk from soil ingestion of GW treatment for 275 days
exposure
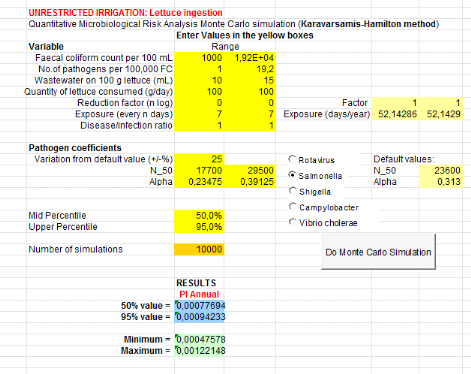
Annex xi : Calculation of Salmonella
infection risk from lettuce consumption of GW treatment
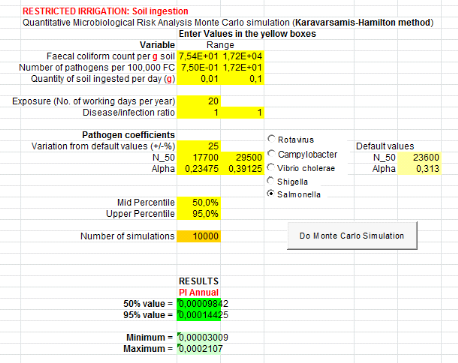
Annex xii : Calculation of Salmonella
infection risk from soil ingestion of C+U+GW treatment for 20 days
exposure
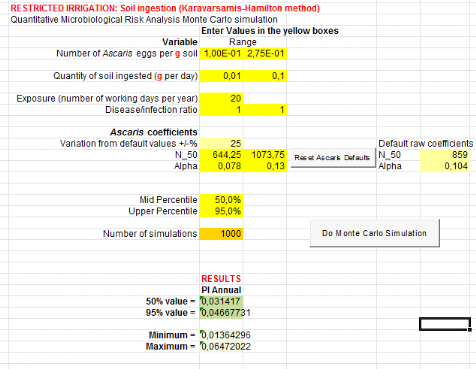
Annex xiii : Calculation of Ascaris
infection risk from soil ingestion of C+U+GW treatment from 20 days
exposure
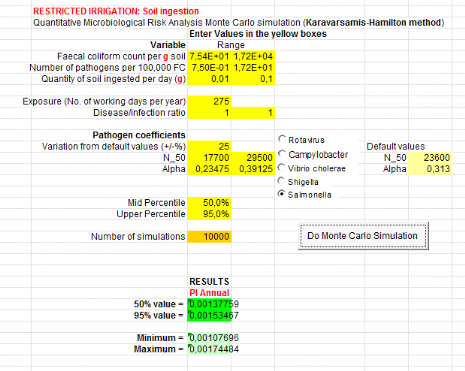
Annex xiv : Calculation of Salmonella
infection risk from soil ingestion of C+U+GW treatment for 275 days
exposure
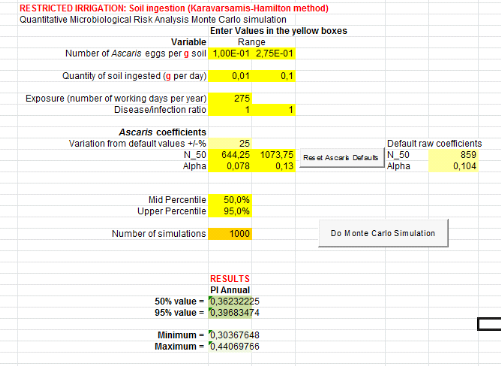
Annex xv: Calculation of Ascaris infection risk
from soil ingestion of C+U+GW treatment from 275 days exposure
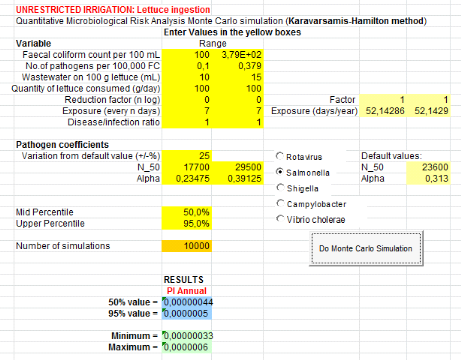
Annex xvi : Calculation of Salmonella
infection risk from lettuce consumption of C+U+GW treatment
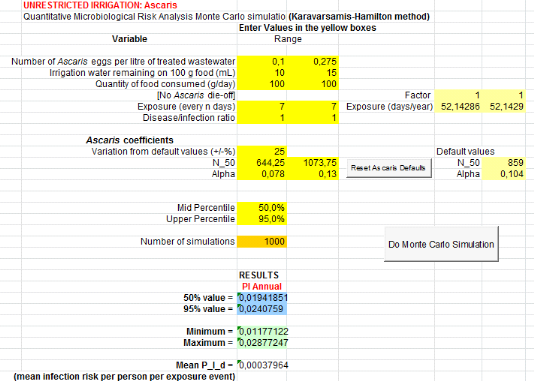
Annex xvii : Calculation of Ascaris
infection risk from lettuce consumption of C+U+GW treatment
Annex xviii : Besoins en eau de la laitue
Annex xix : Initial amount of indicators and
pathogens in urine and greywater
|
Matrix
|
|
Indicators/Pathogens
|
Urine
|
Greywater
|
|
E.coli
(log10CFU/100mL)
|
0
|
4.73#177;1.73
|
|
Fecal coliforms
(log10CFU/100mL)
|
5.12#177;0.71
|
5.35#177;1.4
|
|
Enterococci(log10CFU/100mL)
|
4.00#177;0.41
|
4.42#177;1.63
|
|
Salmonella(log10
MPN/100mL)
|
3.95 #177;2.27
|
156.63#177;199.80
|
|
Ascaris(eggs/L)
|
0
|
0
|
Annex xx: Initial amount of indicators and pathogens in
compost and soil
|
Matrix
|
|
Indicators/Pathogens
|
Compost
|
Soil
|
|
E.coli
(log10CFU/gDW)
|
4.21 #177;3.53
|
2.10 #177;2.20
|
|
Fecal coliforms
(log10CFU/gDW)
|
4.40 #177;3.55
|
0
|
|
Enterococci
(log10CFU/gDW)
|
5.82 #177;4.32
|
0
|
|
Salmonella
(log10MPN/g DW)
|
3.31
|
0
|
|
Ascaris(eggs/gDW)
|
27
|
0
|
| 

