Télédétection du manteau neigeux et modélisation de la contribution des eaux de fonte des neiges aux débits des oueds du haut atlas de Marrakech( Télécharger le fichier original )par Abdelghani Boudhar Université Cadi Ayyad - Doctorat National 2009 |

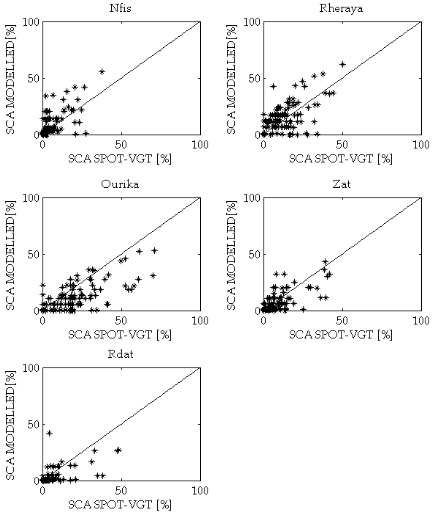
VI.4.3 Comparison between simulated and observed SCA on the days of satellite acquisitionFigure ýVI illustrates an example of SPOT-VEGETATION and modelled snow-cover maps for four selected dates in the Rheraya sub-catchment. There is a large consistency in spatial patterns of snow area between these two SCA estimates. In Figure ýVI , scatter plots of SCA values derived from SPOT-VEGETATION and generated with the degree day method in all sub-catchments are shown for the period 2002-2005. The difference between the two snow products is quantified in Table ýVI using the correlation coefficient (R²), the root mean squared error (RMSE) and the Bias. Although there is a large scatter in Figure ýVI , there is little bias between observed and simulated SCA estimates for all sub-catchments, except the Ourika watershed which exhibits a small underestimation of SCA by the model (bias= -9%). Globally, there is a good correlation between the two snow cover products in all sub-catchments with an exception in the season 2002 when the SCA are poorly correlated. During that year, drier than usual, maximum SCA is rather small (8, 35, 40, 25 and 18 % of the total area in Nfis, Rheraya, Ourika, Zat and R'Dat, respectively).
Figure ýVI-: Examples of snow maps derived from SPOT-VEGETATION (left), represented by gray levels (black: 0% SCA to white: 100% SCA), and simulated using the degree day method (right), binary product (white: Snow; black: no snow)
Figure ýVI-: Comparison between the snow cover area calculated from SPOT- VEGETATION and that simulated by the degree day method in five sub-catchments from 2002 to 2005.
Table ýVI-: statistics of the simulated vs. remote sensing SCA estimates comparison for each year and each subcatchment. |
|