Télédétection du manteau neigeux et modélisation de la contribution des eaux de fonte des neiges aux débits des oueds du haut atlas de Marrakech( Télécharger le fichier original )par Abdelghani Boudhar Université Cadi Ayyad - Doctorat National 2009 |

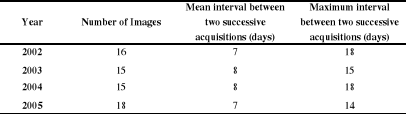
VI.3 Hydro-meteorological dataIn addition to daily snow cover area (SCA), daily estimates of air temperature and precipitation are needed to run the SRM for each altitudinal band. These data were obtained from meteorological stations inside or around the five sub-catchments ( Figure ýII ). For this study, daily average air temperature data recorded at the Oukaimden (2760 m) and Sâada (411 m) weather stations over the period (1998-2005) were used to calculate a global mean lapse rate of 0.56°C/100m. Mean daily temperature at each elevation zone is then obtained from the Oukaimden station data using this constant lapse rate. To determine zonal daily precipitation, the average daily precipitation from all the available stations was assigned to the elevation band corresponding to the mean altitude of all climate stations. Daily precipitation was then extrapolated from this reference elevation band to all surrounding bands with an average observed elevation gradient of 0.03 mm/100m. The later was calculated from 1990 to 2006 between two stations: Marrakech (450m) and Oukaimden (2600m). Daily runoff measurements were collected at the sub catchments outlet stations by the regional water agency (Agence du Bassin Hydraulique de Tensift). These data were used to compare the observed and the simulated outlet hydrographs. VI.4 Snow covers mapsVI.4.1 From remote sensing dataSnow cover areas (SCA) maps were available at 1km spatial resolution after our previous work (Boudhar et al., 2007). SCAs maps were established from SPOT-VEGETATION blue and middle infrared (MIR) top-of-atmosphere reflectances (physical product, see Maisongrande et al., 2004), using the modified snow index (Chaponnière et al., 2005). The dates when snow cover maps are available (Table 2) corresponds to cloud-free conditions and limited viewing angles (view zenith angles below 23°). The mean interval between two successive clear sky images is one week, but there are some longer periods without observations. Based on this multitemporal dataset and the DEM, snow cover areas of each elevation zone were successively derived from each SPOT-VEGETATION snow map. Between two successive observations, depletion curves of snow coverage were interpolated at a daily step using a linear model.
Table ýVI-: Availability of SPOT-VEGETATION data and snow-cover estimates during the snowfall/snowmelt period (January to June). VI.4.2 From meteorological dataTo estimate the daily SCA (snow cover area) without satellite data, it is necessary to account for rainfall/snowfall partition (accumulation processes) as well as snow drift, melting and sublimation (ablation processes). For this purpose a relation between SCA and the Snow Water Equivalent (SWE) was derived. The model elements consist of 30-m grid cells. SWE is calculated from mean daily precipitation and mean daily surface air temperature for each grid cell. Precipitation is modelled as snow if the temperature is below 0°C, otherwise precipitation is rain. Snowmelt is calculated according to Makhlouf (1994) through a classical temperature index method described in Rango & Martinec (1995) ( Équation ýVI ): Where Ms is the daily bulk loss of water from the snowpack (mm/unit time) and accounts for all the ablation processes; Td is the mean daily air temperature (°C); T0 is the base temperature (usually, 0°C); and a, the degree-day factor (mm/°C/day). The later was computed with an empirical relationship based on snow () and water () densities classically used in SRM model applications (Martinec, 1960): The degree-day factor is low at the beginning of the season (fresh snow) with a general trend of increase at the end of the season when significant snow transformation and compaction has occurred and the snowpack contains a large proportion of liquid water. In order to provide time-series of snow density estimates, snow height and snow density measurements were carried out from November 2007 to March 2008 at eight locations on the upper plateau of the Oukaimden ski resort at 3200 metres above mean sea level. The resulting degree-day factor was averaged over each month. It varies between 2.5 and 5.0 mm/°C/day from November to March. The same monthly values were used to generate the SCA estimates for 2002-2005. To check whether the empirical formulation ( Équation ýVI ) is realistic for the High Atlas of Morocco, the observed degree-day factor was derived from the 2007-2008 measurement campaign for individual ablation periods. The values ranged from 0.2 (late January) to 4.7 mm/°C/day (late March). Due to the low space-time sampling resolution of those campaigns, we considered that the degree-day factor obtained by Équation ýVI was realistic, and decided to keep this model to generate SWE time-series for each cell. From the daily SWE we estimate a daily SCA using the following empirical relationship ( Équation ýVI ): |
|