Télédétection du manteau neigeux et modélisation de la contribution des eaux de fonte des neiges aux débits des oueds du haut atlas de Marrakech( Télécharger le fichier original )par Abdelghani Boudhar Université Cadi Ayyad - Doctorat National 2009 |

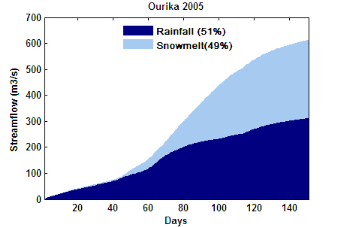
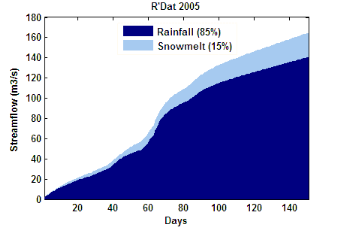
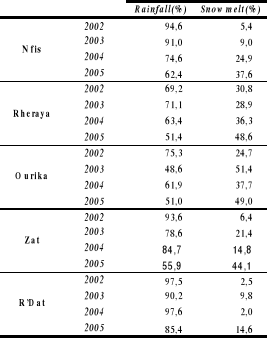
VI.5.4 Snowmelt contribution to streamflowOnce the SRM model is calibrated against streamflow observations, it is interesting to look at the computed meltwater production and thus at the relative contribution of snowmelt to streamflow. In this exercise, the snow extents computed from SPOT-VEGETATION are used. The relative contribution of snowmelt and rainfall are summarized in Table ýVI from 2002 to 2005 for each sub-catchment. Following the interannual and interbasin variability in observed snow cover area, the fractions of snowmelt contributing to streamflow are also variable from one year to the other and from one sub-catchment to another. Except for 2005, where snowmelt contributes significantly in all sub-catchments (varying from 15% in R'Dat to 51% in Ourika), the proportion of snowmelt in the total runoff is more important in the Rheraya and Ourika sub-catchments (up to 38% in 2004), than in the other sub-catchments. Figure ýVI and Figure ýVI illustrate the cumulative curve of the computed daily snowmelt and rainfall proportions to the runoff in two distinct sub-catchements, Ourika and R'Dat, during the 2005 snowfall/snowmelt season. From the satellite imagery, snow can be observed each year above 1400m but persists at altitudes larger than 2600m. According to the area-elevation curve for each sub-catchment ( Figure ýVI ), this represents 18%, 25%, 40%, 13% and 6% of the Nfis, Rheraya, Ourika, Zat and R'Dat sub-catchments respectively. Consequently, as expected, the mean snowmelt contribution is more important in the Ourika and Rheraya sub-catchments than in the Nfis, Zat and R'Dat respectively. Almost the whole snowmelt contribution to runoff occurs in February through May. Globally, from 2002 to 2005, this contribution is 25% on average.
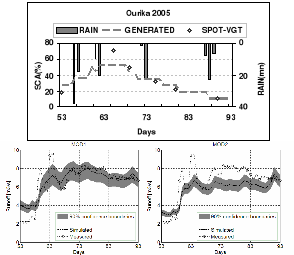
Figure ýVI-: Cumulative curves of snowmelt and rainfall contributions to streamflow in the Ourika sub-catchment for 2005 snowfall/snowmelt season.
Figure ýVI-: Cumulative curves of snowmelt and rainfall contributions to streamflow in the R'Dat sub-catchment for 2005 snowfall/snowmelt season.
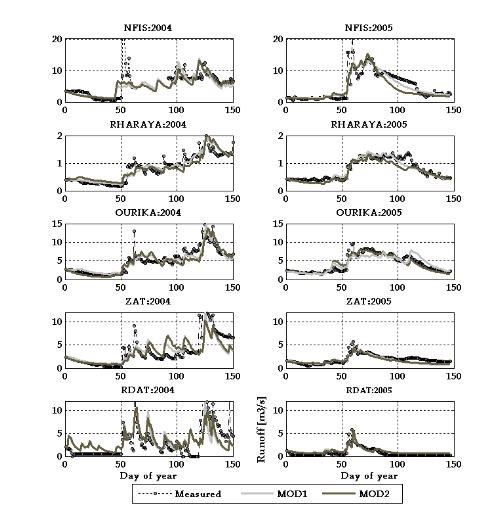
Table ýVI-: Relative contribution of snowmelt and rainfall to streamflows VI.5.5 Model validationThe model validation was conducted in the snowmelt season from 2002 to 2004 in the five sub catchments using representative SRM parameter values adopted at the calibration test. Figure ýVI illustrates the daily runoff simulations using the two snow products MOD1 and MOD2, along with measured discharges, and Table ýVI summarizes the simulation result statistics for fives sub-catchments. At seasonal scale, the streamflow simulations using the two snow products are comparable. The model efficiency with the two snow cover area estimates varies widely from one year to the other and a basin to another, reflecting the variation in climatic and topographic conditions of the region. In decreasing order, without taking into account the year 2003 when the model efficiency is very low for all sub-catchments, the streamflow simulations with MOD1 are good in Ourika and Rheraya (E>0.72), acceptable in Zat (E> 0.50) where snowmelt is significantly contributing to runoff but poor in Nfis and RDat (E> 0.24). With MOD2, the model shows a good efficiency in 2004 (E> 0.72), acceptable in 2002 (E=0.54) and poor in 2003. However, in the other sub-catchments, the performance of the model is acceptable for 2002 (E>0.47) and lower in 2003 and 2004. The simulated average peak discharge was often lower than observed (example, peak after Day 60, in 2004, cf. Figure ýVI ). This can be explained by the local intense rainfall events that are not captured by the available raingauges. During recessions, the streamflow simulations are acceptable in all sub-catchments. The inability of the model to simulate the daily runoff in Nfis, Rdat and Zat sub-catchments might be due to several factors. First, the spatio-temporal variability of the rainfall could not be captured with the available network. Local intense rainfall events occur mostly during the summer; however, patchy rainfall events during the winter might explain the poor prediction performance of peakflow discharge. This poor performance could be due to the model itself and has been reported in many other studies (Songweon et al. 2005 and Xingong L. & Mark W.W. (2008)). Second, streamflow measurement is a difficult task in the wadi bed: the gauging frequency (once a month on average) is not always adjusted for quickflow (high flow) occurrence, and wadi beds often undergo drastic modifications after a storm, preventing discharge measurement when the scale is isolated or when the charge-discharge rating curve is no longer valid. This may cause that runoff peaks are missed. This problem is less tricky during recessions and low flow with more stable daily runoff. Third, the runoff generation mechanisms during intense rainfall events in such area, where stream flow tends to be dominated by rapid responses, are too complex for this relatively simple conceptual model. Fourth, in a semi arid area, water losses via evapotranspiration for the vegetation and via sublimation for snow are important, but they are perhaps not properly taken into account by a simple conceptual model such as SRM. On the southern slopes of the High Atlas, Schulz et De Jong (2004) found with an energy balance model that on average 44% of snow ablation was attributed to sublimation, and snow penitents were observed. Finally, the mechanisms of groundwater redistribution are also unrecognizable and are difficult to be modelled (Duclaux, 2005, Chaponnière et al., 2008).
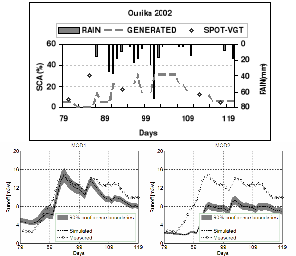
Figure ýVI-: Simulated and observed streamflows for the calibration and validation periods in the fives sub-catchments. Finally, and more importantly, it must be stressed that if the performance at the seasonal scale is satisfying for both SCA estimation methods MOD1 and MOD2, significant differences can be observed for selected storm/interstorm events. This occurs when the raingauge network is too sparse to catch all precipitation events or when errors in temperature estimates affect the rainfall/snowfall partition. In both cases the Remote Sensing method improves the short term streamflow prediction. Figure ýVI and Figure ýVI , illustrate these two cases of streamflow underestimation with MOD2, in the Ourika sub-catchment: the first one from days 80 to 90 in 2002 ( Figure ýVI ), due to missing rainfall events in the higher altitudes. In this period, the large SCA difference (about 30%) translates into 20% of streamflow difference that remains up to three weeks. The second case represents an underestimation of the SCA with MOD2 from day 63 to 69 in 2005, certainly due to an incorrect temperature lapse rate. Because of the low redistribution of snowmelt process, the difference of SCA during one week has an influence on streamflow for about 3 weeks.
Figure ýVI-: Example of underestimation of streamflow by MOD2 when a rainfall event occurs only in the ungauged upper part of the Ourika subcatchment in 2002.
Figure ýVI-: Example of underestimation of streamflow by MOD2 caused by an underestimation of the SCA generated by the degree day model in the Ourika subcatchment in 2005. |
|