Article 13 :
IPSILATERAL ABR WITH COCHLEAR IMPLANT
S. Gallégo, C. Micheyl, C. Berger-Vachon, E. Truy, A.
Morgon, L. Collet
Acta Otolaryngol (Stockh)
1996, 116, 228-233
L'objectif de cette pré-étude était de
mettre au point un protocole d'enregistrement, de stimulation, de traitement et
d'analyse des recueils de PEAEP.
Elle a permis de démontrer qu'il était possible
d'obtenir des PEAEP de relativement bonne qualité chez plusieurs
patients, à différents niveaux d'intensité, sur
différentes zones de stimulation de la cochlée. Les ondes II, III
et V sont très distinctes,
Elle a mis en évidence les faibles variations des
latences des ondes en fonction de la zone et de l'intensité de
stimulation. Cela peut s'expliquer, comparer à un PEAP par stimulation
acoustique, par le shunt de la biomécanique cochléaire. Seules
les amplitudes des ondes ainsi que des mesures de reproductibilité sont
dépendantes de la zone et de l'intensité de stimulation.
Acta Otolaryngol (Stockh) 1996; 116: 228-233
Ipsilateral ABR with Cochlear Implant
S. GALLEGO,' C. MICHEYL,' C. BERGER-VACHON,' E. TRUY,2
A. MORGON2 and L. COLLET'
From 'CNRS URA 1447, and 2Department of
Otorhinolaryngology, Edouard Herriot Hospital U, Lyon, France
Gallégo S, Micheyl C, Berger-Vachon C, Truy E,
Morgon A, Collet L. Ipsilateral ABR with cochlear implant.
Acta Otolaryngol (Stockh) 1996; 116: 228-233.
Ipsilateral ABR recording technique was developed with the MXM
DIGISONIC DX10 cochlear implant, involving, firstly, setting of recording
variables with regard to implant and ABR constraints, and, secondly,
enhancement of recording quality by signal processing. The resulting recording
quality then enabled us to characterize ABR latency, amplitude and wave
reproductibility according to stimulus intensity and stimulation site
(electrode stimulated). The findings agree with those of the literature on
contralateral human and ipsilateral animal studies. Waves III and V amplitude
increased with stimulus intensity. Waves III and V latency was insensitive to
stimulus intensity or site. ABR quality diminished basally. Key words: ABR,
cochlear implant, electrical stimulation, human, ipsilateral, wave
characteristics.
ABR recording
The electrical stimulus used to evoke ABRs was generated using
an MXMe DIGISTIM system connected to a PC computer via a serial port. ABR
recording was performed using a NICOLET® PATHFINDER II. This system
requires the fitting of 3 electrodes (one reference electrode, one anode and
one cathode). The PATHFINDER was triggered externally by the DIGISTIM.
The following recording variables were determined after many
preliminary trials, using a cochlear implant model and also taking into account
electrophysiological constraints: 3 averagings of 256 sweeps; 100 /AT
sensitivity; analog bandpass filtering from 0.28,000 Hz; 10 ms analysis
time, 512 point window; 50 kHz sampling frequency.
ABR processing
After recording, ABR signals were processed using different
processing stages. First of all, the first 400 fis of the ABR signal were
excluded so as to eliminate stimulus artefact. Then, the signal was filtered
with a digital bandpass of 300-3,000 Hz.
The 3 x 3 intercorrelation matrix was then computed in order
to eliminate the most exceptional curves. Finally, the remaining curves were
summed and, using an algorithm based on the detection of peaks and infiection
points in the signal (5), wave amplitude and latencies were determined. Wave
amplitudes were determined on the basis of the length of the wave duration
(6).
RESULTS
Characterization of ABRs as a function of stimulation
intensity
Fig. 1 shows typical ABR traces recorded from one
electrode
in one patient (SC). The traces were
INTRODUCTION
The recording of ABRs is far more difficult to perform in
cochlear implant patients than in non-implanted persons. The amplitude of the
electrical stimulation, which is about 10,000,000 times greater than that of
the ABR signal, causes saturation of the amplifier. One means of reducing the
stimulation artefact consists of contralateral recording: ABRs are recorded in
the opposite ear (1). However, another solution could reside in the
determination of optimum stimulation variables, which would allow considerable
reduction in stimulus amplitude, duration, and leakage across the scalp.
The first aim of the present study was to establish the
feasibility of ipsilateral ABR recording; then, once the technique was ready,
to elaborate a signal processing technique allowing good-quality ABRs; and
finally, to characterize ABRs as a function of 2 variable-stimulation intensity
(2) and electrode position (tonotopy) (3).
MATERIAL AND METHODS
Subjects
Three patients implanted with an MXIVI' DIGISONIC DX10
participated in the study. This cochlear implant is a non-conventional auditory
prosthesis composed of 15 electrodes (4), the function of which is to replace
the peripheral part of the auditory system. These electrodes stimulate the
ganglion of Corti and elicit auditory sensations.
X-ray photographe revealed that electrode positioning was
roughly the same across patients. Thus, it could be considered that stimulation
of a given electrode excited roughly the same frequency region from one patient
to another.
General patient characteristics are given in Table I.
(c) 1996 Scandinavian University Press. ISSN
0001-6489
Table I. Patient characteristics
`Performance' is percentage recognition on a Lafon word-list (17
words of 3 phonemes each) by lip-reading plus cochlear implant
|
Deafness
|
Implantation
|
|
Performance
|
|
Patient
|
etiology
|
duration
|
Age
|
(LR + CI)
|
|
BO
|
Accidentai
|
6 months
|
64 years
|
76%
|
|
LE
|
Evolutionary
|
3 months
|
60 years
|
88%
|
|
SC
|
Accidentai
|
12 months
|
44 years
|
82%
|
recorded at 16 different stimulation levels linearly
decreasing from a maximum (80 in arbitrary units determined by the equipment
i.e. 0.104 p C/cycle) to 0. The maximum was set just below discomfort
level.
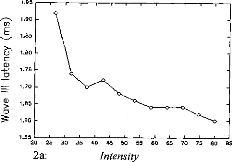
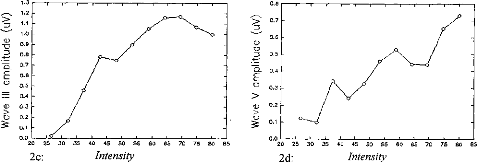
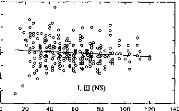
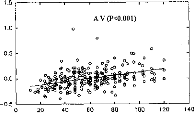
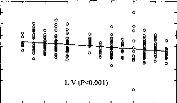
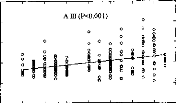
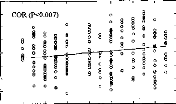
Fig. 2 shows the latency and amplitude of waves III and V as a
function of stimulation intensity. In each patient, ABRs were recorded for 6 to
9 different electrodes. Because of the large amount of data-- about 50
matrices, as shown in Fig. 2 --findings were clustered by patient. The
relationships between stimulation intensity and main ABR characteristics
(latency, amplitude and reproducibility) were studied using linear regression.
The results of regression analyses (mean, slope, correlation coefficient and
signifiance level) are shown in Table II.
In order to compare ABR characteristics between patients, data
were then normalized and a regression analysis was performed, the results of
which are represented by the scatter plots in Fig. 4a and also given in Table
II.
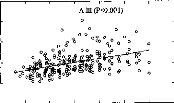
Characterization of ABRs as a function of electrode position
(tonotopy)
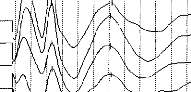
Fig. 3 shows typical ABR traces obtained from 9 electrodes in
one patient (SC). The electrodes were numbered 1-15, basally to apically. Each
curve was obtained by averaging about 8,000 traces. Relationships between
electrode number and ABR characteristics were studied by means of regression
analyses performed on the data clustered by electrode number. As in the
previous section, data were then normalized and averaged across patients and
regression variables were computed. The obtained relationships are shown in
Fig. 4b and the corresponding variables are given in Table II.
DISCUSSION
The results obtained in this study demonstrate
the
possibility of recording ipsilateral ABRs on a coch-
lear implant
(MXM DX10). The good quality of the
? ? 1 t I 1 1 t I I ? 1 `,"!?
·
14
15
16
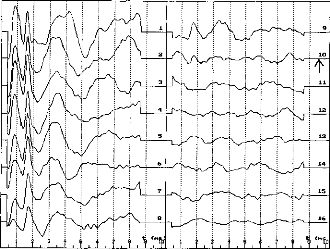
Fig. 1. Ipsilateral ABRs from electrode 14 in patient
SC for 16 decreasing intensity levels. (The arrow on curve 10 shows
patient's subjective threshold).
Table II. ABR variable data according to stimulus intensity
and electrode number (position), per patient and average
|
Variable
|
Patient
|
Mean
|
S.D.
|
Variation according to intensity
|
|
Variation according to electrode number
|
|
Slope
|
n
|
R
|
p
|
Slope
|
n
|
R
|
p
|
|
L III (ms)
|
BO
|
1.90
|
0.0899
|
2.60E-4
|
68
|
0.059
|
NS
|
3.85E-3
|
68
|
0.184
|
NS
|
|
L III (ms)
|
LE
|
2.30
|
0.117
|
8.40E-4
|
68
|
0.184
|
NS
|
-8.00E-3
|
68
|
0.285
|
<0.02
|
|
L III (ms)
|
SC
|
1.69
|
0.0905
|
-1.62E-3
|
108
|
0.455
|
<0.001
|
7.30E-4
|
108
|
0.030
|
NS
|
|
L III (ms)
|
Total
|
1.96
|
0.0966
|
-4.90E-4
|
244
|
0.123
|
NS
|
-7.40E-4
|
244
|
0.030
|
NS
|
|
L V (ms)
|
BO
|
3.86
|
0.176
|
-1.16E-3
|
68
|
0.133
|
NS
|
-0.0231
|
68
|
0.563
|
<0.001
|
|
L V (ms)
|
LE
|
4.15
|
0.190
|
-1.58E-3
|
68
|
0.206
|
NS
|
-0.0130
|
68
|
0.275
|
<0.03
|
|
L V (ms)
|
SC
|
3.74
|
0.128
|
-9.50E-4
|
108
|
0.190
|
<0.05
|
-5.59E-3
|
108
|
0.162
|
NS
|
|
L V (ms)
|
Total
|
3.91
|
0.161
|
-1.12E-3
|
244
|
0.171
|
<0.01
|
-0.0133
|
244
|
0.329
|
<0.001
|
|
A III (pV)
|
BO
|
0.362
|
0.152
|
3.89E-3
|
67
|
0.509
|
<0.001
|
0.0150
|
67
|
0.419
|
<0.001
|
|
A III (pV)
|
LE
|
0.375
|
0.232
|
3.87E-3
|
68
|
0.411
|
<0.001
|
0.0165
|
68
|
0.285
|
<0.02
|
|
A III (pV)
|
SC
|
0.483
|
0.337
|
6.34E-3
|
106
|
0.475
|
<0.001
|
0.0437
|
106
|
0.484
|
<0.001
|
|
AIII (pV)
|
Total
|
0.407
|
0.2668
|
4.83E-3
|
241
|
0.440
|
<0.001
|
0.0266
|
241
|
0.394
|
<0.001
|
|
A V (pV)
|
BO
|
0.312
|
0.149
|
2.49E-3
|
66
|
0.334
|
<0.01
|
0.0117
|
66
|
0.341
|
<0.01
|
|
A V (pV)
|
LE
|
0.440
|
0.238
|
-3.70E-3
|
68
|
0.385
|
<0.001
|
0.0136
|
68
|
0.229
|
0.060
|
|
A V (pV)
|
SC
|
0.326
|
0.178
|
-3.38E-3
|
107
|
0.488
|
<0.001
|
0.0202
|
107
|
0.423
|
<0.001
|
|
AV (pV)
|
Total
|
0.359
|
0.189
|
3.14E-3
|
240
|
0.409
|
<0.001
|
0.0153
|
240
|
0.322
|
<0.001
|
|
COR (%)
|
BO
|
26.7
|
29.4
|
0.769
|
68
|
0.527
|
<0.001
|
0.954
|
68
|
0.139
|
NS
|
|
COR (%)
|
LE
|
27.6
|
30.0
|
0.802
|
65
|
0.649
|
<0.001
|
-0.521
|
65
|
0.067
|
NS
|
|
COR (%)
|
SC
|
30.9
|
28.6
|
0.399
|
109
|
0.360
|
<0.001
|
2.71
|
109
|
0.355
|
<0.001
|
|
COR (%)
|
Total
|
28.4
|
29.1
|
0.551
|
242
|
0.464
|
<0.001
|
1.28
|
242
|
0.173
|
0.007
|
1.60
1.55
20 25
2a:
.30 35 40 45 50 55
Intensity
60 65 70 75 80 135
1.95
.."-^s. 1.90
1.85
m 1.80
· 1.05
E
Q)
Q)
o
4.00 3.95 3.90 3.85 3.80 3.75 3.70 3.65 3.60 3.55 3.50 3.45
3.40
20
25 30 35 40 45 50 55 60 65 70 75 80 B5
2b: Intensity
0.8
0.7
D
0.6
0)
M 0.5
0.4
E
0 0.3
Q) 0.2
(1) 0.3
0.1
0.0
25
30 35
45 50 55 60 65
B5
B5
75 80
65 70
60
50 55
40
45
35
30
25
20
80
70 75
Intensity
2d:
1.0
0.9
D 0.8
Cl 0.7
0.6
Cs 0.5
- 0.4
0.2
0.1
0.0
20
2c:
40
Intensity
Fig. 2. Wave III and V latency [(a) and
(6), respectively] and amplitude [(c) and (d,
respectively] variation according to stimulus intensity in electrode 14 in
patient SC (intensity in arbitrary equipment-determined units).
Acta Otolaryngol (Stockh) 116 Ipsilateral ABR with cochlear
implant 231
II
V
Electrode 14
Electrode 13
Electrode 11
Electrode 10
Electrode 9 Electrode 6 Electrode 5 Electrode
4
Electrode 3
t Cns)IF
Fig. 3. Average ABR from 9 electrodes in patients SC
(electrode 3 being the most basal, electrode 14 the most apical).
recordings allowed precise measurement of wave III and V
amplitude and latency. Thus, these characteristics were able to be
characterized as a function of stimulation intensity and electrode number.
The validity of the present results can be assessed by
comparing them to those obtained using acoustic stimulation in normally-hearing
patients. Although a direct comparison between wave latencies is impossible,
due to the fact that the cochlear filtering stage no longer exists in cochlear
implant patients, relative latencies can be compared. The differences between
wave III and V latencies obtained in this study (1.95 for patient BO, 1.84 for
LE and 2.05 for SC) were within the limits usually obtained using acoustical
ABRs in normally-hearing subjects (1.85-2.15 ms (7)). Another correspondence
between acoustic and electrical ABRs consisted in the fact that ABRs vanished
at a stimulation level corresponding to the behavioral threshold.
The relationships observed in the present study between
stimulation level and ABR amplitude and latency are in agreement with the data
from previous studies (8, 2, 9). Wave III and V amplitudes increased with
stimulation level (the correlation was highly significant).
Wave III and V latencies remained more or less constant for
low to moderate intensities and then increased when the stimulation intensity
reached threshold (from 0 to 80, about 60 ps for wave III and 195 for wave V).
Crosscorrelation increased with stimulation intensity.
The relationships observed between electrode position and ABR
amplitude and latency are also in
agreement with the data from previous studies (10,
11, 3). The more apical the site, the greater the amplitude and
reproducibility of waves III and V,
and the smaller the latencies (10 ps for wave III latency, 200 ps
for wave V latency).
CONCLUSION
The results of the present study are of relevance not
only
to physiologists but also to audiologists regard-
ing objective assessment of auditory performances in
the
cochlear implanted. These results merit further
investigation in a larger number of patients in order
to
obtain a reliable database. There is here a possible
basis for an objective method of threshold setting in children
(12).
ACKNOWLEDGMENTS
The authors wish to thank those people and institutions that
have supported this study: the MXM company, the Hospices Civils of Lyon, the
CNRS, the University of Lyon, the three patients.
REFERENCES
1. Pelizzone M, Kasper A, Montandon P. Electrically evoked
responses in cochlear implant patients. Audiology 1989; 28: 230-8.
2. Abbas PJ, Brown CJ. Electrically evoked auditory brainstem
response: growth of response with current level. Hear Res 1991; 51: 123-38.
3. Miller CA, Abbas PJ, Brown CJ. Electrically evoked
auditory brainstem response to stimulation of different sites in the cochlea.
Hear Res 1993; 66: 130-42.
80 60 40 20
-20
-40
- 60
-80
4a:
Intensity
Fig. 4. Variation in wave III and V latency and
amplitude and in ABR correlations according to stimulus intensity (a)
and electrode number (position) (b).
232 S. Gallego et al.

0.8
0.6
0.4 o o °
00o m0 o o
Its
0.2
0.0
06.
-0.2 8 og c
· ocPo o
L V (P<0.01)
20 40 60 80 100 120 140
Intensity
-0.4
-0.6
-0.8
- 1.0
0
20
40
60 80
100
120
140
0.4 0.3 0.2 0.1 0.0
- 0.1 -0.2
- 0.3 -0.4
Intensity
1.5 1.0 0.5 0.0
- 0.5
0
140
Intensity
1.5 1.0 0.5 0.0 -0.5
- 1.0 0 20 40 60 80 100 120 140
Intensity
|
- COR (P<0.001) °
0 o ° e° 008
0 ° 8 S'86'. oo %
co 00 e
8 o 1000 o
c, §o8
FL
0°0°0°0 °
e0eg°Ir:0°
·
° 0qp
0 0 ° e ° °
o
|
20 40 60 80 100 120 140
Acta Otolaryngol (Stockh) 116

2 4 6 8 10 12 14 16
Electrode number
0.8 0.6 0.4 0.2 0.0
- 0.2 -0.4
- 0.6
- 0.8
-1.0
0
o
0
0
§
o
o 0
o
0
0
0
o
o
8
o
î
ff
g
o
8
0
o
o
L (NS)
0.4
0.3 -
0.2 - 0.1 - 0.0 - -0.1 - -0.2 - -0.3 - -0.4
2 4 6 8 10 12 14 16
Electrode number
1.5
A V (P<0.001)
o
o
Electrode number
2 4 6 8 10 12 14 16
1.0
0.5
0.0
-0.5
0 2
1.5 1.0 0.5 0.0
- 0.5
- 1.0
4 6
s
0
8 10 12 14 16

Electrode number
2 4 6 8 10 12 14 16
4b: Electrode number
4. Beliaeff M, Dubus P, Leveau JM, Repetto JC, Vincent P.
Sound processing and stimulation coding of DIGISONIC DX10 15-channel cochlear
implant. In Hochmair, ed. Advances in cochlear implant. 1994; 198 --203.
5. Boston JR. Automated interpretation of brainstem auditory
evoked potentials: a prototype system. IEEE Trans Biomed Eng 1989; 36:
528-32.
6. Gallégo S, Berger-Vachon C, Potier F, Truy E,
Collet
L. Automatic diagnosis of electrical BERA using the MXM DX10
cochlear implant. 3rd Paris Int. Congress on Cochlear Implant. Abstracts Book,
1995; 140.
7. Guerit JM. Les potentiels évoqués. Paris:
Masson, 1993; 102-16.
8. Abbas PJ, Brown CJ. Electrically evoked auditory brainstem
potentials in cochlear implant patients with multi-electrode stimulation. Hear
Res 1988; 36: 15362.
9. Allum JHJ, Shallop JK, Hotz M, Pafaltz CR. Characteristics
of electrically evoked auditory Brainstem re-
sponses elicited with 22-electrode intracochlear implant. Scand
Audiol 1990; 19: 263-7.
10. Kasper A, Pelizzone M, Montandon P. Electrically evoked
auditory brainstem responses in cochlear implant patients. ORL 1992; 54:
285-94.
11. Kasper A, Pelizzone M, Montandon P. Intracochlear
potential distribution with intracochlear and extracochlear electrical
stimulation in humans. Ann Otol Rhinol Laryngol 1991; 100: 812-6.
12. Shallop JK. Objective electrophys from cochlear implant. Ear
Hear 1993; 14: 58-63.
Address for correspondence: S. Gallégo
Hôpital Edouard Herriot Pavillon U
URA CNRS 1447
3 Place d'Arsonval
F-69437 Lyon Cedex 03 France
Fax: +33 72 11 05 34.
g/ Le filtrage numérique adapté au PEAEP
:
L'utilisation des filtrages numériques post-traitement
permettent d'améliorer considérablement les PEAP lors d'une
stimulation acoustique (Grônfors, 1994). Dans le cas d'une stimulation
électrique, ces filtrages spéciaux ne peuvent pas être
utilisés car les artefacts dus à la stimulation électrique
viennent détériorer le tracé. Comme le montre la figure
93, certaines fois, il n'est pas nécessaire d'utiliser un
post-traitement des tracés. Cela n'est malheureusement pas toujours le
cas. Afin d'utiliser les PEAEP pour la clinique et particulièrement pour
le réglage de l'implant cochléaire, la qualité des
tracés doit être suffisante et stable pour que l'on puisse en
extraire les latences et amplitudes des ondes, même celles très
précoces.
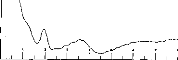
Figure 93 : Exemple de PEAEP sans
post-traitement
Pour cela, nous avons développé un traitement des
courbes adapté aux contraintes de la stimulation électrique lors
du recueil des PEAEP.
| 

