Article 14 :
DIGITAL TIME-VARIANT FILTERS ADAPTED FOR RECORDING OF
ELLECTRICALLY AUDITORY
BRAINSTEM RESPONSES (E-ABR)
S. Gallégo, J Durrant, L. Collet, C Berger
Vachon
Article soumis
L'objectif de cet article est de faire une revue étendue
des différents types de traitement numérique des PEAP et
d'essayer de comprendre leur principe.
L'article décrit ensuite, à partir de
modèles de conduction nerveuse, un nouveau type de filtrage où la
fonction de transfert varie avec la latence. En effet, le spectre des PEAEP et
/ ou PEAP devient de plus en plus grave en fonction de la latence.
Cette nouvelle technique de filtrage tout d'abord
simulée sur des modèles de PEAEP bruités puis sur des
PEAEP physiologiques a montré une très bonne robustesse vis
à vis de différent types de bruits qui viennent se superposer aux
tracés:
- Bruit aléatoire ayant un spectre large,
- Bruit électrique correspondant à des artefacts et
dérives sur les tracés,
- Bruit biologique spécifique correspondant à des
réponses non-auditives dues à la stimulation électrique
(vestibule, muscle, nerf facial).
Pour finir l'article montre que les caractéristiques des
PEAEP après traitement numérique ne sont pas différentes
de celles publiées par d'autres auteurs sans ce type de filtre.
DIGITAL TIME-VARIANT FILTERS ADAPTED FOR RECORDING
OF
ELECTRICALLY AUDITORY BRAINSTEM RESPONSES (E-ABR).
S Gallégol'2, J Durrant1,3, L
Collet1,4, C Berger-Vachon1
1- UPRESA 5020 CNRS Laboratory
2- MXM Laboratory
3- University of Pittsburgh
4- ORL dpt, Pav. U, Hôpital E. Herriot
ABSTRACT : The electrically evoked auditory
brainstem response (EABR) is useful in objectively measuring the auditory
system's response to stimulation via cochlear implant. However, the observed
waveform typically is distorted by the electric artifact produced by the
implant and other nonauditory signais (i. e. myogenic and vestibular). This
paper describes a digital, time-variant filter designed specifically for
surface-recorded electrical activity of the hearing system's afferent pathways,
specifically under conditions of electrical stimulation. It thus was our
objective to improve the quality of EABRs. The transfer function varies along
the time continuum, in deference to nuances of neural propagation along a chain
of neurons (i.e. the afferent pathway). Simulation showed that this function
can extract EABRs in a noisy environment, that is with signal-to-noise ratio
(SNRs) of less than -36 dB and facilitate measurement of wave latencies under
such noisy conditions. lndeed, we demonstrate detection component wave without
significant temporal distortion (i.e. latency shifts) after filtering of noisy
EABRs of SNRs down to --24 dB. Such filtering also can reduce substantially
both electrical artifact and non-auditory waves of the EABR. Use of this filter
under real recording conditions permitted us to measure reliably latencies and
interpeak intervals for waves II, III, and V, and observed values compared
favourably with data of other authors. We were able to record and measure EABRs
even with the most basal electrodes. No significant differences were found
according to electrode number.
Key words: EABR, Digital filtering, Signal Noise
Ratio
INTRODUCTION
The auditory brainstem response (ABR) (Sohmer and Feinmesser,
1967 ; Jewett and Williston, 1971) is well-known and routine in clinical
assessments of the auditory system. It is used to assess quickly the
functioning state of the afferent auditory system, namely from the cochlea
through the pontine brain-stem pathways. ABR via acoustical stimulation has
been known for at least 25 years (Jewett and Williston, 1971). However,
interest in electrically-stimulated auditory responses also is long- standing
and was fuelled further by the development of the cochlear implant (House et
al., 1976; Michelson, 1971; Simmons, 1966; Starr and Brackman, 1979). Use of
the EABR to facilitate adjustment of cochlear implant, namely by measurement of
the functional status of the auditory system (characterization of EABR I/O
functions) and estimation of the threshold level (TL) (measure of apearance of
EABR), is of interest. In general, it permits objective measures to be used in
cases where subjective responses would be doubtful. However, recording of
electrically evoked responses tend to be plagued with electrical stimulus
artifact and with responses from nonauditory systems stimulated by the spread
of current from the implanted device.
Because the ABR is minute of signal (sub-microvolt range), it
is, in general, vulnerable to interference from a variety of signais and/or
noise, both physical and physiological. Much work has been dedicated to the
processing of acoustically stimulated ABR to minimize the effects of such
interference. For example stimulation using alternating polarity clicks helps
the suppression of microphonic potentiel and stimulation artifact. Analog
filtering following the differential preamplifiers stage of the bioelectric
amplifier decreases noise in the recording. Digital filters can improve greatly
the signal-to-noise ratio of the ABR (Fridman et al., 1982; Urbach and Pratt,
1986; Pratt et al., 1989; Grônfors et al., 1992,1993) with the advantage
of zero phase-shift (Boston and Ainslie,1980). These or comparable approaches
to the processing of the EABR, however, have been much less successful.
That interference from electrical stimulus artifact is a
considerable problem and is readily appreciated from the fact that it can be
over a million-fold greater than the ABR itself. Thus, great care must be taken
to avoid saturation of amplifier input and ringing of the analog filter at the
preamplification stage. The stimulus artifact also can
last a relatively long time (i.e. up to several milliseconds).
Most cochlear implants utilize inductive coupling and the transmission of
information from the external device to the implanted package, namely via, a
pulse-modulated carrier wave.
Interference from nonauditory signais may arise from several
possible sources. Aside from the common source (e.q. electroencephalogram and
electrocardiogram), the current may spread to the facial nerve and cause strong
interference by myogenic potentiels. There also is the possibility of
stimulating the vestibular apparatus and evoking a response from this
system.
Techniques used for conventional ABR measurement are less
effective with the EABR. The typical analog filtering (100-3000 Hz; -3dB,
RC/passive) cannot be used as the artifact actually is prolonged, particularly
if the high-frequency cut-off frequency is too low or the low-frequency cut-off
frequency is too high. With the EABR, the input analog fiiter ideally should
have a wide bandpass (Van den Honert and Stypulkowski, 1986). Digital filtering
used for the acoustical ABR also cannot be used, due to the shift in the EABR,
namely toward shorter latencies by virtue of the elimination of sound- and
hydromechanical-wave propagation and synaptic delays in the auditory periphery.
This can cause dramatic distortions, especially during the first milliseconds
of the analysis window.
To avert these problems, several techniques can be used. It is
possible to put an analog fiiter in the front end of the differential
amplifiers (Clarke et al., 1990) to attenuate the electromagnetic interference
coming from the transmission of information through the skin, from the external
device. If the signal is by-passed during the first milliseconds of a recording
(so-called 'blanking') it also is possible to avoid the saturation of the head
differential amplifiers. Of course, the waves occurring simuitaneously with the
artifact are lost. Techniques based on the subtraction of a model of the
artifact, or taking into account the shift have been used (Durrant and Krieger,
1996). However, this signal processing and/or editing can introduce flaws,
proportional to the magnitude of the artifact of stimulation. Several cochlear
implants also allow the stimulation pulse to be biphasic in order to decrease
the influence of the artifact on the recording. Nevertheless, the success of
EABR recording still is strongly affected by the capabilities of the recording
amplifier (not equal among
systems/manufacturers). The techniques just described are by
no means optimal, and not all of these techniques are possible via available
ABR test systems and/or within the expertise of the examiner.
There thus has been little work to establish signal processing
methods specifically for the EABR. The technique described herein was developed
in consideration of the properties of the EABR and was tested both by
simulation and in actual implanted subjects. Although the clinical application
of interest here is the post-implant evaluation via EABR measurement, it also
is conceivable to use this technique for pre-operative testing in the implant
candidate, i.e. via promontory stimulation using a transtympanic electrode.
This technique also should be adapted ultimately to the study of electrically
evoked middle- and long- latency auditory evoked potentials and to the EABR
obtained with a brainstem implant.
MATERIAL AND METHODS COCHLEAR IMPLANT
The cochlear implant employed in this study was the DIGISONIC,
a 15-electrode transcutaneous device (Beliaeff et al., 1994). It is
manufactured by the firm MXM (Antibes, France). It is composed of two distinct
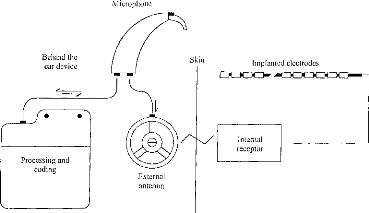
parts; an external and an internai component (figure 1). The external device
performs an acoustical signal analysis leading to the extraction of relevant
speech information. This information is passed to the internai (implanted)
device. The signal processing is based on the Fast Fourier Transformer. The
external device computes, in real time, the spectrum of the acoustical signal
for 64 bands of 122 Hz in the range of 0 to 7.8 kHz. The acoustical signal is
sampled at 15.6 kHz. The analysis window is 128 points. Frequency bands are
grouped before being distributed to the electrodes. The transcutaneous
interface is composed of two antennas, one emitting and the other receiving.
Generally, active electrodes are located from 5 to 20 mm from the base. The
internai part performs the decoding of the information received by the internai
antenna and stimulates the programmed electrodes.
Bellind the ear device
Skin
Implanted electrodes
Microphone
EICDIC{},-
Internai
receptor
Processing and
coding
External
antenna
Figure 1: Block diagram of the DX10 DIGISONIC
cochlear implant. Information is transmitted from the speech processor to the
internai part on a carrier, wave using amplitude modulation. The carrier
frequency was 4 MHz.
Stimulation was accomplished via the Common Ground mode,
wherein the addressed electrode is activated and ail the others are connected
to ground. The stimulus is produced by a pulse generator; the pulse is of a
constant amplitude, but variable in length. As illustrated in figure 2, the
equivalent circuit of each electrode/channel of stimulation is a series
capacitor and resistor, fed by the pulse generator. The stimulus delivered is
biphasic and asymmetric. Adjustment of the series capacitor permits very
precise equalization of the positive and negative charges transferred which, in
turn, is extremely important for preservation of physiologie integrity of the
tissues. The pulse duration ranges from 5 to 310 ps. The pulse generator can
source 3 mA over a 2 kohm load. For recording EABRs, the external package is
replaced by a specialized device manufactured by MXM, the DIGISTIM. The
DIGISTIM is battery-powered and controiled by a persona! computer through an
opto-isolated serial port. This system allows the generation of a pulse with
several adjustable parameters, i.e. choice of electrode, magnitude, pulse
duration, and stimulation frequency. Synchronization of the evoked potential
test system is made possible by an external trigger pulse produced by
DIGISTIM.
r
Figure 2: Simplified description of the
DIGISONIC cochlear implant stimulation in the labyrinth. Impedance can be
represented by a pure resistance (about 2 kohm in vivo). Mean amplitude is zero
volt. Positive and negative parts of the pulse are not symmetrical but charges
are equal. Phase-Iocking of the fibers occurs mostly on the positive part.
ANALYSIS OF THE EABR--THEORETICAL BACKGROUND: THE ABR AND
HEARING SYSTEM
The ABR represents electrical fields sampled on the scalp.
These fields are produced by sources remote to the electrodes; the recorded
signais thus are characterized as being far-field potentials. They are the
consequence of nerve-impulse propagation along the auditory pathways from the
inner ear to the inferior colliculus at the upper margin of the pontine portion
of the brain stem (for review, see Durrant and Lovrinic, 1995 and Durrant and
Wolf, 1991). The stimulation of choice for these characteristically
short-latency potentials (i.e. with principle waves falling within 10 ms.) is a
brief transient, such as the acoustic click, which excites a relatively wide
population of nerve fibers (due to spectral splatter) with excellent
synchronisation (due to temporal precision of the stimulus). The ABR primarily
reflects, therefore, afferent activity of auditory nerve fibers in the Vllith
nerve and the brainstem (Moore, 1987b). Each wave cornes from a virtual source
which can be represented as a dipole with an amplitude and an angle (phase and
space) (Williston et al., 1981; Pratt et al., 1983; Scherg and Cramon, 1985).
Consequently, a given pair of recording electrodes, that is sampling between
any two points on the head, registers an overall waveform that is the resultant
of the combined phasor and vector summation of the overlapping time-series of
compound potentials excited at the various levels of the
peripheral and brain-stem auditory pathways. Waveform
morphology thus is influenced not only by stimulus spectral and temporal
characteristics, but also orientation of the recording `dipole' with respect to
those of constituent sources dipoles.
Clinical methods of recording employ disc electrodes (e.g.
silver or gold) with an electrolyte paste affixed to the skin. At moderate
intense stimulus levels, the typical ABR appears as a series of 5-7 waves
occuring within a time frame of 10 milliseconds. The EABR, however, typically
shows only three waves in a 6ms time interval (waves II, III & V, in
reference to the acoustically evoked response) (Van den Honert and
Stypulkowski, 1986; Abbas and Brown, 1988; Shallop et al., 1990). Nevertheless,
the generation of EABRs waves is fundamentally the same as for the ABR, but
with the input stage of the system (the organ of Corti) being
effectively`bypassed (Van den Honert and Stypulkowski, 1986; Waring, 1995).
This eliminates the initial propagation and synaptic delays, moving the
ensemble earlier into the measurement time window. Wave I, from distal Vlllth
nerve usually is obscured by the stimulus artifact, regardless of method of
analysis. Wave II derives from the transition between the VIllth nerve and the
passing into the brainstem (WIler et al., 1988). Wave III is generated when the
nervous signal leaves the cochlear nucleus. The IV-V complex originates
somewhere along the contrelateral lemniscus to the controlateral inferior
colliculus (Moore, 1987b; Millier and Jannetta, 1982; Legatt et al., 1988; and
Durrant et al., 1994).
co co
Figure 3: Aspect of the compound nerve impulse
related to the distance from the stimulation.
Most of the afferent auditory nerve fibers (90% or more) are
myelinated (Spoêndlin and Schrott, 1988, 1989; Moore, 1987a,b). The fiber
diameter is characterized by a
normal distribution centred between 2 and
44.im .(Spoëndlin and Schrott, 1988, 1989),
as is conduction velocity. Furthermore, the farther from the
origin of stimulation, the Iess synchronous are the neural potentials.
Consequently, the density of discharge of the fibers also is typically
represented by a normal distribution which becomes increasingly broader the
farther the potentials are sampled from the source. Namely, the width increases
Iinearly with the distance (Figure 3). Normative studies of the ABR support
this theory (John et al., 1982). This fact however, is somewhat obscured in the
ABR waveform, because of the diverse origins of wave I to V (Zapala et al.,
1992), further complicated by temporal dispersion due to the frequency-place
encoding performed by the cochlea (Don and Eggermont, 1978; Gorga et al.,
1988). This resuits in the superposition of wave components, depending upon
stimulus intensity (Zapala et al., 1992). Electrical stimulation, however,
simplifies matters in that the responses originate from essentially the same
region of the VIllth nerve (i.e., again, cochlear propagation delays are
eliminated).
RECORDING PARAMETERS
The Pathfinder II (Nicolet Biomedical) was used to record the
EABRs. The ipsilateral montage commonly employed clinically for recording the
ABR was used here: the noninverting input of the preamplifier was connected to
a gold-cup electrode at hairline, at midiine, and the inverting input was
connected to an electrode placed on the ipsilateral earlobe. The ground
electrode was affixed to the contralateral earlobe. The recording parameters
employed, however, were slightly different of those used in ABR protocol.
Full-scale sensitivity was +/-50pV. A wide bandpass (0.2 Hz-8000 Hz) was used.
The sampling rate (50kHz) was well above the highest frequency of interest in
the EABR; such oversampling is desirable in order to minimize the influence of
noise (Grônfors and Juhola, 1995). Each response recording derived from
an average of 512 stimulus repetitions. This is a relatively low N by clinicat
standards, but it should be born in mind that the subjects were under general
anesthesia. Consequently, time was of the essence, but some sources of noise
(i.e. myogenic from movement) were naturally reduced. A test and two retests of
EABR were performed for each stimulus condition for purposes of determining
reproducibility of the responses.
Stimulation, again was delivered by the Digistim, triggering
the Pathfinder II. In our study, for each patient, we tested
from 4 to 9 electrodes equally spaced along the array from base to apex. For
each electrode, we have recorded a threshold among 16 intensity levels, along a
linear scale from comfort level (CL) to 0. The duration of the pulse was chosen
a the parameter by which to vary intensity. For each condition, we made three
recording. The stimulus rate was 60 Hz, chosen to be above the line frequency
used in Europe (50Hz). (This clearly would not be an appropriate choice in
countries like the United States and Canada where the line frequency is 60
Hz.). This frequency admittedly is to high for ABRs elicited by acoustic
stimulation (i.e. due adaptation), yet it not poses problems, in our
experience, with electrical stimulation. This is because adaptation for
electrical stimulation is more dependent upon refractory period than pure
adaptation (Brown et al., 1990 ; Abbas and Brown, 1991 b). After acquisition,
the data were transferred to a personal computer for further processing, where
upon the filter algorithm was implemented and the filter function applied.
Consequently, the choice of system for data acquisition is not critical to the
analysis procedure.
FILTER TECHNIQUE
Considering the neuroanatomical and neurophysiological bases
of the ABR, the width of the component waves are expected to increase with
latency, which in fact occurs overall. Consequently, each wave has not only a
characteristic latency, but also a characteristic spectrum. Wave I then is
expected to be more easily detected using a high frequency filter; the opposite
is expected for wave V, since, for longerlatency waves, the spectrum is more
robust in the lower frequencies. However, the filters previously described for
ABR/EABR have fixed transfer functions. The choice of bandpass is made
according the ABR/EABR's average spectrum. In more recent studies, on the other
hand, Pratt (1989) and Gronfors (1993) have described digital filters adapted
to each wave, i.e. by latency.
The filter involved a transfer function designed according to
certain nuances of neural conduction. As shown in Fig. 3, the compound action
potentials which develop along a neural pathway are products of the conduction
velocity and axonal length. If the spectra of such
signais are measured , there is observed a band-pals whose center
frequency follows approximately a hyperbolic function. For
proprietary reasons (re future product development), the details of the filter
function cannot be divulged. Nevertheless, certain important characteristics
can be described.
The conduction velocity depends upon diameter of the nerve
fiber; as the diameters follow a Gaussian distribution (Spoendlin, 1988, 1989),
the waveforms perhaps can be modelled by a Gaussian pulse whose width
influences the latency function. The formula approximating the wave can be
written as follows:
Onde(t)= A. exp(
(t--t0)2)
Where tO corresponds to a latency for which the response is at
the maximum, b is the time constant of the wave, and A is the wave's amplitude
at t=t0.
As the form of the wave presumably follows a naturel law, the
convolution of the wave by a Gaussian pulse of the same half-life duration
centered on zero will maximize the peak of a wave. The distribution of the
theoretical wave is calculated, starting from work in this laboratory and
values in the literature (Gallego et al., 1996, 1997; Abbas and Brown,
1988).
exp(--( t, )2)
S(t) = E(t)*
fexp(--(b,)2.dx)
Where b is the time constant of the theoretical wave and E(t) is
the waveform centered on the point where one wishes to detect a peak.
The filter that we have developed was inspired by the formula
above, however, it takes into account only a part of the total EABR wave,
corresponding to essentially 95 % of the energy of the theoretical wave (t = [
-1.96-2b, 1.96+2b]).
This filter is designed with the goal of maximizing the peaks
of the EABR waves and trying to protect the integrity of the EABR while
eliminating those waves not belonging to the EABR proper. We thus endeavour to
eliminate all waves that do not correspond to the desired ones, that is to say,
those that do not fall within plus-or-
minus three standard déviations. To- conctruct the
theoretic EABR, we -have based it
on the wave III. In effect, this wave, contrary to wave II and
IV-V complex, is well isolated from the others. There thus is no overlapping of
wave III by the others, so it can easily be dissociated from EABR (fig. 5a).
The duration of wave III also is the most stable. Utilizing a conventional
digital filter (filter pass band of 150-3000 Hz (Gallégo et al., 1996)),
we have measured the width of wave III in a sample of 10 implanted subjects
with the Digisonic. The width of wave III is 1.05 ms with a standard deviation
of 0.138 and a peak latency of 2.06 ms with a standard deviation of 0.186.1f
one considers that this width corresponds to approximately 95 % of the energy
of the wave (this would be +/- 2b'), one thus can measure the time constant of
wave III (b' = 1.05/4 = 0.26 ms). We, therefore, have filtered the signal in
the manner that only waves falling within plus-or-minus three standard
deviations ( for t=2.06 ms. b' = [0.16,0.37]). We have made the assumption that
at the instant of t=0, the neural influx evoked by electric stimulus was
perfectly synchronized. We then varied b' linearly as function of the latency
such that at t=2.06, b'=0.25 and b' varies linearly as a function of t.
20
10
0
m
--10
20
30
40
50
100 1000 10000
Frequency (Hz)
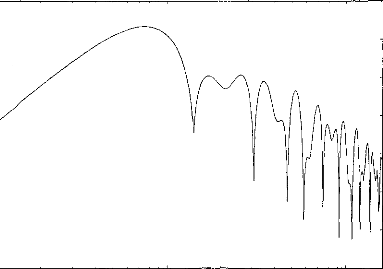
Figure 4 : Transfer function of the numeric
filter when the latency is 2,06 ms and b=0,288 ms.
The ideal formula for the filter is:
t )2)
exp(--( , t )2)
exP( (b' (t)+3.sd(t))
(b (t)-3.sd(t) E(t)*
E(t)*
exp(--( , )2 .dx)
exp( ( )2 .dx)
(b (t)+3.sd(t))
(b (t)-3.sd(t))
where b'(t)=a.t
exp(--( )2)
E(t)* (b (t)-3.sd(t)
f exp(--( , 2.dx)
x = --2(b' (t)+3sd(t)) (b (t) -- 3 .sd(t))
2(b' (t) + 3sd(t))
The formula utilized experimentally is only an approximate of
the theoretical one. The
analysis window is from 4 b'(t) to infinity, so the
equation becomes:
* porte(2(b'(t)+ 3.sd(t)))
* porte(2(b'(t)+ 3.sd(t)))
exp(--( t )2)
(b (t)+3.sd(t))
-- E(t)*
2
2(b' (t)+3sd(t))
f exp(--( ) .dx)
x = --2(h' (t)+3sd(t)) (b (t)+3.sd(t))
Where b' +1- 3 sd(t) takes the values following the function
of latency: for t=0.5 ms b'(t)-3sd(t)=0.04 ms, b'(t)-3sd(t)=0.10 ms ; t=1 ms
b'(t)-3sd(t)=0.08 ms, bi(t)- 3sd(t)=0.20 ms ; t=2 ms b'(t)-3sd(t)=0.16 ms,
b'(t)-3sd(t)=0.40 ms....
Figure 4 shows the filter transfer function for a
2.06-ms-latency component. ( This filter function is simulated for 1024 points,
ranging from 100 Hz to 15 kHz on a logarithmic scale.) This function can be
represented by a bandpass filter with a peak at 750 Hz. The shape of the
filter's frequency response is maintained for components of other latencies.
There is a slight linear shift with latency: the peak is at 3kHz for t=0.51ms,
at 1.5kHz for t=1.03ms, at 750Hz for t=2.06ms, at 375 Hz for t=4.12ms
The EABRs were sampled over a 10.24 ms window to yield a
time-ensemble of 512 data points. However, only the data points representing
latencies from 0.5 to 8 ms were considered in the calculation of the filtered
response. Like Durrant and Krieger (1996), we found some truncation of the
initial part of recording to be essential. On the other hand, experience simply
dictates that period beyond 8ms is of no value in assessing EABRs.
After having filtered the three tracings from the same
intensity of stimulation, we calculated a mean. To facilitate visualization of
the response, we then blanked the first 0.5 ms of the trace to eliminate (or
minimize) stimulus artifact. To permit objective determination of the presence
or absence EABRs, we calculated a 3x3 matrix of cross-correlations among the
three traces (note above). The window studied extends from 1 to 7 ms (300 data
points). The EABR was considered to be presence when the cross correlation was
greater or equal to 0.15 for two out of three traces (Pearson correlation :
p=0.01).
0.5 0.0 --0.5 --1.0
RESULTS
2 3 4 5 6 7 8
--1.5
0
Fig 5a.
0.6 0.4 0.2 0.0 --0.2 --0.4
Fig
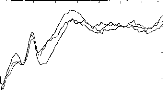
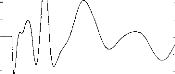
Figure 5: EABRs before (5a) and after (5b)
digital processing. After filtering the three curves, the intercorrelation
function leads to a time shift equal to -20ps between the first and the second
averages (Pearson coefficient=0,85), -60ps between the second and the third
averages (Pearson coefficient=0,93), 20ps between the first and the third
averages (Pearson coefficient=0,91). The detection of the waves indicates
LII=1,22ms, LIII=1,98ms, LV=3,74ms, A1l=0,52pV, Al11=0,99pV, AV=0,57pV. (It
also is possible to demonstrate wave IV, but focus upon waves II, III, and V as
they were the most robust in our recording).
Figure 5 shows a EABR before and after using the digital
filter. Latencies of the waves are not affected. With a simple peak-finding
subroutine, latencies and amplitudes of the waves can be easily measured. The
short-latency components are well separated from the stimulus artifact.
Latency of wave II (ms) Latency of wave III (ms)
Latency of wave V (ms) wave H-III interval (ms) wave III-V interval
(ms)
means and s.d
|
means and s.d
Van den Honert &
Stypulkowski, 1986
|
means and s.d
Abbas & Brown, 1988
|
Means and s.d.
Kasper et al., 1992
|
|
1.28 (0.17)
|
1.20 (0.14)
|
1.36 (0.19)
|
1.38 (0.09)
|
|
NS
|
NS
|
NS
|
|
2.05 (0.18)
|
2.10 (0.15)
|
1.99 (0.23)
|
2.16 (0.18)
|
|
NS
|
NS
|
NS
|
|
3.86 (0.28)
|
4.09 (0.26)
|
3.99 (0.37)
|
3.94 (0.22)
|
|
***
|
NS
|
NS
|
|
0.77 (0.06)
|
0.95 (0.16)
|
0.63 (?)
|
0.75 (?)
|
|
***
|
?
|
?
|
|
1.81 (0.14)
|
1.83 (0.17)
|
2.00 (?)
|
1.79 (0.17)
|
|
NS
|
?
|
NS
|
Table I: Average EABR latencies ( 11
subjects, for 58 tested electrodes) compared to values observed in other
studies (Van den Honert and Stypulkowski, 1986 ; Abbas et Brown, 1988 ; Kasper
et al., 1992). A comparison of the mean values has been performed using a
comparison of mean values statistical test (NS: no significant difference ;
***: significant difference, less than 0,05 ; ?:no tested).
The robustness of the noise reduction of this filter function
also was assessed. A model EABR was constructed based upon results of other
researchers (table I, right part) and from our own laboratory (Gallégo
et al., 1996, 1997) and imbedded in white noise for several signal-to-noise
ratios (SNRs). The model EABR comprised component waves having latencies of
1.28ms, 2.06ms and 3.86ms respectively. Corresponding widths are 0.71ms,
1.15ms, and 2.15ms.
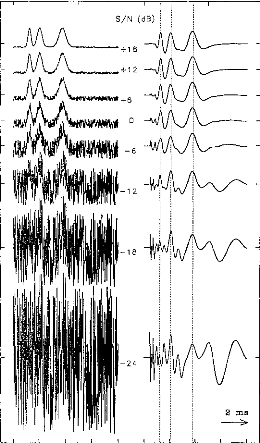
Figure 6 shows the effect of the addition to the model EABR a
white noise before and after digital filtering (the SNR was varied between +18
to --24 dB in steps of 6 dB). Despite the addition of noise, it is notable that
wave II, III and V always can be identified. There latencies are very
stable.
t
i
r
S/N (da)
+6
--6
..-
--12
--18
--24
2 ms
--
Figure 6: Resistance to noise of the filter
function. A white noise has been added to the signal (EABRs + white noise) ;
signal is represented before (left) and after (right) this signal processing.
The signal-to-noise ratio varied from +18 to --24 dB in steps of 6 dB.
Figure 7 compares the evolution of the cross-correlation,
between the original mode! EABR and that buried in noise, with and without
digital filtering (with SNR varied between +18 and --48 dB in 6 dB steps). Each
point corresponds to an average of 100 repetitions. (Also indicated are the
standard errors). Without digital filtering, we could detect the EABR only down
to SNRs of --24 dB. With digital filtering, we could detect the EABR down to
--36 dB SNR. For noisier waveform, there no longer was a significant
correlation between the noisy signal and the original signal.
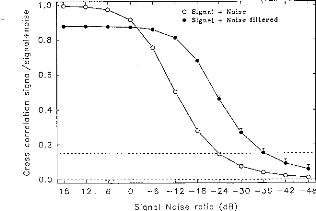
O Signal + Noise
· Signal + Noise filtered
N
Figure 7: Cross-correlation between a model
EABR and model EABR buried in noise (white noise added, bandwidth of 25,000 Hz)
as a function of the signal-to-noise ratio. Each point corresponds to a mean of
100 repetitions (mean and standard errors) before (open circles) and after
filtering (close circles). The dashed lines (for R = 0.15) demark the limit of
validity of the measurement of EABR (p=0.01).
o Signal + Noise
· Signal + Noise filtered
300
250
rn
200
C.)
C
o
150
Q)
TD 100
ô 50
E)
18 12 6 0 --6 --12 --18 --24 --30 --36 --42 --48
Signal Noise ratio (dB)
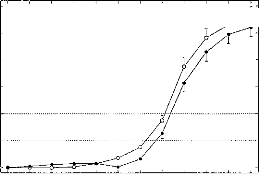
Figure 8: Mean of absolute latency shifts
(intercorrelation) between a model EABR and model EABR buried
in noise (white noise added, bandwidth of 25,000 Hz) as a function of the
signal-to-noise ratio. Each point corresponds to a mean of 100 repetitions
(mean and standard errors) before (open circles) and after filtering (close
circles). The dashed lines (for t = 50-100 ps) demark the limit of validity
latency of the EABR (from 2.5 to 5 data points). Below this zone we consider
that there is no significant displacement between the two curves. Above this
zone, the model EABR in noise with and without filtering are two different.
Figure 8 compares the variations of the maxima of
inter-correlation between the noisy EABR-(filtered or not) and the original
EABR. This gives an idea of the changes in latency of the waves due to the
addition of the noise. Each point corresponds to an absolute value of the
average of 100 repetitions. (Also indicated are the standard errors.). The
latency shifts are contained within +0.5 ms (with an mean value of 0.25 ms
representing chance). The latency shifts can be considered negligible for mean
values from 50 to 100 ps (2.5 to 5 data points). The digital filter does not
cause latency shifts for SNRs down to --24 dB. For
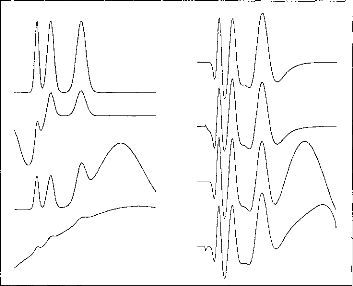
Figure 9: Demonstration of suppression of
interfering signais (myogenic, vestibular, etc.). Input signais, i.e. EABR +
interference (Ieft-hand panel) are auto-scaled to full-scale, dictated in some
case by the magnitude of the interfering signal. Filtered, output signais
(right-hand panel) are plotted on the same scale.
Another test of the filter transfer function was to evaluate
its ability to suppress waves
where the spectrum is incompatible in their
latency with waves evoked by auditory
stimulation. It was noted above that
such waves could derive from myogenic,
vestibular, or other sources. Figure 9 shows several model
non-EABR waves. It can be seen in figure 7 that such waves are strongly
attenuated.
In this work, EABRs have been recorded and filtered for 11
implantees, for several electrodes (a total of 58), and with different
stimulation levels for each electrode (16 levels). For each recording we first
determined if there was presence or absence of an EABR (again,
cross-correlation of >= 0.15). Then, for the traces which were recognized as
EABRs we measured the latencies and interpeak intervals of waves III, and V. We
then averaged the values by electrodes, then by across patients. Table I
indicates the latencies and interwave latencies for waves II, III, and V
measured on 11 subjects. These average values have been compared with results
given other authors on others cochlear implant system (Van den Honert and
Stypulkowski, 1986; Abbas and Brown, 1988; Kasper et al., 1992 respectively
tested on single channel 3M, multi-channel Nucleus and lnaired, multi-channel
Inaired systems). Most of the comparisons are not significantly different (10
out of 12). Results obtained after filtering match the usual values given in
the literature. EABRs were recorded even when the perception was that the
stimulus was very faint.
DISCUSSION
EABR quality was found to be improved substantially by the use
of a time-variant filter function adapted to the auditory system. Each wave
undergoes filtering that is latency-specific and can be easily extracted from
the overall EABR and background noise. No latency shift is introduced by the
processing. Noise and signais commonly interfering with the EABR were reduced
dramatically by this filter function, both in stimulations and actual
recordings. Consequently, the myogenic wave typically occurring at about 6.0 ms
(Fifer and Novak,1990) and the putative vestibular wave occurring at 0.5 ms
(Van den Honert and Stypulkowski, 1986) were effectively suppressed. Indeed,
most of the problems seen with EABRS are reduced by this filter function;
including suppression of the de shift induced by the stimulus artifact.
Furthermore, wave II which was not systematically seen in other studies (Van
den Honert and Stypulkowski,1986) is always extracted.
Latencies of waves II, III, and V measured using the filtered
responses were found to compare favourably with the values reported by other
workers with other cochlear implant systems (Van den Honert and Stypulkowski,
1986; Abbas and Brown,1988; Kasper et aI.,1992). This agreement suggests our
method to be valid and to yield accurate Iatency measures. The potential to
record responses in all cases and with stimulation by all electrodes is
particularly significant for intraoperative and clinical applications of EABR
analysis. Altogether, 58 electrodes were tested in 11 patients. We thus did not
have the sorts of failures reported by others (e.g. Van den Honert and
Stypulkowski, 1986; Abbas and Brown, 1991).
Finaily, the time-variant filter function proved to be very
robust in coping with noise added to model EABRs. The model EABRs were reliably
recorded in broad-band noise to SNRs below -36 dB. Furthermore, this filter
does not cause latency shifts for SNRs <= -24 dB. Consequently, EABRs can be
recorded using low-level stimulation, as indeed was demonstrated by actual EABR
recordings. Such performance is particularly important in working with
paediatric patients in the clinical setting, wherein time is of the essence.
Using this filter should substantially reduce the analysis time by reducing the
number of stimulus repetitions needed for each average, thereby permitting the
exploration of more electrodes.
ACKNOWLEDGEMENTS
The authors acknowledge those individuals and institutions who
made this work possible: the MXM company, the Hospices Civils of Lyon, the
Centre Nationale de Recherche Scientifique, the Université Claude
Bernard, professors Eric Truy and Alain Morgon, and certainly the eleven
implantees.
REFERENCES:
Abbas PJ, Brown CJ, Electrically evoked brainstem
potentials in cochlear implant patients with multi-electrode stimulation, Hear.
Res. vol.36, pp.153-162, 1988.
Abbas PJ, Brown CJ, Electrically evoked auditory
brainstem response: Growth of the response with current level, Hear. Res.
vol.51, pp.123-37, 1991a.
Abbas PJ, Brown CJ, Electrically evoked auditory
brainstem response: refractory properties
and strength-duration functions,
Hear. Res. voI51, pp.139-48, 1-991-13-.
Beliaeff M, Dubus P, Leveau J-M, Repetto J-C, Vincent
P, Sound Signal Processing and Stimulation Coding of the DIGISONIC DX10
15-Channel Cochlear Implant, advances in Cochlear Implant Ed Hochmair-Desoyer
IJ & Hochmair ES, pp.198-203, 1994.
Boston JR, Ainslie PJ, Effects of analogue and digital
filtering on brainstem auditory evoked potentials, Electroenceph. Clin.
Neurophysiol. vol.48, pp.361-364, 1980.
Brown CJ, Abbas PJ, Gantz B, Electrically evoked
whole-nerve action potentials: parametric
data from human cochlear implant users, J. Acoust. Soc.
Am. vol. 88, pp.2205-2210, 1990. Clarke CJA, Thomson DR, Gibson WPR,
Measurement of auditory brainstem responses evoked
by electrical stimulation with a cochlear implant, Brit.
J. Audiol. vol.24, pp.145-149, 1990.
Don M., Eggermont J.J., Analyses of click-evoked
brainstem potentials in man using high-pass noise masking, J. Acoust. Soc. Am.,
vo1.63(4), pp.1084-1098, 1978.
Durrant J, Krieger D, Artifact reduction in evoked
potential recording via polynomial curve fitting--feasibility study, Abstracts
of the Nineteenth Midwinter Research Meeting of the Association for Research in
Otolaryngology, pp.77, 1996.
Durrant J.D., Lovrinic J.H., Bases of Hearing science,
3rd ed. Williams & Wilkins, Baltimore, 1995.
Durrant J.D., Martin W.H., Hirsch B., Schwegler J., 3CLT
ABR analyses in a human subject with
unilateral extirpation of the inferior colliculus,
Hear.Res., vol.72, pp.99-107, 1994.
Durrant J.D., and Wolf K.E., Auditory evoked potentials:
basic aspect. In Hearing Assessment, 2nd Ed., W.F. Rintelmann, ed. Pro-Ed:
Austin, pp.321-381, 1991.
Fifer RC, Novak MA, Myogenic Influences on the Electrical
Auditory Brainstem Response (EABR) in Humans, Laryngoscope, vol.100,
pp.1180-1184, 1990.
Fridman J, John ER, Bergelson M, Kaiser JB, Baird HW,
Application of filtering and automatic peak detection to brain stem auditory
evoked potentials, Electroenceph. Clin. Neurophysiol., vol.53, pp.405-416,
1982.
Gallégo S, Micheyl C, Berger-Vachon C, Truy E,
Morgon A, Collet L, Ipsilateral ABR with cochlear implant, Acta
Otolaryngol.(Stockh), vol.116, pp.1604-1610, 1996.
Gallégo S, Truy E, Morgon A, Collet L. EABRs and
surface potentials with a transcutaneous multielectrode cochlear implant. Acta
Otolaryngol (Stockh), vol 117, pp.164-168, 1997.
Gorga MP, Kaminski JR, Beauchaine KA, Jesteadt W.
Auditory brainstem responses to tone burst in normally hearing subjects, J.
Speech. Hear. Res., vol.31, pp.87-97, 1988.
Grônfors T, Juhola M, Johansson R, Evaluation of
some non recursive digital filters for signais of auditory evoked responses,
Biol. Cybern., vo1.66, pp.533-536, 1992.
Grônfors T, Peak identification of auditory
brainstem responses with multifilters and attributed
automaton, Computer Methods and Programs in Biomed.,
vol.40, pp.83-87, 1993.
Grônfors T, Juhola M, Effect of sampling
frequencies and averaging resolution on medical
parameters of auditory brainstem responses, Comput.
Biol. Med., vol.25(5), pp.447-454, 1995.
House WF, Berliner K, Crary W,
Graham M, Luckey R, Norton N, Setters W, Tobin H, Urban J,
Wexler M, Cochlear implants, Ann. Otol. Rhinol.
Laryngol., vol.85(suppl 27), pp.1-93, 1976.
Jewett DL, Williston JS, Auditory evoked far-fields
averaged from the scalp of humans, Brain, vol.94, pp.681-696, 1971.
John ER, Baird H, Fridman J, Bergelson M, Normative
values for brain stem auditory evoked potentials obtained by digital filtering
and automatic peak detection, Electroenceph. Clin. Neurophysiol., vol.54,
pp.153-160, 1982.
Kasper A, Pelizzone M, Montandon P, Electrically Evoked
Auditory Brainstem Responses in Cochlear Implant Patients, O.R.L., vol.54,
pp.285-294, 1992.
Legatt A.D., Arezzo J.C., and Vaughan H.G., The anatomic
and physiologic bases of brain stem auditory evoked potentials, Neuroligic.
Clinics., vol.6, pp.681-704, 1988.
Michelson RP, Electrical stimulation of human cochlear: A
preliminary report, Arch. Otolaryngol., vol.93(3), pp.317, 1971.
MOler A.R., and Jannetta P.J., Evoked potentials from the
inferior colliculus in man, Electroenceph. Clin. Neurophysiol., vol.53,
pp.612-620, 1982.
Miller A.R., Jannetta P.J., Sekhar L.N., Contributions
from the auditory nerve to the brainstem auditory evoked potentials (BAEPs):
Results of intracranial recording in man, Electroenceph. Clin. Neurophysiol.,
vol.71, pp.198-221, 1988.
Moore JK, The human auditory brain stem: A comparative
view, Hear. Res., vol.29, pp.1-32, 1987a.
Moore JK, The human auditory brain stem as a generator of
auditory evoked potentials, Hear. Res., vol.29, pp.33-43, 1987b.
Pratt H., Har'el Z, and Golos E., Geometrical analysis
of human three-channel Lissajous' trajectory of auditory brain-stem evoked
potentials, Electroenceph. Clin. Neurophysiol., vol.56, pp.682-688,
1983.
Pratt H, Auditory Brainstem Evoked Potentials Peak
Identification by Finite Impulse Response Digital Filters, Audiology,
vol.28,pp.272-283, 1989.
Scherg M., von Cramon D., A new interpretation of the
generators of BAEP wave I-V; Results of spatio-temporal dipole model,
Electroenceph. Clin. Neurophysiol., vol.62, pp.290-299, 1985. Shallop JK,
Beiter AL, Goin DW, Mischke RE, Electrically Evoked Auditory Brain Stem
Responses (EABR) and Middle Latency Responses (EMLR) Obtained from Patients
with the Nucleus Miltichannel Cochlear Implant, Ear Hear., vol.11(1), pp.1-15,
1990.
Simmons FB, Electrical stimulation of the auditory nerve
in man, Arch. Otolaryngol., vol.84, pp.2-54, 1966.
Sohmer H, Feinmesser M, Cochlear action potentials
recorded from the external ear in man, Ann. Otol. Rhinol. Laryngol., vol.76,
pp.427-435, 1967.
Spoendlin H, Schrott A, The Spiral Ganglion and the
Innervation of the Human Organ of Corti, Acta Otolaryngol.(Stockh), vol.105,
pp.403-410, 1988.
Spoendlin H, Schrott A, Analysis of the human auditory
nerve, Hear. Res., vol.43, pp.25-38, 1989.
Starr A, Brackman DE, Brainstem potentials evoked by
electrical stimulation of the cochlea in human subjectes, Ann. Otol. Rhinol.
Laryngol., vol.88, pp.550-560, 1979.
Urbach D, Pratt H, Application of finite impulse
response digital filters to auditory brain-stem
evoked potentials, Electroenceph. Clin. Neurophysiol.,
vol.64, pp.269-273, 1986.
Van den Honert, Stypulkowski PH, Characterization of the
electrically evoked auditory
brainstem response (ABR) in cats and humans, Hear Res ,
vol.21, pp.109-126, 1986.
Waring MD, Auditory brain-stem responses by electrical
stimulation of the cochlear nucleus in
human subjects, Electroenceph. clin. Neurophysiol.,
vol.96, pp. 338-347, 1995.
Williston J.S., Jewett D.L., and Martin W.H., Planar
curve analysis of the three-channel auditory
brainstem response: a preliminary report, Brain. Res.,
vol.223, pp.181-184, 1981.
Zapala DA, Gould HJ, Mendel MI, Place specific influence
on the wave I to V interpeak latency
of the auditory brain-stem response, J. Acoust. Soc. Am.,
vol.92(6), pp.3174-3184, 1992.
|
|


