- Article 20 :
COCHLEAR IMPLANT PERFORMANCE AND ELECTRICALLY-EVOKED
AUDITORY BRAIN-STEM
RESPONSE CHARACTERISTICS
S. Gallégo, B. Frachet, C. Micheyl, E. Truy, L. Collet
Electroencephalography and clinical Neurophysiology, 1998, 108,
521-525
Nous avons comparé le pourcentage de reconnaissance sans
lecture labiale avec les latences et intervalles des ondes II, III et V des
PEAEP des 17 sujets.
Les résultats montrent de fortes corrélations
entre la performance d'une part et, la latence de l'onde V (R=0.57 p=0.017),
l'intervalle II-V (R=0.68 p=0.003), l'intervalle III-V (R=0.69 p=0.002) d'autre
part. Nous avons ensuite modélisé ces corrélations par une
fonction linéaire avec une régression linéaire multiple
pas à pas. Seul l'intervalle III-V à été choisi
comme modèle. La relation entre les deux paramètres est
Intervalle III-V (ms) = 2.01 - 0.378 Reconnaissance (N=17 R= 0.69 p=0.002).
Cette relation explique 48 % de la variance (R2).
La relation qui existe entre l'intervalle III-V et la
reconnaissance de la liste de mots sans lecture labiale peut s'expliquer de la
manière suivante. Un allongement anormal du temps de propagation entre
l'onde III (reflétant principalement l'activité du noyau
cochléaire homolatéral) et le complexe IV-V (reflétant
principalement l'activité du colliculus controlatéral) se traduit
par une mauvaise compréhension de la parole.
Le fait que le modèle linéaire décrivant
les relations entre l'intervalle III-V et les performances des sujets porteurs
de l'implant cochléaire sans lecture labiale explique environ 48 % de la
variance est intéressant. La mise en place de la technique de recueil de
PEAEP avant l'implantation (avec une électrode temporaire sur le
promontoire ou sur la fenêtre ronde) permettrait de pouvoir estimer les
performances des sujets après l'implantation.
|
|
|
|
ELSEVIER
|
Electroencephalography and clinical Neurophysiology 108 (1998)
521-525
|
Cochlear implant performance and electrically-evoked auditory
brain-stem
response characteristics
S. Gallégo"1", B. Frachetc, C Micheyla, E.
Truya'd, L. Collet"
dUPRESA--CNRS 5020, Pavillon U,
Hôpital E. Herriot, 3 place d'Arsonval, 69437 Lyon,
France
bLaboratoires MXM, 2720 chem. St Bernard, Vallauris,
France
`Service ORL, Hôpital Avicenne, Bobigny,
France
dService ORL., Pavillon U, Hôpital E. Herriot, Lyon,
France
Accepted for publication: 27 March 1998
Abstract
Objectives: The purpose of this study was to
find a correlation between cochlear implant performances in phoneme
discrimination and activity of the brain-stem.
Methods: Electrically-evoked auditory
brain-stem responses (EABRs) and speech recognition performances were measured
in 17 patients implanted with an MXM Digisonic DX10 cochlear implant. Speech
recognition performances without lip-reading were tested using lists of
isolated French words containing 3 phonemes.
Results: The results indicated statistically
significant correlations between phoneme correct-identification scores and the
following EABR variables: wave V latency, wave II-V latency interval and wave
latency interval. These results, indicate that up to about 48% of the variance
in isolated word recognition without lip-reading can be accounted for by EABR
variables.
Conclusion: The quality of brain-stem
functioning influences central processes in phoneme discrimination. (c) 1998
Elsevier Science Ireland Ltd. All rights reserved
Keywords: Cochlear implant; Electrically evoked auditory
brain-stem response; Speech recognition
1. Introduction
Speech recognition performances are largely variable across
cochlear implant (CI) subjects: while some patients can understand running
speech in noisy backgrounds without the aid of lip-reading, others cannot
recognize simple sentences spoken slowly and quietly. The speech recognition
performances of a given CI subject may depend on variable factors, such as the
etiology of deafness, the duration of sensory deprivation, and the
language-acquisition level before implantation and motivation, and it is
difficult to find a reliable predictor. The physiological state of auditory
system structures appears to be an important underlying factor of overall
performance with the implant. The number
* Corresponding author. UPRESA--CNRS 5020, Pavillon U,
Hôpital E. Herriot, 3 place d'Arsonval, 69437 Lyon, France. Tel.: +33 4
72110530; fax: +33 4 72110504. of surviving cells in the spiral ganglion, which
generaily correlates well with the duration of deafness (Otte et al., 1978;
Schmidt, 1985), has been pointed out as a possible factor, not only of
thresholds for electrical stimulation (Pfingst et al., 1980; Shannon, 1983;
Pfingst, 1984), but also of speech recognition performances (Pauler et al.,
1986) in CI subjects.
However, although results in the literature support the notion
that neural survival might be reflected in the growth of electrically evoked
brain-stem responses (EABRs) (Smith and Simmons, 1983; Lusted et al., 1984;
Brightwell et al., 1985; Hall, 1990), the results of studies in which
relationships between speech recognition performances and measures derived from
EABR amplitudes, such as threshold, response growth, refractoriness and
strengthduration functions have been investigated, have failed to evidence
strong correlations (Abbas and Brown, 1991a,b). The results of recent studies
suggest that other estimates of the neurophysiological state of peripheral and
intermediate
auditory nervous structures, which are related to speech
recognition performances, might be derived from late EABR wave latencies
(Herman and Thornton, 1992; Gallégo et al., 1997a).
The present study sought to characterize further the
relationship between speech recognition performances and EABR wave latencies in
subjects implanted with the Digisonic DX10 cochlear implant.
2. Material and methods 2.1.
Subjects
Seventeen adult subjects (10 female, 7 male; aged between 24
and 67 years), implanted with an MXM Digisonic DX10 cochlear implant,
participated in the study. Except for the fact that a minimum of 12 out of the
15 electrodes of the implant had to be active, i.e. to elicit auditory
sensations when stimulated, no particular inclusion criterion was defined
regarding the etiology of deafness, the duration of deafness and the time since
implantation, so as to allow for a wide range of speech recognition
performances in the study sample.
2.2. The MXM Digisonic DX10 cochlear implant
The MXM Digisonic DX10 (Fig. 1) is a multi-electrode
transcutaneous cochlear implant (Beliaeff et al., 1994). The implanted part of
the device consists of a coil receiver and 15 0.5 mm diameter electrodes spaced
0.7 mm apart. The electrode carrier is inserted surgically along the first turn
of the cochlea, generally between the 5th and the 20th mm of the basal
extremity. The stimulation mode used was the `common ground' mode in which one
electrode is activated at a time, all the others being connected to the
ground.
Stimuli used for ABR recordings were generated using an MXM
Digistim portable stimulator powered with batteries and run from a PC optically
coupled to a serial port. The stimulus generator contained in this system can
produce electric pulses having an intensity of up to 3 mA with a 2
load (Gallégo et al., 1998a); in the present study, the
pulse amplitude was generally fixed to 1 mA. Pulse durations were varied and
ranged from 5 to 310 fis. The pulses were biphasic, the positive and
negative phases being asymmetric.
Each stimulation channel can be modeled as a capacitor and a
resistor in series. Precise setting of the capacitor allows accurate
equilibration of the positive and negative charges, which is important in order
to preserve the physiological integrity of the stimulated tissues
(Gallégo et al., 1998b). EABR recordings were synchronized on the
stimulus using the trigger signal provided by the stimulation system.
2.3. EABR recording
An ipsilateral 3-electrode A1/2-Fpz set-up was used, with the
earth electrode placed onto the contralateral ear lobe. The stimulation and
recording techniques differed slightly from those used for acoustically evoked
auditory brain-stem responses. The stimulation rate was 60 Hz; though such a
rate would be too high for acoustically evoked auditory brain-stem responses
(Suzuki et al., 1986), it has been shown to be adequate for EABRs
(Gallégo and Micheyl, 1998).
The stimuli were delivered to 4 different electrodes;
generally, electrode numbers 4, 7, 10 and 13. Eight stimulation levels were
used; as the threshold and maximum comfort levels for electrical stimulation
may vary widely across electrodes and patients, these levels were specified as
percentages of the dynamic range of the tested electrode, rather

External
antenna
Skin
Implanter' electrodes
DWD
1 Internai
receiver
Behind the ear device

Microphone --\
--r

·
y

Processing and
coding
Fig. 1. Block diagram of the DX10 Digisonic cochlear
implant.
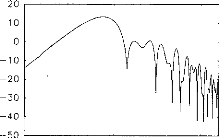
high-frequency filtering is used for the early waves whilst
low-frequency filtering is used for the late waves. Fig. 2 shows the filter
transfer function for the 2 ms latency wave. An algorithm for automatic
wave-latency measurement based on the search for inflection points in the first
derivative of the signal, combined with knowledge-based rules (Gabriel et al.,
1980; Fridman et al., 1982), was then applied. Waves II, III and V latencies
and the interval between waves II and III, III and V, and II and V, were
considered.
2.5. Speech recognition test
To assess phonemic recognition performances, lists of 34
3-phoneme French words (`Listes cochleaires de Lafon') were used. The words
recorded on CD were generated using a CD-player and presented via speakers
located about 50 cm from the implant microphone. Each word was presented only
once and the subject had to repeat what he/she had heard. The number of
phonemes correctly identified was counted by the experimenter and expressed in
percentages.
cr)
C
o
100 1000 1 000 0
Frequency (Hz)
Fig. 2. Example of digital filter transfer function used for
the processing of EABR signais.
than as absolute intensities. They corresponded to 5%, 10%,
20%, 30%, 40%, 50%, 70% and 90% of the dynamic range, defined as the difference
between the intensities corresponding to maximum comfort and threshold level,
respectively.
o 2 3 4 5 6 7 8
b
eII
o 2 3 4 5 6 7 e
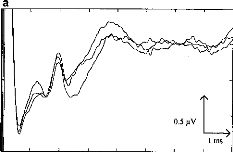
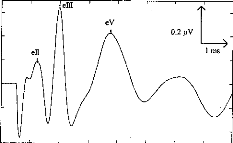
Fig. 3. EABRs before (a) and after (b) digital processing. The
automatic wave-latency estimation program indicated: LII = 1.22 ms, LIII = 1.98
ms, LV = 3.74 ms.
The full-scale range used for EABR recording was #177;50 p.V.
Responses were filtered using a wide band (0.1-8000 Hz) analog bandpass filter.
The averaging involved 1024 sweeps. In order to estimate test/re-test
reproducibility, EABRs were recorded 3 times at each stimulation level. EABR
reproducibility for a given stimulus intensity and electrode was calculated as
the inter-correlation between 3 averages from 1 to 7 ms. EABR traces were
considered reliable when the resulting inter-correlation coefficient was
superior or equal to 0.15 and significant (P < 0.01); otherwise,
the traces were rejected and another recording was performed.
2.4. Digital processing of EABR recordings
Following recording, the EABR traces were submitted to further
analysis consisting of digital signal processing. A first problem, which is
particularly acute in the case of electrically evoked ABRs, is that of the
stimulus artifact, the amplitude of which can be a million-fold larger than
that of the response to be measured. Therefore, special care must be taken to
avoid the saturation of the pre-amplification stage. A second general problem
with EABR recordings is the fact that ABR are of very small amplitude (in the
sub-microvolt range), and thus generally vulnerable to interference from a
variety of physical and physiological sources of noise.
Digital filters can improve greatly the ABR signal-tonoise
ratio (Urbach and Pratt, 1986; Moller, 1988), with the advantage of zero
phase-shift (Boston and Ainslie, 1980). In the present study, the quality of
ABR traces was enhanced using an original digital-processing scheme described
in a previous paper (Gallégo et al., 1997b, 1998c). This scheme is based
on the use of filters with different transfer functions; for each of the ABR
waves
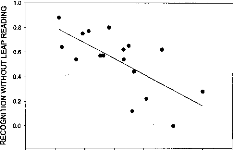
1.5 1.6 1.7 1.8 1.9 2.0 2.1 22
III-V INTERVAL (ms)
Fig. 4. Relationship between EABR wave III--V latency interval
and speech-recognition scores.
3. Results 3.1. EABRs
Fig. 2 shows examples of EABR traces. The 3 upper curves (Fig.
3a) correspond to recordings prior to digital processing; the lower curve (Fig.
3b) represents the EABR after filtering and summing. Waves II, III and V can
easily be identified.
3.2. Relationships between EABR variables and speech
recognition performances
Using the Kolmogorov-Smirnov normality test, the wave
latencies and latency intervals, averaged across electrodes and levels in each
patient, were found to be normally distributed; therefore, Pearson' s
parametric correlation was used to test for relationships between correct
phoneme identification scores and EABR wave latencies. Significant cor-
relations were found between correct phoneme recognition scores and wave V
latency (r = 0.57, P < 0.05, n = 17), wave II--V
latency interval (r = 0.68, P < 0.005, n = 17)
and wave III--V latency interval (r = 0.69, P < 0.005,
n = 17). Wave V latency and wave II--V latency interval proved to be
highly correlated with wave III--V latency interval (r = 0.77 and
r = 0.90, respectively; P < 0.001 and n = 17 in
both cases).
Stepwise multiple regression analysis involving all EABR
variables indicated wave III--V latency interval as a powerful predictor of
speech recognition scores, being able to account for about 48% of the variance
in the data (r = 0.69, P < 0.005, n = 17) (Fig.
4). The two variables were related by the following equation: y = 2.83 --
1.27x, where x and y correspond to the latency interval in ms and to
the speech recognition score in percentages. Another expression for the
relationship between the two variables was found to be: y = 1 -- 1.27(x --
1.44); according to this equation, the speech recognition score was 100% when
the
wave III--V latency interval was as small as 1.44, and it
decreased towards 0% as the interval increased up to 2.33 ms.
4. Discussion
The EABR wave latency values obtained in this study are in
agreement with those available in the literature (Abbas and Brown, 1988). The
variable-filter processing scheme used in the present and previous studies
(Gallégo et al., 1996, 1997a) leads to clear EABR traces, allowing for
accu- rate estimation of EABR wave latencies using an automatic detection
algorithm.
The main result of the present study consists in a
relationship between correct phoneme recognition scores on the one hand, and
the latency of EABR wave V and the intervals between this latency and that of
the two previous waves (II and III). The strongest predictor of speech
recognition performances proved to be the wave III--V latency interval. These
results generally agree with results from previous studies: in particular,
Herman and Thornton (1992) evidenced a relationship between phoneme recognition
performances and EABR wave V latency. More recently, Gallégo et al.
(1997a) evidenced a correlation between speech recognition and wave III and V
intervals.
One interpretation of the observed relationship between
correct phoneme recognition percentages and EABR wave III--V latency intervals
is that poor speech comprehension is connected with abnormal lengthening of the
propagation time between the nervous structures that generate waves III and V.
Wave III is commonly associated with the activity of the ipsilateral cochlear
nucleus, while the generator of wave IV--V complex is thought to be more
diffuse, involving in particular the contralateral inferior colliculus
activity. A likely origin for such a lengthening in neural propagation time
consists of neural degeneration. However, the fact that a relationship between
EABR wave latencies and speech recognition performances was obtained
specifically with wave V latency and the wave III--V latency inter- val, and
not with earlier latencies or latency intervals, suggests a specific origin of
the wave III--V latency interval increase. One such origin might be a reduced
temporal synchrony of neural discharges at the output of the cochlear nucleus,
leading to reduced temporal summation of inputs by inferior colliculus units,
and consequently, increased response latencies of these units. The present
results cannot be interpreted as an indication for the fact that the
neurophysiological state of structures before the level of the cochlear nucleus
is not an important factor of speech recognition performances in CI subjects;
simply, the latencies of EABR waves associated to structures below the cochlear
nucleus do not appear as a significant predictor of speech recognition
performances. Because of the complexity of the neural processes involved in
speech processing, relationships between electrophysiological variables and
speech
recognition performances are more likely to be found at higher
than at lower levels of the auditory system. Relationships between phoneme
recognition performances and electrically evoked middle latency responses have
recently been evidenced (Groenen et al., 1997); the results of the present
study suggest that such relationships might find their origin at lower
levels.
Whatever the mechanisms underlying the observed relationship
between EABR wave V latency and wave III--V latency interval, the results of
the present study indicate that speech recognition performances can be
predicted to some extent by EABR variables. A possible application of these
results might consist of pre-implantation prognostic of post- implantation
speech recognition performances (Gallégo et al., 1998d). However, given
that EABR characteristics appear to vary with the duration of implantation in
both animais (Miller et al., 1995) and humans (Gallégo et al., 1998d),
nothing yet warrants that EABR characteristics obtained using a temporary
electrode installed on the promontorium or on the round window will show
similar relationships with speech recognition performances.
References
Abbas, P.J. and Brown, C.J. Electrically evoked brainstem
potentials in cochlear implant patients with multi-electrode stimulation. Hear.
Res., 1988, 36: 153-162.
Abbas, P.J. and Brown, C.J. Electrically evoked auditory
brainstem response: growth of response with current level. Hear. Res., 1991a,
51: 123-138.
Abbas, P.J. and Brown, C.J. Electrically evoked auditory
brainstem response: refractory properties and strength-duration functions.
Hear. Res., 1991b, 51: 139-148.
Beliaeff, M., Dubus, P., Leveau, J.M., Repetto, J.C. and
Vincent, P. Sound processing and stimulation coding of Digisonic DX10
15-channel cochlear implant. In: I.N. Hochmair (Ed.), Advances in Cochlear
Implant. Proceedings of the 3rd International Cochlear Implant Conference,
Innsbruck, 1994, pp. 198-203.
Boston, J.R. and Ainslie, P.J. Effects of analog and digital
filtering on brain stem auditory evoked potentials. Electroenceph. clin.
Neurophysiol., 1980, 48: 361-364.
Brightwell, A., Rothera, M., Conway, M. and Graham, J.
Evaluation of status of the auditory nerve: psychophysical test and ABR. In:
R.A. Schindler and M.M. Merzenich (Eds.), Cochlear Implants. Raven, New York,
1985, pp. 343-349.
Fridman, J., John, E.R., Bergelson, M., Kaiser, J.B. and
Baird, H.W. Application of digital filtering and automatic peak detection to
brain stem auditory evoked potential. Electroenceph. clin. Neurophysiol., 1982,
53: 405-416.
Gabriel, S., Durrant, J.D., Dickter, A.E. and Kephart, J.E.
Computer identification of waves in auditory brainstem evoked potentials.
Electroenceph. clin. Neurophysiol., 1980, 49: 421-425.
Gallego, S., Micheyl, C., Berger-Vachon, C., Truy, E., Morgon,
A. and Collet, L. Ipsilateral ABR with cochlear implant. Acta Otolaryngol.
(Stockh.), 1996, 116: 228-233.
Gallégo, S., Truy, E., Morgon, A. and Collet, L. EABRs
and surface potentials with a transcutaneous multielectrode cochlear implant.
Acta Otolaryngol. (Stockh.), 1997a, 117: 164-168.
Gallégo, S., Collet, L. and Berger-Vachon, C.
Electrically auditory brainstem responses (EABR): contribution of a filter
adapted to the auditory system. J. Int. Fed. Med. Biol. Eng., 1997b, 35 (suppl.
1): 304.
Gallégo, S. and Micheyl, C. Relationship between
auditory brainstem responses and intensity discrimination in cochlear implant
patients. Behav. Neurosci., 1998 (in press).
Gallégo, S., Luu, B.L. and Berger-Vachon, C. Modelling
of the electrical stimulation delivered by the Digisonic Multichannel cochlear
implant. Adv. Modelling Anal., 1998a, 39(1): 39-53.
Gallégo, S., Beliaeff, M., Frachet, B., Ouayoun, M.,
Berger-Vachon, C. and Collet, L. Long-term change in threshold and comfort
levels and dynamics in Digisonic cochlear implant bearers. 1998b
(submitted).
Gallégo, S., Durrant, J., Collet, L. and Berger-Vachon,
C. Numeric timevariant filters adapted to the recording of electrically evoked
auditory brainstem responses (EABR). 1998c (submitted).
Gallégo, S., Truy, E., Berger-Vachon, C. and Collet, L.
Electrically auditory brainstem responses in cochlear implant assessment:
possibility and interest. 1998d (submitted).
Groenen, P., Snik, A. and van den Broek, P. Electrically
evoked auditory middle latency responses versus perception abilities in
cochlear implant users. Audiology, 1997, 36: 83-97.
Hall, R.D. Estimation of surviving spiral ganglion cells in
the deaf rat using the electrically evoked auditory brainstem response. Hear.
Res., 1990, 45: 123-136.
Herman, B. and Thornton, A. Electrically evoked-evoked
auditory brainstem responses in cochlear implanted subjects (abstract). In: The
Second International Cochlear Implant Symposium, Iowa City, IA, 1992, p. 57.
Lusted, H., Shelton, C. and Simmons, S. Comparison of
electrode sites in electrical stimulation of the cochlea. Laryngoscope, 1984,
94: 878882.
Miller, C.A., Faulkner, M.J. and Pfingst, B.E. Functional
responses from guinea pigs with cochlear implants. II. Changes in
electrophysiological and psychophysical measures over time. Hear. Res., 1995,
92: 100-111.
Moller, A.R. Use of zero-phase digital filters to enhance
brain-stem auditory evoked potentials (BAEPs). Electroenceph. clin.
Neurophysiol., 1988, 71: 226-232.
Otte, J., Schuknecht, H. and Kerr, A. Ganglion cell
populations in normal and pathological human cochleae. Implications for
cochlear implantation. Laryngoscope, 1978, 88: 1231-1246.
Pauler, M., Schuknecht, H. and Thornton, R. Correlative
studies of cochlear neuronal loss with speech discrimination and pure-tone
thresholds. Arch. Otorhinolaryngol., 1986, 243: 200-206.
Pfingst, B. Operating ranges and intensity psychophysics for
cochlear implants. Arch. Otolaryngol., 1984, 110: 140-144.
Pfingst, B., Telman, S. and Sutton, D. Operating ranges for
cochlear implants. Ann. Otol. Rhinol. Laryngol., 1980, 89 (suppl. 66): 1-4.
Schmidt, J. Cochlear neuronal populations in developmental defects of the inner
ear: implications for cochlear implantation. Acta Otolaryngol. (Stockholm),
1985, 99: 14-20.
Shannon, R.V. Multichannel electrical stimulation of the auditory
nerve in man. I. Basic psychophysics. Hear. Res., 1983, 11: 157-189.
Smith, L. and Simmons, F.B. Estimating eighth nerve survival by
electrical stimulation. Ann. Otol. Rhinol. Laryngol., 1983, 92: 19-23.
Suzuki, T., Kobayashi, K. and Takagi, N. Effects of stimulus
repetition rate on slow and fast components of auditory brainstem responses.
Electroenceph. clin. Neurophysiol., 1986, 65: 150-156.
Urbach, D. and Pratt, H. Application of finite impulse
response digital filters to auditory brain-stem evoked potentials.
Electroenceph. clin. Neurophysiol., 1986, 64: 269-273.
Conclusion et perspectives
Les performances auditives des sujets porteurs d'un implant
cochléaire présentent une grande variabilité. Les facteurs
intervenant dans le succès de l'implantation sont le caractère
pré- ou post- lingual de la surdité, le type de surdité,
l'état de la cochlée, le nombre de fibres nerveuses survivantes,
les capacités psychophysiques. La grande diversité des
résultats peut également résulter de différences
dans les capacités d'adaptation à la stimulation
électrique, mais aussi dans les capacités cognitives des
implantés.
La perception d'infimes différences auditives,
essentielle pour adapter le traitement des signaux de parole, est sans doute un
facteur primordial dans le succès d'une implantation cochléaire.
L'utilisation de mesures électrophysiologiques qui évaluent les
capacités de discrimination sont très intéressantes pour
obtenir une adaptation objective de l'implant cochléaire aux
capacités du sujet.
a- PEAEP
L'objectif principal des études
précédentes a été d'évaluer
l'intérêt des PEAEP en routine clinique pour aider au
réglage de l'implant cochléaire. Il est vrai que les PEAEP ne
sont pas les uniques et les plus fiables mesures électrophysiologiques
qui permettent d'évaluer les caractéristiques psycho-physiques de
chaque sujet implanté testé. Ils ont néanmoins l'avantage
d'être fiables, robustes et rapides à obtenir.
Nous avons chercher à relier les
caractéristiques des PEAEP à des seuils de détection, des
seuils de confort, des discriminations en intensité et des
reconnaissances phonétiques. Des études en cours, non
présentés dans ce mémoire tentent de corréler des
mesures de la tonie temporelle et de la tonotopie avec des recueils de
PEAEP.
Les PEAEP sont des indicateurs partiels des certains
paramètres tels que la tonie, l'intégration temporelle et la
reconnaissance de la parole qui font intervenir des traitements plus complexes
du système auditif. Les PEAEP doivent donc être couplées
dans certains cas à d'autres mesures électrophysiologiques pour
arriver à obtenir des estimations fiables des caractéristiques
psycho- physiques.
b- PEA de latences moyennes
L'utilisation des latences moyennes a montré leur
intérêt chez le normo-entendant (Bertrand et al, 1991) et chez le
sujet implanté cochléaire (Polelar J et al, 1995) lorsque l'on
veut mesurer la tonotopie. Certains auteurs (Groenen et al, 1997) trouvent
même desrelations entre les MLR et la perception de la parole.
Néanmoins ces mesures restent peu fiables et difficiles à obtenir
de manière reproductible chez des sujets implantés
cochléaires (Shallop et al, 1990).
c- PEA Tardifs
L'utilisation des potentiels évoqués auditifs
tardifs est tout aussi possible en routine clinique que les PEAEP:
L'amplitude des ondes N1P2 est ample (plusieurs pV),
reproductible et assez robuste ; le nombre de stimulation nécessaire
pour avoir une courbe fiable ne dépasse pas les 100, ce qui correspond
à une durée d'environ 1 min 30 s.
Des études ont montré qu'il était possible
d'estimer les performances des sujets implantés cochléaires avec
l'analyse des ondes tardives (ref.).
| 

