- Article 19 :
INTENSITY DISCRIMINATION AND AUDITORY BRAINSTEM
RESPONSES IN COCHLEAR
IMPLANT AND NORMAL-HEARING LISTENERS
S. Gallégo, C. Micheyl
Behavioral Neuroscience, 1998,
112, 793-799
Cet article compare la mesure du seuil différentiel en
intensité (IDL) aux amplitudes et latences des PEAP pour une population
normo-entendante (N=8) et une population implantée cochléaire
(N=6).
Chez les sujets normo-entendants, les IDL ainsi que
l'amplitude des ondes II et III varient de manière non-monotone en
fonction de l'intensité de stimulation. Ces modifications
non-linéaires peuvent s'expliquer par des seuils de déclenchement
différents des fibres afférentes de type I au niveau de la
cochlée (Liberman, 1978)
Chez les sujets implantés cochléaires, les IDL
ainsi que l'amplitude des ondes II et III varient de manière monotone en
fonction de l'intensité de stimulation.
L'absence de mécanismes complexes de la
biomécanique cochléaire et du recrutement des fibres à
différents seuils d'intensité lors d'une stimulation
électrique via l'implant cochléaire Digisonic rend la fonction de
IDL facilement calculable en fonction de l'amplitude des ondes.
Behavioral Neuroscience Copyright 1998 by the American
Psychological Association, Inc.
1998, Vol. 112, No. 4, 793-799 0735-7044/98/$3.00
Intensity Discrimination and Auditory Brainstem Responses
in
Cochlear Implant and Normal-Hearing Listeners
Stéphane Gallégo and Christophe Micheyl
Centre National de la Recherche Scientifique
Intensity-discrimination limens (IDLs) and auditory brainstem
responses (ABRs) were measured as a function of stimulus intensity in 6
cochlear implant (CI) and 8 normal-hearing (NH) listeners. Pulse-train stimuli
were delivered electrically to the auditory nerve in CI listeners and
acoustically in NH listeners. In CI listeners, the IDLs expressed as Weber
fractions decreased monotonically with increasing intensity. In NH listeners, a
nonmonotonic IDL function showing a peak a midintensities was observed. ABR
wave amplitudes increased regularly with intensity only in CI listeners.
Results support the notion that the slight decrease in Weber's fractions with
increasing sound intensity--generally referred to as "the near-miss to Weber's
law"--is subtended by retrocochlear processes, whereas the increase in Weber's
fractions at midlevels--known as "the severe departure from Weber's
law"--originates in cochlear mechanisms.
The encoding of intensity in the auditory system has been a
matter of intense debate over the past decades, and various neurophysiological
mechanisms have been put forward to account for the characteristics of auditory
intensity perception evidenced by behavioral studies in animais and
psychophysical measurements in humans (cf. the reviews in Phillips, 1987, and
Viemeister, 1988a, 1988b). However, several basic characteristics of auditory
intensity perception still lack a unequivocal neurophysiological explanation,
and even the question of whether their origin is to be found at the auditory
periphery or in more central parts of the auditory system remains unanswered.
This is the case in particular of die so-called "near-miss to" and "severe
departure from" Weber's law. The near-miss to Weber's law corresponds to the
fact that intensity discrimination thresholds for pure tones, when expressed as
a fraction of stimulus intensity, decrease slightly as stimulus intensity
increases, whereas Weber's law would require that they remain constant (McGill
& Goldberg, 1968a, 1968b; Moore & Raab, 1974). The severe departure
from Weber's law corresponds to an elevation in the Weber fraction at
midintensities. The severe departure was mainly studied using brief
high-frequency tone bursts (Carlyon & Moore, 1984, 1986a, 1986b). However,
a similar increase in Weber functions at mid intensities was originally
observed using clicks (Raab &
Stéphane Gallégo and Christophe Micheyl, Unite
d'Enseignement et de Recherche Associee 5020, Centre National de la Recherche
Scientifique, Pavillon U Hopital E. Herriot, Lyon, France.
This work was supported by a grant from the MXM Company. We
are grateful to R. P. Carlyon and R. V. Shannon for helpful comments on an
earlier version of this article. L. Collet and J. D. Durrant are acknowledged
for valuable comments on die results of this study. M. Rolland is acknowledged
for taking part in the measurements in normal-hearing listeners.
Correspondence concerning this article should be addressed to
Christophe Micheyl, UPRESA CNRS 5020, Pavillon U Hopital E. Herriot, 69003
Lyon, France. Electronic mail may be sent to cmicheyl mucosa.univ-lyon I
.fr.
Taub, 1969a, 1969b). More recently, tnidlevel humps in the
function relating intensity discrimination thresholds to stimulus intensity
were evidenced for tones in the condition of forward masking (Zeng &
Turner, 1992; Zeng, Turner, & Relkin, 1991). Whether the origin of ail
these phenomena is central or peripheral, and if it is peripheral, whether it
relies on cochlear mechanisms or on auditory nerve (AN) functioning, is still a
matter of debate. Models based on electrophysiological recordings of AN
responses indicate that only a few AN fibers with characteristic frequencies
akin to that of the signal are needed to account for the
intensity-discrimination performances observed in humans, but such models do
not clearly account for the decrease in Weber fraction at high intensities
(Viemeister, 1988a, 1988b). Regarding the existence of a midlevel hump in Weber
functions, the data obtained in unmasked conditions have generally been
interpreted to support a peripheral origin (Carlyon & Moore, 1984, 1986a,
1986b; Long & Cullen, 1986; Raab & Taub, 1969a, 1969b); the effects
obtained in nonsimultaneous masking conditions, although originally interpreted
in terras of peripheral mechanisms (Zeng & Turner, 1992; Zeng et al.,
1991), are now thought to reflect more central processes (Plack &
Viemeister, 1992a, 1992b).
To gain further insight into the neurophysiological mechanisms
underlying the encoding of sound intensity in die auditory system, a comparison
of psychophysical and physiological data is required. However, in mort cases,
such a comparison is rendered difficult by the fact that the neurophysiological
and the psychophysical data to be compared corne from different studies and
have often been obtained using different listeners or even species. During the
two preceding decades another approach to the study of the neurophysiological
basis of intensity perception has become available with the development of
implanted auditory prostheses delivering direct electrical stimulation to
neural stages of the auditory system in humans (Shannon, 1983; Shannon &
Otto, 1990). Recent studies in listeners with such auditory implants have
provided important information
794 GALLÉGO AND MICHEYL
about the neurophysiological origins of perceptual phenomena
relating to the perception of intensity Nelson, Schmitz, Donaldson, Viemeister,
& Javel, 1996; Zeng & Shannon, 1994, 1995).
In this study, we took advantage of the two approaches
currently available to investigate the neurophysiological bases of intensity
perception in humans: comparisons of physiological and psychophysical measures
obtained in the same listeners and comparisons of physiological and
psychophysical measures between listeners with normal auditory function and
listeners with an implanted auditory prosthesis. Psychophysical and
physiological measures were taken from listeners with normal hearing (NH) and
listeners with a cochlear implant (CI). The physiological measurements
consisted of auditory brainstem responses (ABRs). The psychophysical
measurements consisted of intensity-discrimination limens (IDLs) measurements.
All measurements were performed at different levels spanning almost the entire
audible range of the listeners. Because we wanted to make comparisons between
the two kinds of measurements and the two kinds of listeners, it was important
to use similar stimuli throughout the study. To minimize the differences
attributable to the respective specificities of the acoustic and electrical
modes of stimulation, we used stimuli with a similar temporal structure (i.e.,
trains of electrical or acoustic pulses presented at the same rate and having
the same overall duration).
Method
Listeners
Six CI listeners (6 men, aged 28-64 years) and 8 NB listeners
(5 women and 3 men, aged 20-37 years) participated in the experiment. The CI
listeners were implanted with a MXM DX10 multichannel electrode device
(Beliaeff, Dubus, Leveau, Repetto, & Vincent, 1994). All suffered profound
bilateral sensorineural hearing loss acquired postlingually 1-8 years before
implantation. In NH listeners, pure-tone audiometry was performed using a
Madsen OB 822 audiometer and TDH39 earphones to ensure that auditory thresholds
were not larger than 10 dB hearing loss at octave frequencies between 125 and
8000 Hz.
ABR Recordings
ABR recordings were performed using a Nicolet Pathfinder II
system. The positive, negative, and reference recording electrodes were placed
on the forehead, the ear lobe ipsilateral to the side of stimulation, and the
contralateral ear lobe, respectively. In CI listeners, the evoking stimuli
consisted of 500-ms trains of biphasic pulses. The pulses were delivered to the
implant device at a rate of 60 Hz using a dedicated stimulation system (MXM
Digistim). The stimulation mode was common ground. To reduce long-term
stimulation fatigue and to avoid the eventual occurrence of recurrent
electrical interferences, the pulse trains were separated by a silent interval
of 500 #177; 100 ms. ABRs .were successively recorded at 14 stimulus levels
equally spaced on a linear scale within the dynamic range (i.e., the range
between the detection
threshold and the loudest bearable level in the considered CI
listener). Stimulus level was controlled by varying the charge per pulse phase.
Pulse amplitude remained constant; only pulse duration was varied. In each
patient, the electrode with the most apical location inside the cochlea was
systematically tested. For normal insertion of the electrode array into the
cochlea, the location of the most apical electrode corresponded roughly to the
end of the first cochlear turn. Responses were bandpass-filtered between 0.2
and 8000 Hz before being acquired at a sampling rate of 50 kHz. The averaging
process involved 3,072 sweeps. Subsequent processing--adaptive filtering--was
thereafter performed in die digital domain to remove stimulus artifacts.
Further details about die ABR recording and processing methods may be found in
previous articles (Gallégo et al., 1996; Gallégo, Truy, Morgon,
& Collet, 1997). In NH listeners, ABRs were evoked using acoustic clicks.
The clicks were hi-pass-filtered at a cutoff frequency of 2000 Hz. This
filtering reduced trie contribution from apical generators, known to be less
well synchronized than most basal generators, and at the sanie time reduced
spectral cues by ensuring that successive peaks in die long-terni spectrum of
the stimulus would not be resolved. The equivalent rectangular bandwidth of the
auditory filter around 2000 Hz was already about four times larger than die
spacing between adjacent spectral peaks corresponding to the 60-Hz click
repetition rate used. As in CI listeners, the stimulus trains had a duration of
500 ms and were separated by a silent interval of 500 #177; 100 ms. The clicks
were delivered in the listeners' right ear through Sony CD450 headphones.
Traces at each intensity were obtained by averaging 3,000 responses. Responses
were analog filtered between 100 and 1500 Hz and were then sampled at a rate of
50 kHz before further digital processing performed to cancel stimulus
artifacts. ABRs were recorded at 14 stimulus intensities in 6-dB steps from 6
to 84 dB above threshold. Participants reclined in a soundproof room.
The amplitude and latency of Waves I and III were collected in
NH listeners. In CI listeners, because Wave I corresponds to an electric
stimulus artifact, Waves II and III were considered. Wave I in NH listeners and
Wave II in CI listeners are comparable in die sense that they reflect the
earliest ABR components of neural origin and are likely to originate in the
activity of auditory nerve fibers.
IDL Measurements
In NH listeners, intensity discrimination limens were measured
using a two-interval, two-alternative, forced-choice (2A-2IFC) procedure with a
two-down/one-up adaptive rule estimating the 71% correct point on the
psychometric functions. In CI listeners, a 2A-2IFC procedure combined with a
method of limits was used. In both procedures, the listener's task was to
indicate which of two successive intervals contained the loudest stimulus. The
stimuli used for IDL measurements were the same as those used for ABRs, namely
electrical biphasic pulses and acoustic clicks presented at a rate of 60 Hz in
CI and NH listeners, respectively. The stimuli were 500 ms long. The
interstimulus interval was 500 ms. IDL measurements were performed at levels
equal to those used in ABR recordings.
Results
Intensity-Discrimination Thresholds
Figure 1 shows the average IDL function obtained from the 6 CI
listeners. IDLs are expressed on the ordinate as
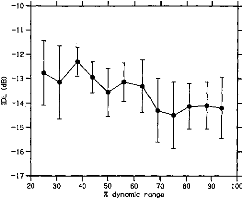
I
80
100
90
-12 -
-16-
17 t i t 1 i
20 30 40 50 60 70
% dynamic range
Figure 1. Intensity-discrimination limens (IDLs) as a
function of stimulus level in cochlear implant listeners. The stimulus level is
expressed as a percentage of the dynamic range on the abcissa. The mean IDLs
across listeners are expressed as Weber fractions in decibels on the ordinate.
The error bars represent the standard errors of the mean across listeners.
Weber fractions in decibels;' stimulus intensities are
expressed on the abscissa as the percentages of dynamic range.2 The
DL function could be fitted by a line with a slope of --0.03 (R2 =
.73).
Figure 2 shows the average 1DL function measured in the 8 NH
listeners. This function exhibited a clearly nonmono-
I I I I I I I I I I I I I 1
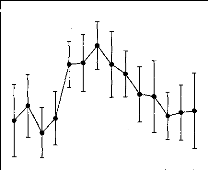
111111 I III 1111
6 12 18 24 30 36 42 48 54 60 66 72 78 84 90 Intensity (dB SL)
Figure 2. Intensity-discrimination limens (IDLs) as a
function of stimulus level in normal-hearing listeners. The stimulus level is
expressed in decibels SL on the abcissa. The mean IDLs across listeners are
expressed as Weber fractions in decibels on the ordinate. The error bars
represent the standard errors of the mean across listeners.
tonic shape characterized by a hump at intermediate
stimulation levels. The statistical significance of this midlevel hump was
indicated by a one-way repeated measures analysis of variance (ANOVA) performed
on the data with the IDL as the dependent variable and the stimulus level as
the independent variable, F(13, 91) = 2.02, p < .05. Post hoc
comparisons performed using the Student's paired t test with a
Bonferroni correction revealed that IDLs at 42 dB SL were significantly larger
than IDLs at 18 dB SL, t(7) = 3.28, p = .013, and 72 dB SL,
t (7 ) 8.06,p < .001.
Auditory Brainstem Responses
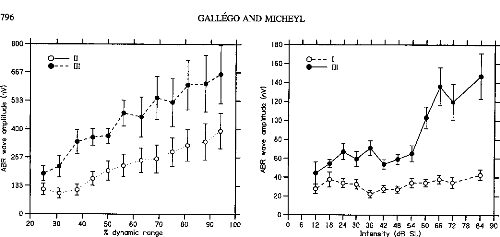
Figure 3 shows the peak amplitudes of ABR Waves II and III as
a function of stimulus level in CI listeners. ABR Wave
II and Wave III amplitude increased with stimulus level.
Repeated measures ANOVAs indicated a significant effect of stimulus level on
ABR Wave II and Wave III amplitudes: F(50, 10) = 8.39, p < .001,
for Wave II; F(50, 10) = 6.43, p < .001, for Wave III. The
monotonic growth functions of the two waves could be fitted with lines (slope =
0.14, R2 = .96 for Wave II; slope = 0.23, R2 = .98 for
Wave III). Figure 4 shows the latencies of Waves II and III in the CI
listeners. No significant dependency of Wave II amplitude on stimulus level was
observed. The latency of Wave III decreased slightly but significantly, F(50,
10) = 2.13, p < .05, as stimulus level increased.
Figure 5 shows the peak amplitudes of ABR Waves I and
III in the NH listeners. Contrary to what was observed in the
CI listeners, in the NH listeners Wave I amplitude did not significantly
increase with stimulus level. A significant dependency of Wave III amplitude on
stimulus level was indicated by a repeated measure ANOVA, F(77, 11) =
10.81, p < .001. However, the growth function relating Wave III
amplitude to stimulus level stagnated over a large range of intensities from 24
to 54 dB SL before showing a sharp increase. This was confirmed statistically
using a repeated measures ANOVA, which indicated no significant differences
between ABR Wave III amplitudes for stimulus intensities between 12 and 54 dB
SL, no significant differ-
Various ways of expressing intensity-discrimination thresholds
have been used in die literature. We used Weber fractions in decibels in this
study because this metric was used in most of the studies concemed primarily
with die departures from Weber's law. Furthermore, its adequacy for analyzing
data from cochlear implant listeners has recently been demonstrated (Nelson,
Schmitz, Donald- son, Viemeister, & Javel, 1996).
2 The specification of stimulus levels in terms of
percentages of the dynamic range radier than in decibels SPL in cochlear
implant listeners was motivated by results from the literature that suggest
that die Weber fractions for electrical stimulation are a function of the level
of the stimulus expressed in the percentage of dynamic range radier than in
decibels SL (Nelson, Schmitz, Donaldson, Viemeister, & Javel, 1996).
533 -
z
g 400'
w
267 -
ct
133 -
|
GALLÉGO AND MICHEYL
|
|
|
|
|
|
|
|
|
|
|
|
I
|
I I
|
I
|
I
|
I
|
I
|
1
|
I
|
I I 1 I I
|
|
|
|
180
|
|
|
|
|
|
|
|
|
|
|
|
|
|
|
160-
|
|
0- - - I
0- 111
|
|
|
|
|
|
|
|
|
|
|
|
|
|
|
|
|
140-
|
|
|
|
|
|
|
|
|
|
|
|
|
|
|
|
|
|
|
|
|
120-
|
|
|
|
|
|
|
|
|
|
|
|
|
|
|
|
|
|
|
-o
|
|
|
|
|
|
|
|
|
|
|
|
|
|
|
|
|
|
100-
|
|
|
|
|
|
|
|
|
|
|
|
|
|
|
|
E
|
|
|
|
|
|
|
|
|
|
|
|
|
|
|
|
|
w
>
|
80-
|
|
|
|
|
|
|
|
|
|
|
|
|
|
|
60-
|
|
|
|
|
|
|
|
|
|
|
|
|
|
40-
|
|
|
|
|
|
|
|
|
|
|
|
|
20-
|
|
|
|
|
|
|
|
|
|
|
I I
|
|
0
|
1
|
1 1
|
I
|
I
|
I
|
I
|
I
|
I
|
1 1 1 1 1
|
|
60 70 80 90 100
|
0 6
|
12 18
|
24
|
30
|
36
|
42
|
48
|
54
|
60 66 72 78 84 90
|
Intensity (dB SL)
0
20
1 1 I
30 40 50
% dynamic range
796
800
667 -
o-11
·- - - 111
Figure 3. Auditory brainstem
response (ABR) Waves II and Wave III amplitudes as a function of stimulus level
in cochlear implant listeners. The stimulus levels expressed as percentages of
the dynamic range on the abcissa are the same as in Figure 1. The mean
amplitude of each wave across listeners is expressed in nanovolts on the
ordinate. The hollow symbols correspond to Wave II. The filled symbols
correspond to Wave III. The error bars represent die standard errors of die
mean across listeners.
ences between ABR Wave III amplitudes for stimulus intensifies
between 60 and 84 dB SL, but statistically significant differences between ABR
Wave III amplitudes overall, F(11, 77) = 10.81, p <
.001. Post hoc mean
Figure 5. Auditory brainstem
response (ABR) Waves I and Wave III amplitudes as a function of stimulus level
in normal-hearing listeners. The stimulus levels expressed in decibels SL on
the abcissa are the sanie as in Figure 2. The mean amplitude of each wave
across listeners is expressed in nanovolts on the ordinate. The hollow symbols
correspond to Wave I. The filled symbols correspond to Wave III. The error bars
represent die standard errors of die mean across listeners.
comparisons evidenced a significant difference between ABR
Wave III amplitudes at 54 and 60 dB SL (Student's paired t test),
t(7) = 4.94, p <
.005.
Figure 6 shows the latencies of Waves I and III in die NH
0 6 12 18 24 30 36 42 48 54 60 66 72 78 84
90
Intensif y (dB SL)
1.80
2.30
- 2.23
0- Il
1.73-
0- - - III
-2.16
-2.09
- 2.02 e, -1.95 _
1.60
20 30 40 50 60 70 80 90 100
dynamic range
7/1
I I I I I I I I I I I I I I
2.60
4.10
-3.92
-3.74
-3.56 -S
- 3.38
-3.20 .-
=
- 3.02
- 2.84 cc
co
- 2.66 -2.48
2.30
f
2.42-
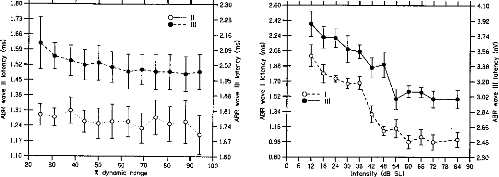
Figure 4. Auditory brainstem
response (ABR) Waves II and Wave III latencies as a function of stimulus level
in cochlear implant listeners. The stimulus levels expressed as percentages of
die dynamic range on the abcissa are die sanie as in Figures 1 and 3. Wave II
mean latencies across listeners are indicated in milliseconds on the left
ordinate. Wave III latencies are indicated on the right ordinate. The hollow
symbols correspond to Wave II. The filled symbols correspond to Wave III. The
error bars represent the standard errors of die mean across listeners.
Figure 6. Auditory brainstem
response (ABR) Waves I and Wave III latencies as a function of stimulus level
in normal-hearing listeners. The stimulus levels expressed in decibels SL on
the abcissa are die same as in Figures 2 and 5. Wave I mean latencies across
listeners are indicated in milliseconds on die left ordinate. Wave III
latencies are indicated on die right ordinate. The hollow symbols correspond to
Wave I. The filled symbols correspond to Wave III. The error bars represent die
standard errors of the mean across listeners.
listeners. The latencies of the two waves both decreased
highly significantly with increasing stimulus level: F(77, 11) =
25.02, p < .001, for Wave I; F(77, 11) = 14.75, p
< .001 for Wave III.
Discussion
The main finding of this study came from the comparison of IDL
functions between NH and CI listeners: Whereas in CI listeners IDL decreased
overall slightly with increasing intensity, in NH listeners IDLs were found to
be larger at midintensities. A second finding came from the comparison of the
ABR amplitude functions between NH and CI listeners: Whereas in CI listeners
the amplitude of ABR Waves II and III showed a grossly monotonie and regular
dependence on stimulus level, in NH listeners ABR Waves I and III amplitudes
did not significantly increase as a function of stimulus level over a large
range of levels, although the latencies of the corresponding waves did
significantly vary.
The observation that in CI listeners IDLs, expressed as Weber
fractions, decreased when stimulus intensity was increased over the whole
dynamic range is in overall agreement with results from several previous
studies on intensity discrimination with electric stimulation in humans (Nelson
et al., 1996; Shannon, 1983, 1992). Such a decrease in Weber fractions with
increasing stimulus intensity was initially observed in NH listeners and dubbed
a near-miss to Weber's law (McGill & Goldberg, 1968a, 1968b). The origin of
the near-miss to Weber's law is unclear. One hypothesis is that it cornes from
a broadening in the spread of excitation elicited in the peripheral auditory
system as intensity is increased (Viemeister, 1983, 1988a, 1988b). In NH
listeners, this level-dependent increase in the spread of excitation would
occur because of nonlinear cochlear mechanisms. In CI listeners, although
cochlear mechanisms are bypassed by direct electrical stimulation of the AN,
some form of nonlinear spread of excitation might still occur because of spread
of electrical current into the spiral ganglion (Nelson et al., 1996). In this
respect, it is noteworthy that the ABR results obtained in our study, in
agreement with the results from previous studies (Abbas & Brown, 1991), did
not show the increase in the rate of growth of Wave II amplitude that might be
expected if the rate of recruitment of AN fibers became larger at higher
stimulus levels. However, because the measured peak amplitude depended not only
on the number of units firing but also on the synchrony of the underlying
neural events (Goldstein & Kiang, 1958), one cannot rule out the
possibility that the expected increase in the rate of recruitment with
increasing stimulus intensity was compensated by a lower increase in
synchronization across units when more units were recruited.
A second important result of our study was the "midlevel hump"
in the Weber function in NH but not in CI listeners. An increase in Weber
fractions at midlevels comparable to the one observed in this study has been
reported in previous studies on intensity discrimination for clicks (Avakyan
& Radianova, 1963; Raab & Taub, 1969a).3 This effect,
however, failed to be replicated in a later study (Penner
& Viemeister, 1973). In more recent studies, even larger increases in Weber
fractions at midstimulation levels were found using short-duration,
high-frequency tone bursts (Carlyon & Moore, 1984, 1986a, 1986b; Long &
Cullen, 1986). Ultimately, large midlevel humps in intensity discrimination
were observed with tone bursts in the condition of forward masking (Zeng et
al., 1991). The origin of the increases in intensity discrimination
thresholds observed in these varions studies remains unclear, and whether these
effects share the same underlying mechanisms is uncertain. The psychophysical
measures of IDLs obtained by Raab and Taub (1969a) were compared with
recordings of the AN compound action potential in a companion study (Raab &
Taub, 1969b). The results indicated that the effect was already present at the
level of the AN, suggesting a peripheral origin. The studies by Carlyon and
Moore (1984, 1986a, 1986b) brought forward several arguments suggesting that
the midlevel hump observed with brief-duration, high-frequency tons originated
at the auditory periphery. A later study of this effect further suggested that
it could reflect the functioning of cochlear micromechanisms (Long &
Cullen, 1986). On the contrary, the midlevel humps in intensity discrimination
observed in nonsimultaneous masking conditions (Zeng & Turner, 1992; Zeng
et al., 1991) were suggested to have a central origin (Plack & Viemeister,
1992a, 1992b; Zeng & Shannon, 1995). However, the relation of such effects
to the effects obtained in unmasked conditions remain uncertain, and
interpretations relative to their origin appear less relevant in the framework
of this study. Therefore, to summarize, most, if not all, the data available in
the literature on midlevel humps in unmasked conditions point to a peripheral
origin.
The results of this study bring a new argument for this
hypothesis. The observation of a midlevel hump in DL functions in NH listeners
and the absence of this effect in CI listeners indeed suggests that the origin
of this effect is to be
3 The fact that the size of the effect obtained in
our study with click trains was comparable to that found in the previous study
using clicks in isolation (Raab & Taub, 1969a) is noteworthy. This
similarity of results suggests that the midlevel hump observed with isolated
clicks was not overridden by integrative processes operating in the time domain
when the stimulus was iterated. This result appears to be at variance with the
hypothesis--which might be put forward to account for the fact that midlevel
humps in intensitydiscrimination limens functions have generally been reported
with transient or short-duration stimuli but not with longer stimuli (Carlyon
& Moore, 1984)--that integrative processes operating with long-duration
stimuli may compensate for the paucity of both spectral and temporal
information present in short-duration stimuli, broad-bandwidth stimuli, or
both. Nevertheless, the low stimulus rate used in our study leaves open the
possibility that a multiple- looks mechanism, although possibly operating at
higher rates, was reset from one click in the train to the other. It has been
shown that clicks in a pair were integrated only when they were separated by
less than about 10 ms (Viemeister & Wakefield, 1991), which is well below
the 16.66-ms interval corresponding to the 60-Hz click train used in our
study.
798 GALLÉGO AND MICHEYL
individual nor at the group level, this final hypothesis remains
speculative.
4 The difference observed between the ranges of
auditory brainstem response (ABR) wave amplitudes in cochlear implant (CI) and
normal-hearing (NH) listeners may appear as a limitation to the validity of
direct comparisons between the ABR growth functions obtained in the two types
of listeners. However, note that the comparisons made in this study did not
regard the absolute amplitude of these waves but the way they varied as a
function of stimulus intensity throughout the perceptual dynamic range. The
intensities used to evoke ABRs and measure Weber fractions spanned the
perceptual dynamic range similarly in CI and NH listeners. The largest
amplitudes obtained in CI listeners were likely to have been caused by the fact
that direct electric stimulation of the AN elicited more synchronous discharges
across AN fibers than acoustic stimulation (Hartmann, Topp, & Klinke, 1984;
Javel, 1989; Parkins, 1989). It is not clear whether discharge synchrony across
fibers is a factor of perceived intensity.
References
Abbas, P. J., & Brown, C. J. (1991). Electrically
evoked auditory brainstem response: Growth of response with current level.
Hearing Research, 51, 123-137.
Avakyan, R. V., & Radianova, E. A. (1963). The special
features of differential intensity thresholds for a brief sound signal.
Sovietic Physical Acoustics, 8, 320-323.
Beliaeff, M., Dubus, R, Leveau, J. M., Repetto, J. C., &
Vincent, P. (1994). Sound signal processing and stimulation coding of the
Digisonic DX10 15-channel cochlear implant. In I. J. HochmairDesoyer & E.
S. Hochmair (Eds.), Advances in cochlear implants (pp. 198-203).
Vienna, Austria: Manz.
Carlyon, R. R, & Moore, B. C. J. (1984). Intensity
discrimination: A "severe departure" from Weber's law. Journal of the
Acoustical Society ofAmerica, 76, 1369-1376.
Carlyon, R. P., & Moore, B. C. J. (1986a). Continuons
versus gated pedestals and the "severe departure" from Weber's law. Journal
of the Acoustical Society ofAmerica, 79, 453-460.
Carlyon, R. P., & Moore, B. C. J. (1986b). Detection of
tones in noise and the "severe departure" from Weber's law. Journal of the
Acoustical Society ofAmerica, 79, 461-464.
Delgutte, B. (1987). Peripheral processing of speech
information: Implications from a physiological study of intensity
discrimination. In M. E. H. Schouten (Ed.), Psychophysics and speech
perception (pp. 333-353). Dordrecht, The Netherlands: Nijhoff.
Eggermont, J. J., & Don, M. (1980). Analysis of the
click-evoked brainstem potentials in humans using high-pass noise masking: II.
Effect of click intensity. Journal of the Acoustical Society of America,
68, 1671-1675.
Gallégo, S., Micheyl, C., Berger-Vachon, C., Truy, E.,
Morgon, A., & Collet, L. (1996). Ipsilateral ABR with cochlear implant.
Acta Otolaryngologica (Stockholm), 116, 228-233.
Gallégo, S., Truy, E., Morgon, A., & Collet, L.
(1997). EABRs and surface potentials with a transcutaneous multielectrode
cochlear
implant. Acta Otolaryngologica (Stockholm), 117,
164-168. Goldstein, M. H. Jr., & Kiang, N. Y. S. (1958). Synchrony of
neural activity in electric responses evoked by transient acoustic
stimuli. Journal of the Acoustical Society of America,
30,
107-114.
found at the level of peripheral auditory processes that are
present in NH listeners and bypassed in CI listeners, namely cochlear mechanics
and hair-cell transduction processes. A possible interpretation of the
relationship between the worsening of intensity-discrimination performances at
midintensities and the functioning of the cochlea cornes from indications that
the amplitude of basilar membrane motion grows more slowly with acoustic
stimulus amplitude at moderate than at low and high levels of stimulation
(Robles, Ruggero, & Rich, 1986; Yates, 1990). If stimuli are
discriminated in intensity on the basis of the difference in the discharge
rates they evoke in auditory neurons, as suggested by several studies
(Delgutte, 1987; Viemeister, 1983, 1988a, 1988b; Winslow & Sachs, 1988),
the degraded intensitydiscrimination performances observed at midievels in the
present and previous studies might be explainable in terms of cochlear
mechanisms, as previously suggested (Long & Cullen, 1986). That would also
explain that in CI listeners, cochlear mechanisms being bypassed by direct
electrical stimulation of the AN, no such worsening in intensitydiscrimination
performance was observed.
Another argument for a peripheral origin of the midlevel hump,
which may tentatively be brought forward on the basis of the physiological
results of our study, cornes from the observation of a difference between the
ABR wave growth functions in NH and CI listeners. That is, whereas the
amplitude of ABR Waves II and III increased regularly with stimulus level in CI
listeners, in NH listeners no significant increase in the amplitude of the ABR
waves was observed over a large range of moderate intensities.4 This
stagnation in ABR amplitude appears to correspond to the initial saturation
reported in a previous study on the dependence of ABR amplitude on stimulus
level in NH listeners (Eggermont & Don, 1980). The exaggerated flatness of
the growth functions shown here was attributable to the fact that near-zero ABR
amplitudes at die lowest stimulus levels were not displayed and to the use of a
linear y-axis scale radier than a logarithmic one, which would have expanded
the rapid amplitude increase at low stimulus levels. The absence of a
significant variation in ABR amplitude at moderate intensities in NH listeners
could not simply be attributed to insufficient measurement sensitivity because
marked variations in the latency of die same ABR waves over a corresponding
range of stimulus levels were observed. Under the hypothesis that differences
in stimulus intensity are encoded in the auditory system as differences in
overall neural activity, reduced variations in compound neural responses should
be related to reduced intensity discrimination performances. In this view, die
reduced dependency of ABR amplitudes on stimulus level observed in NH listeners
as compared with CI listeners may be tentatively related to the observation of
reduced intensity-discrimination performance at moderate levels in these NH
listeners. However, because no clear quantitative relationship between the
slope of the ABR functions and the intensity discrimination thresholds could be
established in our study, neither at the
Hartmann, R., Topp, G., & Klinke, R. (1984). Discharge
patterns of cat primary auditory fibers with electrical stimulation of the
cochlea. Hearing Research, 13, 47-62.
Javel, E. (1989). Acoustic and electrical encoding of temporal
information. In J. Miller & F. A. Spelman (Eds.), Cochlear implants:
Models of the electrically stimulated ear (pp. 247-
296). New York: Springer-Verlag.
Long, G. R., & Cullen, J. K. Jr. (1986). Intensity
difference limens at high frequencies. Journal of the Acoustical Society
ofAmerica, 78, 507-513.
McGill, W. J., & Goldberg, J. P. (1968a). A study of the
near-miss involving Weber's law and pure-tone intensity discrimination.
Perception and Psychophysics, 4, 105-109.
McGill, W. J., & Goldberg, J. P. (1968b). Pure-tone
intensity discrimination and energy detection. Journal of the Acoustical
Society ofAmerica, 44, 576-581.
Moore, B. C. J., & Raab, D. H. (1974). Pure-tone intensity
discrimination: Some experiments relating to the near-miss to
Weber's law. Journal of the Acoustical Society of America,
55,
1049-1054.
Nelson, D. A., Schmitz, J. L., Donaldson, G. S., Viemeister,
N. F., & Javel, E. (1996). Intensity discrimination as a function of
stimulus level with electric stimulation. Journal of the Acoustical Society
of America, 100, 2393-2414.
Parkins, C. W. (1989). Temporal response patterns of AN fibers
to electrical stimulation in deafened squirrel monkeys. Hearing Research,
41, 137-168.
Penner, M. J., & Viemeister, N. F. (1973). Intensity
discrimination: The effects of click bandwidth and background noise.
Journal of the Acoustical Society of America, 54, 1184-1188.
Phillips, D. P. (1987). Stimulus intensity and loudness
recruitment: Neural correlates. Journal of the Acoustical Society of
America, 82, 1-12.
Plack, C., & Viemeister, N. F. (1992a). The effects of
notched noise on intensity discrimination under forward masking. Journal of
the Acoustical Society of America, 92, 1902-1910.
Plack, C., & Viemeister, N. F. (1992b). Intensity
discrimination under backward masking. Journal of the Acoustical Society of
America, 92, 3097-3101.
Raab, D. H., & Taub, H. A. (1969a). Click-intensity
discrimination with and without background masking noise. Journal of the
Acoustical Society ofAmerica, 46, 965-968.
Raab, D. H., & Taub, H. A. (1969b). Fluctuations in N1
amplitude in relation to click-intensity discrimination. Journal of the
Acoustical Society ofAmerica, 46, 969-978.
Robles, L., Ruggero, M. A., & Rich, N. C. (1986).
Basilar
membrane mechanics at the base of the chinchilla cochlea.
Journal of the Acoustical Society of America, 80,
1364-1374.
Shannon, R. V. (1983). Multichannel electrical stimulation of
the auditory nerve in man: I. Basic psychophysics. Hearing Research, 11,
157-189.
Shannon, R. V. (1992). Temporal modulation transfer function
in patients with cochlear implants. Journal of the Acoustical Society of
America, 91, 2156-2163.
Shannon, R. V., & Otto, S. R. (1990). Psychophysical
measures from electrical stimulation of the human cochlear nucleus. Hearing
Research, 47, 159-168.
Viemeister, N. F. (1983). Auditory intensity discrimination at
high
frequencies in the presence of noise. Science, 221,
1206-1208.
Viemeister, N. E (1988a). Intensity coding and the dynamic
range
problem. Hearing Research, 34, 267-274.
Viemeister, N. F. (1988b). Psychophysical aspects of auditory
intensity coding. In G. Edelman, W. E. Gall, & W. M. Cowan (Eds.),
Auditory function (pp. 213-241). New York: Wiley.
Viemeister, N. F., & Wakefield, G. H. (1991). Temporal
integration and multiple looks Journal of the Acoustical Society ofAmerica,
90, 858-865.
Winslow, R. L., & Sachs, M. B. (1988). Single-tone
intensity discrimination based on AN rate responses in backgrounds of quiet,
noise, and with stimulation of the crossed olivocochlear bundle. Hearing
Research, 35, 165-190.
Yates, G. K. (1990). The basilar membrane input-output
function. In W. L. Madison, R Dallos, C. D. Geisler, J. M. Matthews, M. A.
Ruggero, & C. R. Steele (Eds.), The mechanics and biophysics of hearing
(pp. 106-113). New York: SpringerVerlag.
Zeng, E-G., & Shannon, R. V. (1994). Loudness coding
mechanisms inferred from electric stimulation of the human auditory system.
Science, 264, 564-566.
Zeng, F.-G., & Shannon, R. V. (1995). Possible origins for
the non-monotonic intensity discrimination function in forward masking.
Hearing Research, 82, 216-224.
Zeng, E-G., & Turner, C. W. (1992). Intensity
discrimination in forward masking. Journal of the Acoustical Society of
America, 92, 782-787.
Zeng, E-G., Turner, C. W., & Relkin, E. M. (1991).
Recovery from prior stimulation: H. Effects upon intensity discrimination.
Hearing Research, 55, 223-230.
Received September 2, 1997 Revision received January 9, 1998
Accepted January 28, 1998
dl PEAEP et reconnaissance phonétique
Des travaux (Hermann et al, 1992 ; Gallégo et a1,1997,
Groenen et al, 1997) ont montré qu'il était possible d'estimer
une partie de la reconnaissance des sujets implantés cochléaires
a partir de mesures électro-ph ysiolog igues.
Nous avons voulu évaluer la possible relation qu'il existe
entre les PEAEP et le reconnaissance sans lecture labiale sur une population de
17 implantés cochléaires.
|
|


