- Article 18 :
LOUDNESS GROWTH FUNCTIONS AND EABR CHARACTERISTICS IN
DIGISONIC COCHLEAR
IMPLANTEES
S. Gallégo, S. Garnier, C. Micheyl, E. Truy, A. Morgon,
L. Collet
Acta Otolaryngol, 1999, 119, 234-238
L'objectif de cet article est de comparer la fonction de sonie
aux caractéristiques des PEAEP.
Deux fréquences de stimulation sont analysées 75 et
300 Hz :
- Le 75 Hz correspond à une gamme compatible pour le
recueil de PEAEP,
- Le 300 Hz correspond à la fréquence
utilisée par le processeur pour coder le signal acoustique.
La mesure de la fonction de sonie est effectuée, par
une technique catégorielle à 7 niveaux (très faible,
faible, confortable mais faible, confortable, confortable mais fort, fort,
très fort), sur une électrode apicale à deux
fréquences de stimulation (75 et 300 Hz) chez 14 sujets implantés
cochléaires Digisonic.
Le recueil des PEAEP s'effectue chez la même population,
sur la même électrode à une fréquence de 75 Hz aux 7
niveaux de sonie calculés précédemment.
La comparaison entre les fonctions de sonie et la fonction
entrée/sortie des PEAEP montre qu' :
Il est possible de déterminer très
précisément le seuil de perception à 75 Hz et à 300
Hz à partir sur seuil d'apparition des PEAEP (respectivement, N=14,
R2=0.9, p<0.001, N=14, R2=0.9, p<0.001),
Il est possible d'estimer le seuil d'inconfort à 300 Hz
à partir de l'étude de la saturation de l'amplitude de l'onde V
des PEAEP à 75 Hz,
L'amplitude de l'onde V évolue de manière
linéaire du seuil de détection à 75 Hz jusqu'au seuil
d'inconfort à 300 Hz.
La détermination de la fonction de sonie et plus
particulièrement des seuils de détection et de confort à
300 Hz peuvent être estimer par l'analyse de l'onde V des recueils de
PEAEP.
Acta Otolaryngol (Stockh) 1999; 119:
Loudness Growth Functions and EABR Characteristics in Digisonic
Cochlear Implantees
S. GALLEGO
·, S. GARNIER', C. MICHEYL', E.
TRUY
·, A. MORGON2 and L. COLLET"
From the 'CNRS UPRESA 5020 Laboratory and 2ENT
Department, Par. U, Ed. Herriot Hospital. Lyon and the
311,IXM Laboratory, Vallauris, France
Gallego S, Garnier S, Micheyl C, Truy E, Morgon A, Collet L.
Loudness growth functions and EABR characteristics in Digisonic cochlear
implantées. Acta Otolaryngol (Stockh) 1999; 119: 000-000.
Electrically evoked auditory brainstem responses (EABRs) and
loudness functions were measured in 14 subjects equipped with an MXM Digisonic
cochlear implant. EABRs were evoked by 75-Hz pulse trains presented on the
apical electrode. Loudness functions at the same rate and at a rate more
conventional for psychoacoustic measurements (300 Hz) were measured using a
categorical loudness-scaling procedure. The results revealed a significant
difference in the loudness functions measured at 75 and 300 Hz, loudness
increasing more steeply with stimulus intensity for the latter rate.
Significant correlations between EABR wave V thresholds and perceptual
thresholds measured at both 75 and 300 Hi were observed. Furthermore, in 8 out
of the 14 patients, EABR wave V saturated at a stimulus level corresponding
precisely to the loudest bearable, i.e. "Too loud" level for the 300-Hz
stimulation rate: this same level corresponded to the "Comfortable" loudness
level for the 75-Hz stimulation rate. On average, an almost linear relationship
was observed over the first half of the loudness range between the stimulus
intensity, expressed as a pulse duration in log units, and wave V amplitude in
dB. Although further investigation is required before maximum comfort levels
can be predicted reliably from EABR measures in individual subjects, these
results indicate new directions regarding the estimation of perceptual dynamic
range limits on the basis of EABR measures in cochlear implantees. Key
words: Please supply Key Words.
pect EABR amplitude growth functions to be related to loudness
growth functions. However, so far, no clear relationship has been established
between EABR wave characteristics and UCLs or other aspects of the loudness
functions in CI subjects.
In the present study, we measured the EABR amplitude growth
functions and loudness growth functions in 14 subjects implanted with an MXM
Digisonic DX10 cochlear implant. In order to facilitate comparisons between
electrophysiological and psychoacoustical measurements, the same stimulus rate
of 75 Hz was used in the two types of measures. However, because this 75-Hz
rate is not generally used in normal conditions of implant functioning, we also
measured loudness functions at a 300-Hz stimulation rate, which is more
generally used in speech coding strategies with the Digisonic device.
MATERIAL AND METHODS Subjects
Fourteen subjects (6 female, 8 male) aged from 25 to 65 years,
implanted with the Digisonic DX10, took part in the study. They were ail
profoundly deaf before implantation.
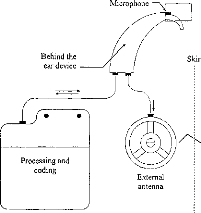
The Digisonic DX10 cochlear implant
The Digisonic DX10 is a 15-electrode transcutaneous cochlear
implant (4). The device comprises an external and an internai, i.e. implanted
part (Fig. 1). The external device performs an analysis of the acoustic
INTRODUCTION
An important step in cochlear implant (CI) fitting consists in
the measurement of the dynamic range of hearing in electric stimulation. This
dynamic range is bounded on one side by the faintest stimulus intensity that
the subject can perceive, or the threshold, and on the other side by the
maximum intensity that the subject can bear, which is otherwise called the
uncomfortable level (UCL). These lower and upper limits of the dynamic range
depend on several factors and are highly variable across subjects. Thus,
measuring these levels in the cochlear implant patient whose device is to be
set often is a necessary preliminary step in the fitting process.
Thresholds and UCLs can be determined using psychophysical
procedures in adults. However, these subjective procedures are generally
time-consuming, especially when accurate measurements are needed. Furthermore,
they cannot always be used in children. Therefore, they would advantageously be
replaced by objective measures.
Data in the literature indicate the existence of relationships
between electrophysiological variables and perceptual thresholds in CI
subjects. In particular, absolute thresholds have recently been shown to be
correlated to the thresholds of electrically evoked auditory brainstem response
(EABR) waves (1-3). If EABR thresholds are correlated to perceptual thresholds,
one might expect EABR saturation levels to be related to UCLs. Furthermore, one
might ex-
Scandinavian University Press. ISSN 0001-6489
signal, which leads to the extraction of relevant speech
information. This analysis mainly involves analog-to-digital conversion of the
acoustic signal at a sampling rate of 15.6 kHz and real-time FFT computation
over a 128-point analysis window. The resulting spectrum is composed of 64
frequency bands, 122 Hz wide each, within a 0-7.8 kHz range. The implanted part
of the device performs the decoding of the information received by the internai
antenna and stimulates the electrodes. With normal insertion of the electrode
array into the cochlea, the 15 electrodes are typically located 5-20 mm from
the base.
For EABR recordings and psychophysical measurements, the
external part of the device was replaced by a dedicated stimulation system, MXM
Digistim, which was piloted from a personal computer through an opto-isolated
serial port. This system allowed the control of the stimulus parameters:
stimulated electrode, pulse magnitude, pulse duration, and stimulation
frequency. Synchronization between the stimulation and EABR-recording systems
was âchieved using an external trigger pulse produced by the Digistim.
The stimulation mode used in this study was "Common Ground",
wherein only the addressed electrodes are activated, ail the other electrodes
being connected to ground (5). The electric stimuli were produced by a pulse
generator, which was able to deliver 0.5-3 mA. The pulses were of constant
amplitude, but variable duration. Pulse durations ranged between 5-500
sus. Pulses were delivered on the apical electrode. Two stimulation
rates were set: 75 and 300 Hz. The duration of the train pulse was 400 ms.
Loudness growth function measurements
Loudness growth functions were measured using a loudness
scaling procedure (6). Forty different stimulation levels, equally spaced
within the dynamic range, i.e. between the threshold and discomfort levels,
were presented to the subjects, three times, in random order. On each
presentation, the subject's task was to rate the loudness using one of the
following categories: (0) Inaudible, (1) Very soft, (2) Soft, (3) Comfortable
but soft, (4) Comfortable, (5) Comfortable but loud, (6) Loud, (7) Very loud,
(8) Too loud. Loudness functions were obtained by computing the average
stimulus intensity corresponding to each loudness category.
EABR recordings
EABR recordings were performed according to a method described
in previous publications (1, 3, 7). The electrodes were positioned according to
an Fpz placement plan, the ground electrode being placed on the contralateral
lobe. Full-scale sensitivity was set at 200 AT. Bandwidth was 10-3,000
Hz. The number of sweeps for trace averaging was set at 2,000. The analysis
window duration was 10 ms, corresponding to 1,024 points. The stimulation rate
was 75 Hz. Stimulus artefacts were cancelled out using adaptive digital
filtering (8). Fig. 2 shows typical EABR recordings obtained using this
method.
Microphone
·
Behind the ear device
Skin
·
Processing and
coding
MI
Implanted electrodes
CK:_){2{:}27.C
·DC}CliCaCD*1.--i
Internai
receptor
External
antenna
Fig. I. Block diagram of the DX10 Digisonic cochlear
implant. Information is transmitted from the speech processor to the internai
part on a carrier wave using amplitude modulation. The carrier frequency is 4
MHz.
PIII
PV
0.2 pV
1 ms
Pll
0 1
Fig. 2. Example of. EABR recording. Waves II, III and V
are iden2 3 4 5 6 7 8 tified.
tween the perceptual thresholds at there two frequencies.
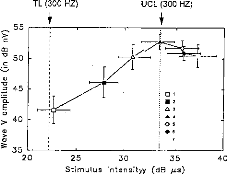
An important new result obtained in the present study is that
in 8 out of 14 patients, EABR wave V amplitude saturated at a stimulus level
corresponding precisely to the loudness level judged as "Too loud" by the
subjects with the 300-Hz stimulation rate. This "Too loud" level at 300 Hz
happened to correspond to the "Comfortable" level at 75 Hz. The relationships
between stimulus intensity, loudness and wave V amplitude are represented in
Fig. 6, with data averaged across the 14 subjects. It can be seen on this graph
that over the first half of the loudness range, i.e. over the first four
loudness levels at 75 Hz, there is an almost linear relationship between wave
V
RESULTS AND DISCUSSION
Loudness growth functions
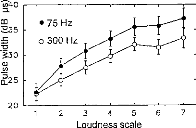
Fig. 3 shows functions relating pulse widths to loudness
categories. The results of a two-way repeated measures ANOVA revealed a
significant effect of stimulation rate (F 30.5, p < 0.001). Pulse
widths corresponding to a given loudness level were generally larger at 75 Hz
than at 300 Hz. An exception to this was that at the "Very soft" loudness
level, which corresponded to threshold, post hoc tests revealed no
significant effect of stimulation rate.
EABRs
--e40
025
20
2 3 4 5 6
Loudness scale
7
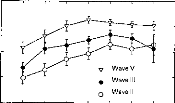
Fig. 4 shows EABR wave latencies as a function of stimulus
loudness. Waves II, III and V average latencies are in agreement with data from
the literature (9). As can be seen on the graph, EABR latencies were not very
sensitive to the loudness. The results of two-way ANOVA indicated no
significant effect of the loudness level on wave III and V latencies, but a
significant effect on wave II latency (F = 4.651, p < 0.001). Fig.
5 shows EABR wave amplitudes as a function of stimulus loudness. The results of
a twoway repeated measures ANOVA indicated a significant effect of loudness on
the amplitude of waves II (F = 5.19, p < 0.001), III (F = 6.751
p < 0.001) and V (F = 4.049 p < 0.001).
Fig. 3. Functions relating stimulus intensity and
loudness at two stimulation rates (75 and 300 Hz) averaged across the 14
cochlear implantees. The correspondence between numerical loudness scores on
the abscissa and verbal loudness categories is as follows: 1 Very soft, 2 =
Soft, 3 = Comfortable but soft, 4 = Comfortable, 5 = Comfortable but loud, 6 =
Loud, 7 = Very loud. Stimulus intensities are expressed as pulse widths in dB
units, i.e. 201og10 (pulse width in ps) on the ordinate. The error
bars represent the standard error of the mean.
In agreement with previous results (1-3), significant
correlations were observed between EABR wave V thresholds and perceptual
thresholds measured at 75 and 300 Hz (Pearson's r 0.9 p <
0.001, n= 14). This finding, that EABR thresholds correlated with
perceptual thresholds measured using the same stimulus rate (75 Hz), but also a
different rate (300 Hz) can be explained by the above-mentioned similarity
be-
|
4.5
4.0
g 3.5
c; 3.0 a.)
-5 2.5
o 2.0
1.5
|
|
2 3 4 5 6 7
Loudness scale
Fig. 4. Functions relating wave II, HI and V
latencies to loudness. The scale on the abscissa is the same as in Fig. 3. Data
are averaged across the 14 subjects; the error bars represent the standard
error of the mean.
amplitude in dB and stimulus intensity, i.e. pulse width in
log units. As can be seen on the graph, on average, the stimulus level at which
wave V amplitude saturated corresponded to the "Comfortable" loudness level at
75 Hz and to the "Too loud" or uncomfortable loudness level (UCL) at 300 Hz.
This relationship did not hold over the upper half of the loudness rate (beyond
the "Comfortable" loudness level) due to saturation of wave V amplitude.
CONCLUSION
The present results confirm and complement previous reports
indicating the existence of statistical relationships between EABR and
perceptual thresholds in subjects implanted with the MXM Digisonic cochlear
implant. A new element brought forward by the present study is that EABR wave V
amplitude obtained at a 75-Hz stimulation rate allows the prediction of not
only the absolute thresholds at this and
,-..., 60
cip
-a 50
a.) -a
40
E
° 30
o
e 20
2 3 4 5 6 7
Loudness scale
Fig. 5. Functions relating wave II, III and V
amplitudes to loudness. The scale on the abscissa is the same as in Fig. 4.
Data are averaged across the 14 subjects; the error bars represent the standard
error of the mean.
Fig. 6. Relationship between stimulus intensity,
loudness, and EABR wave V amplitude. The different loudness categories are
represented by different symbols. The graph is based on data obtained using a
75-Hz stimulation rate, averaged across the 14 subjects; the error bars
represent the standard error of the mean. The dotted lines correspond to the
threshold (left) and discomfort level (right) for the 300-Hz
stimulation rate.
TL (300 HZ)
UCL (300 HZ)
25 30 35
Stimulus intensityy (dB 1.1.$)
40
other frequencies, but also other components of the loudness
range. These include the following: the stimulus level deemed "Comfortable" by
the subjects at the same low rate (75 Hz) or the "Uncomfortable" level measured
with a higher rate (300 Hz), which is more conventionally used to convey
information to the auditory system of cochlear implantees. Further work is
certainly required before the statistical relationships between the
electrophysiological and perceptual variables evidenced here can be used at the
individual level for the fitting of the device.
ACKNOWLEDGMENTS
The authors acknowledge the support of the MXM Company, the
ANRT, the Hospices Civils of Lyon, the CNRS, the University Lyon I, and the
cochlear implantees who took part in the study.
REFERENCES
I. Gallégo S, Truy E, Morgon A, Collet L. EABRs and
surface potentials with a transcutaneous multielectrode
cochlear implant. Acta Otolaryngol (Stockh) 1997; 117:
164-8.
2. Truy E, Gallégo S, Chanal JM, Collet L, Morgon A.
Correlation between electrical ABR and perceptual thresholds in Digisonic
cochlear implants users. Laryngoscope 1997; 118: 554-9.
3. Gallégo S, Frachet B, Micheyl C, Truy E, Collet L.
Cochlear implant performance and electrically auditory brainstem response
characteristics. Electroencephalogr Clin Neurophysiol. In press.
4. Beliaeff M, Dubus P, Leveau JM, Repetto JC, Vincent P.
Sound processing and stimulation coding of Digisonic DX10 15-channel cochlear
implant. In: Hochmair IN, ed. Advances in cochlear implant. Innsbruck:
Verlag, 1994: 198-203.
5. Gallégo S, Ba Lê L, Berger-Vachon C.
Modelling of the electrical stimulation delivered by the Digisonic Multichannel
cochlear implant. Adv Model Anal 1998; 53: 1-15.
6. Jerger H, Olivier TA, Chmiel RA. Prediction of dynamic
range from stapedius reflex in cochlear implanted patients. Ear Hear 1988; 9:
4-8.
7. Gallégo S, Micheyl C, Berger-Vachon C, Truy E,
Morgon A, Collet L. Ipsilateral ABR with cochlear implant. Acta Otolaryngol
(Stockh) 1996; 116: 228-33.
8. Gallégo S, Collet L, Berger-Vachon C. Electrically
auditory brainstem responses (EABR): contribution of a
filter adapted to the auditory system. World Congress on
Medical Physics and Biomedical Engineering. Nice, 14-19 September 1997. Med
Biol Eng Comput 1997; 35 (Suppl 1): 304.
9. Abbas PJ, Brown CJ. Electrically evoked brainstem
potentials in cochlear implant patients with multi-electrode stimulation. Hear
Res 1988; 36: 53-162.
Address for correspondence:
Stéphane Gallégo
Sté MXM, 2720 chemin Saint Bernard 06227 Vallauris
Cedex
France
Tel: + 33 4 93 95 18 18
Fax: + 33 4 93 95 38 01
E-mail: s2allego@mxmlab.com
cl PEAEP et discrimination d'intensité
La mesure du seuil différentiel en intensité est
autant voir même plus important que la mesure de sonie, car elle va
déterminer la résolution du codage aux différents niveaux
en intensité (cf chapitre dl, enveloppe).
Des travaux chez le normo-entendant, n'ont pas pu reconstituer
la fonction de sonie à partir de la mesure de discrimination en
intensité car les mécanismes qui codent l'intensité de
stimulation sont multiples et non linéaires.
Des mesures de la sonie et du seuil différentiel en
intensité en fonction de la durée du pulse effectuées sur
le Digisonic n'ont pas montré d'irrégularités, ce qui
n'est pas le cas chez le normo-entendant (Raab et Taub, 1969). La
détermination des IDL a partir des PEAEP chez les sujets
implantés cochléaires semble donc possible.
| 

