IV/ PEAEP et psychophysique
Les études précédentes de ce chapitre ont
montré la possibilité d'obtenir des PEAEP et de les
caractériser en fonction de plusieurs paramètres de la
stimulation. D'après les résultats décrits, chacun de ces
paramètres varie de manière spécifique au sujet
testé.
Des études contenues précédentes mettent
aussi l'accent sur l'importance de la spécificité des contraintes
psychophysiques des sujets testés pour adapter le signal transmis via
l'implant cochléaire au système auditif.
L'objectif des travaux qui suivront sera d'évaluer la
possibilité de mesurer de manière objective, avec le recueil et
l'analyse des PEAEP, les contraintes psychophysiques du patient testé,
cela afin de développer des techniques objectives lors du réglage
qui ne font pas intervenir le patient.
a/ Apparition des PEAEP et seuils de
détection
Comme les mesures psychophysiques n'ont pas montré de
différences significatives des seuils de
détection en fonction
de la fréquence de stimulation de 50 à 1.000 Hz, non avons
étudier la
comparaison entre le seuil de détection à
une fréquence de stimulation de 300 Hz et l'apparition des
PEAEP ayant une fréquence de stimulation moindre (60
Hz). Des études préliminaires (Gallego et al, 1996, 1997) ont
montré sur une population réduite la possibilité d'estimer
les seuils de détection à partir des PEAEP.
- Article 17 :
CORRELATION BETWEEN ELECTRICAL AUDITORY BRAINSTEM
RESPONSE AND
PERCEPTUAL THRESHOLDS IN DIGISONIC COCHLEAR IMPLANT USERS
E. Truy, S. Gallego, J.M. Chanel, L. Collet, A. Morgon
Laryngoscope, 1998, 108, 554-559
L'étude des PEAEP en fonction de l'intensité de
stimulation montre qu'il est possible d'obtenir des PEAEP à faible
niveau de sonie. Nous avons comparé sur une population de 9 sujets
porteurs de l'implant cochléaire Digisonic l'apparition des PEAEP (pour
une stimulation de fréquence 60 Hz) avec les seuils de perception
subjectifs à la fréquence standard de 300 Hz (fréquence de
réglage). Nous avons effectué pour chaque électrode
testée un seuil sur au moins 12 niveaux d'intensité de
stimulation différents (de 12 à 32, la plupart du temps 16). Pour
chaque sujet, nous avons testé 3 à 4 électrodes
équiréparties. Au total 31 électrodes ont
été testées. Une comparaison sur les 31 électrodes
entre le seuil de détection et l'apparition des PEAEP montre une
corrélation statistiquement significative p<0.001 avec R=0.98
(l'unité est en ps). La relation qui lie le seuil de perception (300 Hz)
avec l'apparition des PEAEP (60Hz) explique 96 % de la variance
(R2). On peut modéliser cette corrélation par une
fonction linéaire telle que Seuil_Détection = 0.22 + 1.06 x
Apparition_PEAEP. Le seuil d'apparition des PEAEP survient donc en moyenne au
même niveau ou a un niveau légèrement supérieur au
niveau de perception subjectif.
The Laryngoscope
Lippincott--Raven Publishers, Philadelphia (c) 1998 The American
Laryngological, Rhinological and Otological Society, Inc.
Correlation Between Electrical Auditory
Brainstem Response and Perceptual
Thresholds in Digisonic Cochlear
Implant Users
Eric Truy, MD; Stéphane Gallego, MSc; Jean-Marc Chanal,
MSc; Lionel Collet, MD, PhD; Alain Morgon, MD
Objectives: To examine the relationships
between psychophysical perceptions and the electrically evoked auditory
brainstem responses (EABRs) in multichannel cochlear implant (CI) users and to
determine the effectiveness of EABRs in electrode failure. Design:
A descriptive study reported the EABR characteristics while the
different electrodes were activated. Characteristics of the EABR and of the
perceptual measures served as compared variables in a correlational study.
Setting: The study was carried out in the audiology
clinic of an otolaryngology department at a university hospital.
Patients: The subjects consisted of vine
consecutively selected habitual Digisonic DX1OR multichannel CI users. Seven
patients were postlinguistically deafened adult patients; two were congenitally
deaif children. Main Outcome Measures: Ipsilateral
recordings were performed using a previously published method. Morphology,
latency, and amplitude measures of the EABR recordings were described,
computed, and compared with the literature data for EABRs obtained while
activating other types of CI and for acoustically evoked ABRs. Correlations
between EABRs and behavioral perception thresholds were analyzed using the
parametric Pearson's correlation test. Results: EABRs
allowed the authors to detect failure of no. 10 electrode integrity in one
child. Perceptual thn-shold measures were fo und to be highly significa iy
related to the EABR threshold across subjects and electrode position (n = 31,
r = 0.98; P < 0.001;
linear regression equation: perceptual threshold = 1.06 EABR threshold + 0.76).
The latencies and amplitudes were found to be similar to those described in the
literature. Conclusions: EABRs may be used to
estimate settings
From the Department of Otorhinolaryngology (E.T., J-M.C, L.C.,
A.M.), de Chirurgie Cervico-Faciale et de Phoniatrie, Hôpital Edouard
Herriot, Lyon, ?rance; and the Laboratoire "Perception et Mécanismes
Auditifs" (E.T., S.G., J-nc., L.c.), Lyon, France.
Editor's Note: This Manuscript was accepted for publication June
9,
1997.
Laryngoscope 108
· April 1998 Truy et al.:
Cochlear Imprants
Send Reprint Requests to Eric Truy, MD, Professor,
Département d'Oto-Rhino-Laryngologie, de Chirurgie Cervico-Faciale et de
Phoniatrie, Hôpital Edouard Herriot, Place d'Arsonval, 69437 Lyon, Cedex
03, France. for the Digisonic DX10 CI even in a pediatric population,
although they cannot entirely replace behavioral measurements, especially in
children. The EABR can be employed for electrode dysfunction diagnosis. Further
studies are needed to determine whether recordings of EABR quality could
contribute to the evaluation of functional prognosis during the rehabilitation.
Key Words: Cochlear implant, electrically elicited
auditory brainstem responses, human, objective measures, tuning
aids.
Laryngoscope, 108:554-559, 1998
INTRODUCTION
Cochlear implantation has proven highly effective in adults
and children, when suitable candidates are selected. The success of a cochlear
implantation may be related to the degree of neural survival. It has been
demonstrated that the major factor influencing neural survival is the duration
of the deafness.1,2 Studies have demonstrated that there is a
correlation between the number of surviving spiral ganglion tells and the
quality of the electrically evoked auditory brainstem responses (EABRs) in the
deafened cat.3
Preoperatively, effective assessment is needed to estimate the
potential benefit. Different tests are required to indicate or counterindicate
cochlear implantation in a given candidate. Electrical tests have been proposed
to estimate neural survival. The promontory electrical stimulation test is
crude: it consists in eliciting psychoacoustic responses in alert adults, but
it cannot be used in most children. Its results are not reliably predictive of
postoperative performances in cases of long-term deafness in postlinguistically
deafened adults. The use of EABR,4 of electrically evoked middle
latency responses (EMLRs),5-7 and of electrically evoked
stapedius reflex8 has been reported. Objective mea- sures further
provide information according to ear selection and device selection.
Postoperatively, the stimulus artifact can be recorded, as a
means of detecting electrode failure. Measurement of the average electrode
voltage has been pro-
posed to improve stimulus artifact recording.9 EABR
can be used to evaluate cochlear implant (CI) functioning. 10,11 The
relationship between postoperative behavioral and preoperative objective
measures is not strongly significant on statistical analysis: the objective
thresholds are higher than the perceptual ones.11 Postoperatively,
condition, device fitting, and rehabilitation are very important stages that
must be optimized to get the best results. Thus all potential ways of better
adapting the implant's electrical to the subject's surviving individual
electrophysiologic properties are very important to consider. The C-level
(comfort threshold) and the T-level (threshold of perception) need to be
determined Determining thresholds in young children is difficult; to date,
especially in pediatric populations, only behavioral perceptual measures are
used. Therefore EABR has also been proposed as a tool for device-fitting
procedures. The presence of an EABR indicates not only that the device is
functioning, but also that the patient is receiving auditory information. EABRs
obtained from subjects implanted with various types of intracochlear
multichannel devices have been reported. 4,12-14 To be able to
consider EABRs as a new tool for estimating CI thresholds, we have to
demonstrate that relationship between behavioral perceptual measures and EABR
threshold. The postoperative electrically evoked stapedius reflex threshold has
been demonstrated to cor- relate with the T-level threshold.15
Cortical potentials (P300, topographic brain mapping, and mismatch negativity)
can be recorded during CI functioning but to date have been proposed as a
research tool only in populations, not in individuals.
The questions to be answered in our study were the following:
1. Can EABRs be reliably recorded through the Digisonic DX10 CI? and
2. Can the EABR provide information helpful in fitting the device in
adults and children?
PATIENTS AND METHODS Patients
Seven postlinguistically deafened adults and two congenitally
deaf children participated in the investigation. All were Digisonic DX10 CI
(MXM Laboratories; Antibes, France) users. The ages of the seven adults ranged
from 30 to 69 years at the date of implantation, and the two children were ages
4 and 5 years at the date of implantation. The etiologies were variable,
including sudden deafness (n 1), trauma (n = 2), progressive genetic
degenerative deafness (n = 1), otosclerosis (n = 1), progressive deafness of
unknown origin (n = 2), and congenital deafness of unknown origin (in the two
children). The duration of the profound or total deafness in the adults ranged
from 2 to 5 years. Experience with the CI ranged from a minimum of 12 months to
a maximum of 2 years and 6 months. All the patients but two had a total
insertion (15 active electrodes with the Digisonic DX10 device); the two
patients with partial insertion (patients B.RI. and
J.B.F.) having, respectively, two and four active
electrodes.
Methods
Laryngoscope 108: April 1998 Truy et al.: Cochlear Implants
Behavioral perceptual threshold recordings.
Behavioral measures were obtained using a standard procedure in which the
electrodes are stimulated by electrical impulses delivered through the
individual wearable speech processor. Perceptual measures (T-level, C-level)
were obtained for all active electrodes, the stimulation frequency rate being
300 Hz. Responses were recorded in the arbitrary device programming units.
Postlinguistically deafened, and judged intelligent and cooperative, all adult
patients were considered reliable according to their auditory percepts. In the
children, thresholds were determined by a derived visual reinforcement
audiometry technique.
EABR recordings. EABR recordings and behavioral
measurement were performed for each subject in a single session.
The techniques of stimulation and of EABR recording have been
previously described16; we will briefly report it again. The
electrical stimulus was generated using a manufacturer-built interface device
(Digistim system, MXM Laboratories; Antibes, France) connected to a personal
computer via a serial port. This system served to trigger the evoked potential
measurement system (Nicolet Pathfinder II).
The programming setup uses arbitrary units rather than pulse
duration units to represent the intensity levels delivered. The stimulus
frequency rate is 60 Hz. Since the same processor was used in all test
conditions across subjects, its arbitrary units reliably represent stimulus
level.
Gold disk electrodes were placed on the ipsilateral earlobe
(Al position for a left ear, and A2 position for a right ear) and forehead (Fpz
position) of the subject. This placement enabled ipsilateral recording.
In adults, EABRs were recorded in a quiet room with the
patient lying supine. In the two children, EABRs were recorded after light
barbiturate-induced sedation (Nembutal 2 mg/kg body weight, intrarectally).
The recording parameters were as follows: three averagings of
256 sweeps, 100-jaV sensitivity, analog band-pass filtering from 0.2 to 8000
Hz, 10-millisecond analysis time, 521-point window, and 50-kHz sampling
frequency. The sensitivity of the Nicolet Pathfinder II was set to a 100-11V
threshold. The first 400 microseconds of the EABR signal were excluded, to
eliminate stimulus artifact. The signal was then filtered with a digital
band-pass of 300 to 3000 Hz. The recording duration was 10 milliseconds per
sweep. The 3 x 3 intercorrelation matrix was then computed to eliminate the
most exceptional curves. The remaining curves were summed and averaged.
The first recording was made at perceptual comfort level;
recording was repeated with step-by-step decreases in current intensity until
the response disappeared.
The EABRs were analyzed for waves II, III, and V
identification, EABR threshold, and waves II, III, and V amplitudes. Wave
identification employed strong criteria. The analysis was performed by an
independent electrophysiologist, using the gen-
1 2 3 4
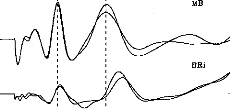
Fig. 1. Two exemples of electronically evoked auditory
brainstem response (EABR) recordings in two different patients. Good
intraindividual reproducibility is evident, as are the possible variations of
amplitudes and latencies of waves II, III, and V.
eral morphologie criteria for ABR wave identification proposed
by Picton et al.17 These criteria were adapted to the peculiarities
of electrically evoked ABRs, as described in the literature: the electrically
elicited response occurs approximately 2 milliseconds earlier than with
acoustic stimulation. We included only reproducible waves on each of two
recordings.
Statistical Analysis
The possible relationship between the behavioral threshold and
the EABR threshold was examined using a parametric Pearson's correlation test
(P-to-reject-correlation 0.05): the higher the r value, the better the
correlation.
RESULTS
Morphology, Amplitudes, and
Latencies
EABRs were able to be recorded from all the subjects. Figure 1
shows two examples of EABR in two different patients. These two examples
demonstrate the good quality of the curves obtained and the good
intraindividual reproducibility on test-retest evaluation (the second session
being performed 6 weeks later). Wave latency and amplitude could differ across
subjects. It is noteworthy that the performance of these two subi ects had
changed markedly after 6 months' rehabilitation. (Open-set word recognition was
44% in patient M.B. and 22% in patient B.Ri., with CI alone, without the aid of
lip reading.)
Behavioral and EABR measurements could be obtained from 55 of
a total of 56 electrodes. In patient A.M., we were able to obtain neither EABR
(Fig. 2) nor behavioral measures for electrode no. 10; we concluded that there
was failure of this electrode.
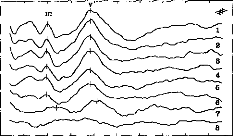
Figure 3 shows EABR recordings in the child (patient A.M.)
stimulus intensity (arbitrary device units) decreased from level 1 to level 8.
These curves were reproducible for each level of stimulus current intensity;
the higher the intensity, the greater the various wave amplitudes. Three peaks
are well identified: the first is that of w ie II (at about 1.25
milliseconds), the second of wave III (at about 2 milliseconds), and the third
of wave V (at about 3.8 milliseconds).
0 1 2 3 4 5 6 7 8
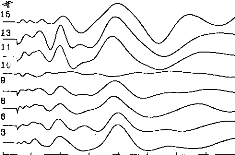
Fig. 2. EABR recordings in child patient. Among the eight
tested electrodes, we could not obtain any response in only one case (no. 10).
The stimulus artifact has been eliminated from the various recordings.
TABLE I.
Mean Latency Values and Mean Amplitude Values.
|
Means (ms) (DS)
|
Amplitudes (gV) (DS)
|
|
Wave II
|
1.28
|
(0.18)
|
0.24
|
(0.10)
|
|
Wave III
|
2.06
|
(0.19)
|
0.43
|
(0.16)
|
|
Wave V
|
3.90
|
(0.27)
|
0.37
|
(0.13)
|
Table I reports mean amplitude and latency for the various
waves; the intervals between the waves are also reported.
Thresholds
Thresholds were able to be determined for all patients.
Figures 4 and 5 show two examples. We looked for a possible correlation between
objective threshold (determined by EABR) and subjective T-level threshold
(determined by perceptual measurement). It is worth emphasizing once again the
great difficulty of determining behavioral T- and C-level thresholds in
pediatric patients soon after implantation. Subjective (ST) and objective (OT)
threshold values were expressed in arbitrary device units, and then compared by
Pearson's correlation testing. The correlation coefficient found was excellent
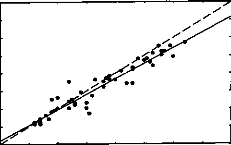
(n = 31, r = 0.98; P < 0.001). The scatterplot
illustrating this strongly positive linear relationship is presented in Figure
6. The simple regression equation (OT = 1.06 x ST + 0.22) further attests to
the strength of the relationship. This also means that the objective thresholds
underestimate perceptual thresholds, although the corrective factor is weak;
the regression equation approximates y = X.
DISCUSSION
These results demonstrate the possibility of goodquality EABR
recordings in Digisonic DX10 CI users, both adults and children.
EABR Compared With ABR
Our results agree with numerous previous published data showing
earlier latencies with EABR than
0 1 2 3 4 5 6 7 8 9 10
IChildren Threshold : Patient MOI
Fig. 3. EABR in child patient. Eight levels of stimulation are
shown for electrode no. 7, decreasing from level 1 to level 8.
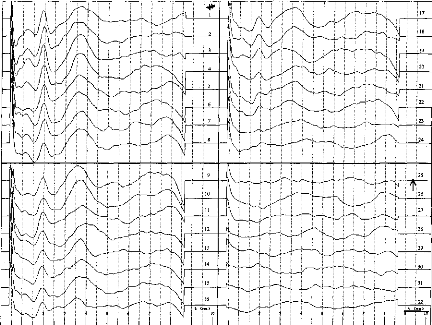
Fig. 4. EABR recordings in adult patient. Thirty-two decreasing
levels of stimulation are shown for electrode no. 10. The EABR threshold is
identified where waves III and V vanish simultaneously (level 25).
with ABR.18-20 This is easily explained
by the direct stimulation of the acoustic nerve without delay attributable to
travel through the outer and the middle ear. With acoustic stimulation in
nondeaf patients, wave II is recorded with a mean 2.90-millisecond (#177;0.22)
delay, wave III with a mean 3.84-millisecond (#177;0.20) delay, and wave V with
a mean 5.60-millisecond (#177;0.20) delay21; other studies have
reported quite similar delays: respectively, 2.92, 3.95, and 5.85 milliseconds
for waves II, III, and V.22 In our experiment with EABR, wave II was
observed with a mean 1.20-millisecond (#177;0.14) delay, wave III with a mean
1.89-millisecond (#177;0.20) delay, and wave V with a mean 4.09-millisecond
(#177;0.26) delay. Interwave delays were identical to those recorded with
acoustical stimulation in non-deaf subjects: wave II to wave III delay is 1.03
milliseconds, wave II to wave V delay is 2.81 milliseconds, and wave III to
wave V delay is 1.89 mil
TABLE II.
Mean Values of Interwave Intervals.
Delays (ms)
Wave II-wave III 0.78
Wave II-wave V 2.61
Wave III-wave V 1.84
Laryngoscope 108: April 1998 Truy et al.: Cochleadments
liseconds with acoustic stimulation22 and were,
respectively, recorded with 0.78-, 2.61-, and 1.84-millisecond latencies in our
study. Table I presents these data.
In our patients the disappearance of waves III and V (defining
objective threshold) was concomitant and without prior increase in the
latencies of these waves, as mentioned. With acoustic stimulation, wave III
disappears before wave V and latencies increase, with an updown procedure.
Tuning Aid Procedures
EABR can be affected by factors such as number of sweeps and
subject state. The maps used in this study were obtained using standard
clinical techniques with routine stimulation parameters and were the actual
maps used by the subjects in their everyday rehabilitation program.
The correlations between subjective and objective thresholds
were strong. The present data are the first published on Digisonic patients;
other data have essentially concerned the Nucleus device.23,24 These
studies reported good but not perfect correlation coefficients (r
value of 0.89 in Hodges et a1.24); Shallop et al.25
found EABR thresholds to approximate C-levels, although with several instances
where EABR threshold exceeded Clevel by more than 20 device units. Brown et
al.10 found that the majority of EABR thresholds fell between 30%
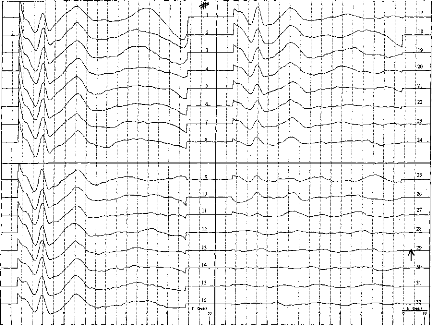
Fig. 5. EABR recordings in adult patient. Thirty-two decreasing
levels of stimulation are shown for electrode no. 14. The EABR threshold is
identified where waves III and V vanish simultaneously (level 29).
and 80% of dynamic range, and that only four EABR thresholds
of a total of 115 exceeded C-level, and in no case by more than five device
units. Mason et al.11 found EABR thresholds to exceed T-level by an
average of 35 units; results reported by Brown et al.10 are
consistent
0 10
Perceptual Threshold
20 30
(equipment--determined units)
ABR Th.= 0.22 + 1.06 Per.Th. N = 31
R = 0.98 P< 0.001
·
· -
·
!je _
·
E 35 t
'e 30
o
D-
o
c
c
E. _
a
· c
*c* 20
E
o
0
co
25
15 10 5
Fig. 6. Scatterplot and linear regression equation showing the
relationship between behavioral thresholds (BTs) and EABR thresholds (objective
thresholds [OTs]). Symbols represent the data obtained from seven adult
cochlear implant users. The continuous line is the linear regression curve, and
the dotted line plots the y = x equation.
with these data. In these two
studies,1°,11 it is reported that on average the
difference between EABR threshold and T-level is somewhat greater for adults
than for children, because T-levels found in children may be slightly above
threshold. More data are needed, from a larger pediatric Digisonic-implanted
population, to compare adult and pediatric EABR thresholds. We did not record
any preoperative EABRs to be compared with postoperative EABRs, as reported in
some studies. Mason et al.11 described preoperative EABR in
children, but linear regression analysis revealed no strong correlation between
preoperative EABR threshold and postoperative behavioral threshold
measurements: objective threshold overestimated subjective threshold levels.
Objective threshold measurement is obviously of major
importance in pediatric populations. We insist on the fact that, in the
procedure described, the stimuli employed to evoke the EABRs are strictly the
same as those delivered in auditory conditions during rehabilitation. This is
one of the major differences with EABRs obtained through the Nucleus
device'1; EABR stimulation modes described include bipolar mode (BP)
+5, +10 or +20, which are very different from those of normal implant
functioning (BP or BP + 1). Abbas and Brown26 reported a good
correlation between subjective and objective thresholds using BP + 5 strategy
in Nucleus CI users and in Ineraid CI users.
Electrode Dysfunction Diagnosis
In our sample we only obtained no artifact or EABR in the case
of one electrode. This electrode dysfunction was confirmed by the absence of
any signal when we used the stimulogram method, as described by other
authors,27 and the average electrode voltage method.28
These two techniques are easy to perform and recordings are short, that no
sedation is needed in adults or children. They can be easily employed during
surgery to assess implant functioning. The average electrode voltage is a
refined artifact recording method.
CONCLUSION
Different procedures are employed or assessed to evaluate the
electrophysiologic responses evoked by a CI. We advocate the rapid development
of objective methods in pediatric populations, which may provide useful
information for tuning in children.
BIBLIOGRAPHY
1. Moore D. Postnatal development of the mammalian central
auditory system and the neural consequences of auditory de- privation. Acta
Otolaryngol Suppl (Stockh) 1983;421:19-30.
2. Webster DB, Webster M. Effect of neonatal conductive
hearing loss on brain stem auditory nuclei. Ann Otol Rhinol Laryngol
1979;88:684-98.
3. Hall RD. Estimation of surviving spiral ganglion cells in
the deaf cat using the electrically evoked auditory brainstem responses.
Hear Res 1990;45:123-36.
4. Lambert PR, Ruth RA, Hodges AV. Multichannel cochlear
implant and electrically evoked auditory brainstem responses in a child with
labyrinthitis ossificans. Laryngoscope 1991;101:14-9.
5. Burton MJ, Miller JM, Kileny PR. Middle latency responses.
Part I. Electrical and acoustic stimulation. Arch Otolaryngol Head Neck
Surg 1989;115:432-457.
6. Burton MJ, Miller JM, Kileny PR. Middle latency responses;
Part II. Variations among stimulation sites. Arch Otolaryngol Head Neck
Surg 1989;115:458-63.
7. Truy E, Morgon A, Collet L, et al. Is round-window
electrical test possible in children? Ado Otolaryngol
1993;48:114-9.
8. Jerger JF, Jenkins H, Fifer R, Mecklenburg D. Stapedius
reflex to electrical stimulation in a patient with cochlear implant. Ann
Otol Rhinol Laryngol 1989;95:151-7.
9. Heller JW, Sinopoli T, Fowler-Brehm N, Shallop JK. The
characterization of averaged electrode voltages from the Nucleus cochlear
implant. Proc Ann Int Conf IEEE 1992;13:1902-8.
10. Brown CJ, Abbas PJ, Fryauf-Bertschy H, Kelsay D, Gantz
BJ. Intraoperative and postoperative electrically evoked auditory brainstem
responses in nucleus cochlear implant users: implications for the fitting
process. Ear Hear 1994; 15(2):168-76.
11. Mason SM, Sheppard S, Garnham CW, Lutman ME, O'Donoghue
GM, Gibbin KP. Improving the relationship of intraoperative EABR thresholds to
T-level in young children receiving the Nucleus cochlear implant. In:
Laryngoscope 108: April 1998
Truy et al.: Cochlear Implants
Hochmair-Desoyer IJ, Hochmair ES, eds. Advances in
Cochlear Implants. Wien: Manz; 1993:44-9.
12. Allum JH, Shallop JK, Hotz M, Pfaltz CR. Characteristics
of electrically evoked auditory brainstem responses elicited with the Nucleus
22-electrode intracochlear implant. Scand Audiol 1990;19:263-7.
13. Gardi JN. Human brain stem and middle latency responses
to electrical stimulation: preliminary observations. In: Schindler RA,
Mezernich MM, eds. Cochlear implants. New York: Raven; 1985:351-63.
14. Shallop JK, Beiter AL, Goin DW, Mischke RE. Electrically
evoked auditory brainstem responses (EABR) and middle latency responses (MLR)
obtained from patients with the Nucleus multichannel cochlear implant. Ear
Hear 1990; 11(1):5-15.
15. Hodges AV. The relationship between electric auditory
evoked responses and psychophysical percepts obtained through a Nucleus
22-channel cochlear implant. Charlottesville, VA: University of Virginia, 1990.
Dissertation.
16. Gallego S, Micheyl C, Berger-Vachon C, Truy E, Morgon A,
Collet L. Ipsilateral ABR with cochlear implant. Acta Otolaryngol (Stockh)
1996;116:1604-10.
17. Picton TW, Hillyard SA, Krausz HI, Gallambos R. Human
auditory evoked potentials. Part I. Evaluation of components.
Electroencephalogr Clin Neurophysiol 1974;36:179-190.
18. Pelizzone m, Kasper A, Montandon P. Electrically evoked
responses in cochlear implant patients. Audiology 1989;28: 230-8.
19. Van Den Honert C, Stypulkowsky PH. Characterization of
the electrically evoked auditory brainstem response (ABR) in cats and in
humans. Hear Res 1986;21:109-26.
20. Abbas PJ, Brown CJ. Electrically evoked brainstem
potentials in cochlear implant patients with multi-electrode stimulation.
Hear Res 1988;36:153-62.
21. Harkins SW. Effects of age and interstimulus interval on
brainstem auditory evoked potentials. Int J Neurosci 1981;
15:107-18.
22. Stockard JJ. Nonpathologic factors influencing brainstem
evoked auditory potentials. Am J Electroencephalogr 1978;
18:177-209.
23. Kileny PR, Zwolan TA, Zimmerman-Phillips S, Telian SA.
Electrically evoked auditory brain-stem responses in paediatric patients with
cochlear implants. Arch Otolaryngol Head Neck Surg
1994;120:1083-90.
24. Hodges AV, Ruth RA, Lambert PR, Balkany TJ. Electric
auditory brain-stem responses in Nucleus multichannel cochlear implant users.
Arch Otolaryngol Head Neck 1994;120:1093-9.
25. Shallop JK, Van Dyke L, Goin DW, Mischke RE. Prediction
of behavioral thresholds and comfort values for Nucleus 22- channel implant
patients from electrical auditory brainstem response test results. Ann Otol
Rhinol Laryngol 1991;100:896-8.
26. Abbas PJ, Brown CJ. Electrically evoked auditory
brainstem responses: growth of response with current level. Hear Res
1991;51:123-137.
27. Almqvist B, Harris S, Jôsson KE. The stimulogram.
In Hochmair-Desoyer IJ, Hochmair ES, eds. Advance in cochlear implants.
Wien: Manz; 1993:33-6.
28. Shallop JK. Objective electrophysiological measures from
cochlear implant patients. In Hochmair-Desoyer IJ, Hochmair ES, eds.
Advances in Cochlear Implants. Wien: Manz; 1993:21-5.
Comme le montre la figure 101, une étude plus extensive
portant sur 22 sujets au lieu de 9 retrouve cette corrélation.
5 10 15 20 26 30 35
EABR Threahold (608
·10
Figure 101 : Relation entre le seuil de
détection subjectif à 300 Hz et le seuil d'apparition des PEAEP
à
60 Hz pour une population de 22 sujets implantés
cochléaires Digisonic.
Les études utilisant d'autres types d'implant
cochléaire qui ont voulu comparer les seuils de perception (à la
fréquence de stimulation du réglage) aux seuils d'apparition des
PEAEP (à une fréquence plus basse) n'ont pas trouvé de
fortes corrélations (Brown et al 1994, Abbas et Brown, 1991 ; Mason et
al, 1994, Brown et al, 1999). Le fait que le seuil de perception à 300
Hz soit très fortement corrélé au seuil d'apparition des
PEAEP (R2=0.96) sur l'implant cochléaire Digisonic est
intéressant. Il est possible d'utiliser les PEAEP pour le réglage
de l'implant cochléaire. Ils permettent non seulement de voir si la
stimulation électrique sur une électrode provoque une
réponse du système auditif mais aussi de mesurer objectivement
l'intensité minimale de stimulation pour laquelle le patient aura une
sensation auditive (ce qui est très difficile à obtenir chez les
enfants et adultes mal conditionnés). De plus le seuil d'apparition des
PEAEP est très proche du seuil de perception à 300 Hz. Cela peut
s'expliquer pour plusieurs raisons. Le seuil de perception sur l'implant
cochléaire Digisonic est très stable pour les fréquences
comprises entre 50 et 1000 Hz (cf partie psychophysique). La technique de
recueil et de traitement numérique des PEAEP permet d'obtenir des PEAEP
dans des conditions extrêmes (bruit physiologique et instrumental
fortement réduit). La durée du pulse est utilisée pour
faire varier l'intensité de stimulation ; au seuil la synchronisation
est très importante car la durée du pulse est de l'ordre de 5
à 30 ps.
PEAEP et sonie
Bien que les seuils d'inconforts diffèrent en fonction
de la fréquence de stimulation, nous avons étudier les relations
qu'il pourrait exister entre la fonction de sonie à 300 Hz et les
caractéristiques entrée-sortie des PEAEP à 75 Hz.
| 

