2.1. Evolution of gross consumption expenditure in Rwanda
1995-2015
James Duesenberry (1946) in his relative income hypothesis
rejected the fundamental assumption of consumption theory of Keynes. He
challenged the assumption of the independence of individual's consumption and
postulated interdependence in consumption behavior. He posited that consumption
behavior is not independent but interdependent on the behavior of every other
individual. He explained that people do not only derive satisfaction from
consumption but also from how the consumption compares with that of others.
(Ahuja: 2013).
As such, the relative size of a household income to that of
other households determines consumption level. The hypothesis is based on three
relative aspects:
? A household's income position is relative
to its associates or group to which it belongs.
? A household's present income is relative to
its previous incomes.
? The wellbeing of society depends on
Government intervention through economic measures.
By this, he posited that households strive constantly toward a
higher consumption level and emulate the consumption pattern of a neighbor.
(Ohale: 2002).If income of all individuals/household increases by the same
percentage, and then relative income would remain the same despite the increase
in absolute income. Since the relative income remains the same, the same
proportion of income would still be spent on consumption, Average Propensity to
Consume (APC) will thus, remain the same. To capture the determinant of
aggregate consumption expenditure in Rwanda, the following model has been
specified by the researcher: GCE= f(Y, INT, INF, and EXR).Where GCE = Gross
Consumption Expenditure Y= Income (GDP), INT= Interest Rate, INF= Inflation
Rate, EXR= Foreign Exchange Rate.
28
Thus, GCE= â0
+â1GDP+â2INT+â3INF+â4EXR+u
Where: â0>0, â1>0,
â2><0, â3<0, â4<0
? Gross Consumption Expenditure proxied by GCE
is the consumption without tax or other contributions having been
deducted. In other words, it is the consumption at current prices used by
household in the community.
? Income: The researcher used GDP
as a proxy for income. A positive sign is expected as there is a
direct relationship between consumption and income. Consumption expenditure is
expected to increase with an increase in income.
? Interest Rate: (Proxied by
INT) an increase in lending interest rate may lead to a
decrease or increase in consumption. As such, the expected sign was determined
by researcher findings.
? Inflation Rate: we use INF
as a prosy of inflation rate. This tries to capture the effect of
increase in price level of consumption. When there is inflation (general price
level increase), the real value of the consumer's cash balance is falls. As
such their purchasing power is hampered, leading to a fall in consumption
expenditure. Thus an inverse relationship is expected to occur between
inflation and consumption; therefore, the researcher interpreted this
hypothesis regression.
? Exchange Rate: The researcher used
EXCHR as a proxy of exchange rate. The researcher attempted to
capture how households react to changes in price of foreign goods by including
exchange rate of Rwandan currency to dollar in the used model. This stems from
the fact that about 1837.3 b Frw of consumer goods is imported
from foreign countries which include food items, services, automobiles, etc.
While Exported goods are 846.15 b Frw. Thus the expected sign
of the relationship between exchange rate and consumption expenditure shown by
the researcher after regression. To estimate the results, the researcher
employed the ordinary least square (OLS) method of estimation to check for
variables that determine consumption.
29
WORLD BANK DATA USED BY RESEARCHER
|
Year
|
GDP
|
EXCH
|
CPI
|
GCE
|
|
1995
|
338.21
|
262.18
|
37.5
|
327.73
|
|
1996
|
423.41
|
306.82
|
40.07
|
398.87
|
|
1997
|
557.83
|
301.53
|
44.88
|
527.68
|
|
1998
|
621.49
|
312.31
|
47.67
|
577.77
|
|
1999
|
607.77
|
333.94
|
46.52
|
554.34
|
|
2000
|
674.18
|
389.7
|
48.34
|
631.31
|
|
2001
|
739.79
|
442.99
|
49.95
|
637.91
|
|
2002
|
798.62
|
475.37
|
50.95
|
713.06
|
|
2003
|
994.65
|
537.65
|
54.74
|
876.37
|
|
2004
|
1206.87
|
577.45
|
61.45
|
1056.7
|
|
2005
|
1439.176
|
557.82
|
66.99
|
1149.1
|
|
2006
|
1715.81
|
551.71
|
72.94
|
1340.7
|
|
2007
|
2067.5
|
546.96
|
79.56
|
1520.6
|
|
2008
|
2624.88
|
546.85
|
91.85
|
2017.9
|
|
2009
|
3017.56
|
568.28
|
97.74
|
2318.6
|
|
2010
|
3323.84
|
583.13
|
100
|
2583.3
|
|
2011
|
3847.98
|
600.31
|
105.67
|
3001.6
|
|
2012
|
4435.24
|
614.3
|
112.3
|
3440.1
|
|
2013
|
4862.73
|
600.31
|
121.32
|
3614.7
|
|
2014
|
5379.87
|
614.3
|
122.87
|
3988.9
|
|
2015
|
5741
|
701.03
|
123.91
|
3862.7
|
Source: World Bank indicators1995-2015
Table 1: Status and trends of gross
consumption expenditure, Gross domestic product, Interest rate, Consumer price
indices (Inflation) and exchange rate in Rwanda from 1995 up to 2015
30
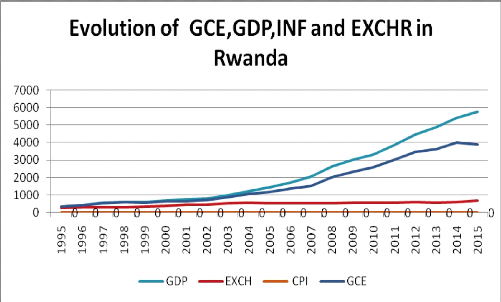
Source: World Bank indicators1995-2015 and author's
computation
Figure 2: Status and trends of gross consumption
expenditure, Gross domestic product, Interest rate, Consumer price indices and
exchange rate in Rwanda from 1995 up to 2015
Gross Consumption Expenditure: According to
the above figure, the post 1994 Genocide (from 1995), household consumption in
Rwanda was very low where percentages show that 94.31 % of Rwandans consumed
327.73 Frw. Because of post war period, the economic system were destructed,
infrastructures were ruined by the war so that every economic sector were
shocked. But from 1995, statistics show that there is an increase of the level
of gross consumption expenditure from 1995-2015 where it started from 327.73
Frw from 1995 and grew slowly until 2004 where consumption reached 1056.73.
Within 3 years (from 2005 to 2007), the level of consumption grew quickly where
it reached 1520.55 Frw. Because different initiatives put in economic sector by
the Government of Rwanda, the level of consumption were increased at high rate
where from 2008 to 2011, an increase of 983.67Frw whereby 78% of Rwandans
consumed 3001.55Frw. From that period, the level of consumption grew slowly by
422.6 Frw because of different economic challenges.
31
Gross Domestic Product: According to the
above figure, using the documentary technique, the researcher has obtained data
from the World Bank. The data have been analyzed and
interpreted using the statistical, analytical and synthetic methods. The
statistical method helped the researcher to plot the evolution of GDP of Rwanda
from 1995 to2015. The figure 2 above shows that the gross domestic product has
the upward trends. They are increasing over time because from 1995 up to 2003,
the level of GDP has grown by 656.44 b Frw, but because of economic
reconstruction as well as the whole country, this level grew slowly in a period
of 8years thereafter that period, the level of GDP grew rapidly because after
presidential elections, many policies put in action such as increase of foreign
direct investment, increase of domestic agro processing industries, financing
the small and medium entrepreneurs, etc. Normally, this is shown by the above
given figures where from 2004 up to 2009, there is a high increase compared to
the starting period with 1810.69 b Frw which means that is are positive trend.
From 2010 up to 2015, there is a continuous increase in GDP because the level
of increase is 2417.16 b Frw.
Exchange rate: The exchange rate in Rwanda
has been fluctuated in four main categories under relative period from
1995-2015. From 1995, the Government of Rwanda introduced the regime of
floating exchange rate where this exchange rate is allowed to fluctuate in
response to the economic condition. We normally know that in a fixed exchange
rate regime, the Central Bank trades domestic for foreign currency at a
predetermined level of price. The post Genocide period of 1995-2015 was a
period of reconstruction in whole Country particularly in the economic system.
Therefore, from 1995 up to 1999, the; level of exchange rate has been
fluctuated (increased one hand and decreased on the other hand). The lower
level of net export which is the exports minus imports is the main determinants
of exchange rate. This lower level of net export was low from many years ago
because Rwanda is a landlocked country and it does not have natural resources
that can induce the level of domestic production as well as the level of
export. With policy of monetary targeting used by the central bank of Rwanda,
from 2000 up to 2005, the money market which is introduced in the period of
1999-2005 to increase the level of transactions among domestic commercial
institutions. This has changed many things in Rwandan economic system. The
system faced an increase in money supply where this increase in money causes a
decrease of interest rate of bonds. Because we are in open economy, the
domestic rate of interest would be equal to the world one. So the system faced
many investors who converted Rwandan currency into foreign currency to invest
outside of the Country (Capital outflows). There is therefore a depreciation of
the domestic currency. This depreciation of the domestic currency causes the
exchange rate to flow down, induce the level of net export without forgetting
the level of income. Even if it is so, the national
32
export, at lower level than import, have a lower price outside
the country. The introduction of capital market in Rwanda in 2005 did change
nothing on depreciation of Rwanda currency. From 2005 up to 2011, the exchange
rate continued to decrease where it shifted from 557.82 to 600.31 by one
dollar. Because of the trade balance deficit faced by Rwanda economic system a
longtime ago, there is a continuous decrease of exchange rate which depreciate
our domestic currency whereby from 2012 to 2015, domestic currency depreciated
by 2.81%. Without going far from the facts, an increase in Government spending
(Expansionary fiscal policy) is the only solution because it can increase
income and interest rate on bonds which can make capital inflows and appreciate
the domestic currency. The level of exchange rate will increase which will
lower net export and income. Thus offset occurs between incomes.
Inflation: The annual percentage change in a
Consumer Price Index (Inflation) is used to measure inflation. The Consumer
Price Index (CPI) can be used to index the real value of wages, salaries,
pensions, and price regulation. It is one of the most closely watched national
economic statistics. The consumer price index (CPI) is a statistical estimate
of the level of prices of goods and services bought for consumption by
households. It measures changes in the price level of a market basket of goods
and services used by households. The CPI is calculated by collecting prices of
a sample of representative items over a specific period of time. Goods and
services are divided into categories, sub categories, and sub-indexes. All
information is combined to produce the overall index of consumer expenditures.
Such that the annual percentage change in a CPI is used to measure inflation,
in Rwanda, the level of inflation measured by CPI, from 1996-2002, the levels
of price were decreasing because many people were outside the country due to
the 1994 Genocide while domestic production were high. With many programs of
sensitizing refugees to comeback because of security, the level of population
increased and the level of price started to rise due to lower level of
production.
However, in 1999, a shock happened where the level of price
decreased gradually and it riches a negative value. This was caused by high
level of production (Supply) against lower level of demand. It is like a short
run deflation. From 2003 up to 2008, a continuous rise of price occurred
because of the continuous rise of the population. (DHS: 2005). But again from
2008 to 2015, because many policies put into action by the Government of Rwanda
like, Girinka, Umurenge SACCOs, Agriculture policies of irrigation as well as
new investments in different economic sectors like industrialization, financial
institutions, and so on, all those policies increased the level of consumer
goods therefore the level of price reduced by 12.9% which shows a high impact
in the economy.
33
CPI calculation:
For example, imagine you buy five sandwiches, two magazines,
and two pairs of jeans. In the first period, those goods are market basket at
base period prices = 5(6.00) + 2(4.00) + 2(35.00) = 108.00. Market basket at
current period prices = 5(7.00) + 2(6.00) + 2(45.00) = 137.00. The CPI
represents the cost of a basket of goods and services across the country on a
monthly basis. Those goods and services are broken into eight major groups:
Food and beverages Housing, Apparel, Transportation, Medical care, Recreation,
Education and communication and other goods and services. From the above
example:

From the above figure, the rate of lending interest rate in
Rwanda is at high level. Normally, Rwanda institutions seek for high return
compared to the level of income as well as the rate of people that take credits
in good collaboration with financial institutions to induce the level of
investment in the community. From 1995 to 1999, the rate of lending interest
was 17 and 16%. This is the post Genocide period where financial institutions
started to reconstruct without enough capital as well as qualified employees.
The monetary authorities and commercial banks have had faced the problem of
dealing with the lower level of money. Measures were put in place to call upon
people to use credits as a financial support in order to induce the level of
investment in Rwanda as well as domestic production. Fluctuations continued
where from 2003 to 2009, the level of interest rate changed from 16 to 17%. The
introduction of money market and capital market (1999-2005) has had affected
the increase of that rate. However a continuous depreciation of the domestic
currency affects the level of interest rate because the economic system cannot
attract foreign investors. From 2010 to 2015, the level of interest rate
changed from 18 to 19%. Local people as small and medium entrepreneurs are not
attracted by financial institutions to take loans because of that high level of
interest rate. If is so, the level of investment cannot increase to affect the
level of income. By lower level of income, household consumption is also
decreased.
34
Partial conclusion
With the above findings, the explained variable GCE has upward
trend as it is shown by numbers. By 1995 to 2003, the level of consumption
increased from 327.73 Frw up to 876.37 Frw per household (96.95% to 88.1%) i.e
96.95 % of household in Rwanda consumed 327.73 Frw in 1995, this is the post
1994 Genocide in the country where all sectors including economic ones were
destructed by conflicts. However, after presidential elections, the level of
consumption in Rwanda has gradually increased again because of many policies
put into action by the Government of Rwanda. From 2004 up to 2007, the levelof
consumption faced a high increase because 87.55% up to 73.51% of Rwandan
consumed between 1056.73 Frw to 1520.55 Frw. Thereafter, from 2008 up to 2015,
the level of consumption has been increased by about 2.55% where a decrease
vary between73.51% to 69.4%. Generally, from 1995 up to 2015, the level of
income has affected positively the gross consumption expenditure. The
continuous level of interest rate is a challenge to the household market
basket. The level of inflation is also a challenge to the consumption because
the income from investments is affected by inflation. A continuous depreciation
of the domestic currency to the dollar causes the imported goods to be very
expensive. Therefore, the next chapters give the econometric facts to know the
exact relationship between variables used in the model. Therefore, the
researcher affirms, based on the first hypothesis that the trends of the used
model are upward sloping and the used variables are significantly related.
35
CHAPTER 3: ECONOMETRIC ANALYSIS OF THE RELATIONSHIP
BETWEEN GROSS CONSUMPTION EXPENDITURE AND ITS DETERMINANTS IN
RWANDA
| 

